Apple (NASDAQ:AAPL) has fallen by more than 10% since it hit a high of $180.10. At the lows of yesterday's trading range, the stock was down by more than 13% from the peak it hit in January 2018.
However, it managed to claw back higher and ended up 4.18% for the day. This is quite an impressive feat. The question for investors now will be : Is this the time to buy Apple?
Warren Buffett once said this "Be fearful when others are greedy and greedy when others are fearful". This is a very wise saying. You make money when you buy stocks that are selling at a discount. A falling market can be a great opportunity for investors to buy stocks with solid fundamentals at a cheaper price.
One of the ways to bottom-fish intelligently is to look for important support areas in a stock. If a healthy company drops to an area of support, then it makes sense to buy more. When the panic selling in the stock market ends, the stock price will go up to reflect its true value.
At this moment, I believe that Apple is at a very important support area.
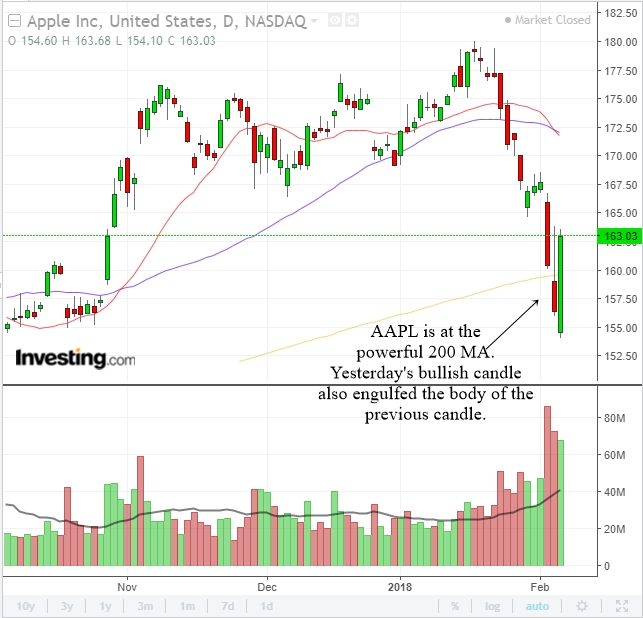
The chart above is the daily chart of AAPL. As you can see, the stock had a sell off and is currently at the powerful 200 DMA. The yellow line is the 200 MA, which is widely followed by many investors and traders. Stocks can often bounce up when it touches the 200 MA, which is why AAPL shot higher yesterday.
Besides being at the 200 MA, AAPL formed a bullish engulfing pattern yesterday when the body of the green candle engulfed the body of the previous red candle. This is a bullish reversal candlestick pattern that often hints at the end of a correction.
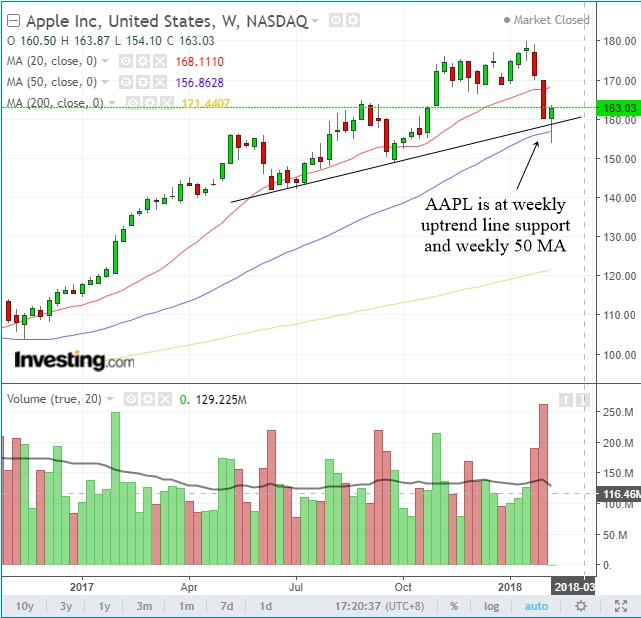
The chart above is the weekly chart of AAPL. Looking at the weekly chart can give us a big picture of how a stock is doing in the long term. AAPL is now trading at the weekly uptrend line.
Trendlines are powerful because stocks can often bounce up when they touch a long term trendline. AAPL is also correcting to its rising weekly 50 MA which can act as a psychological support.
At this moment, the weekly chart shows us a bottoming tail developing in AAPL. Since we have not ended the trading week, we do not know whether the pattern will form or not. If AAPL manages to form a bottoming tail reversal pattern by the end of this trading week, it will be a very bullish sign for AAPL.
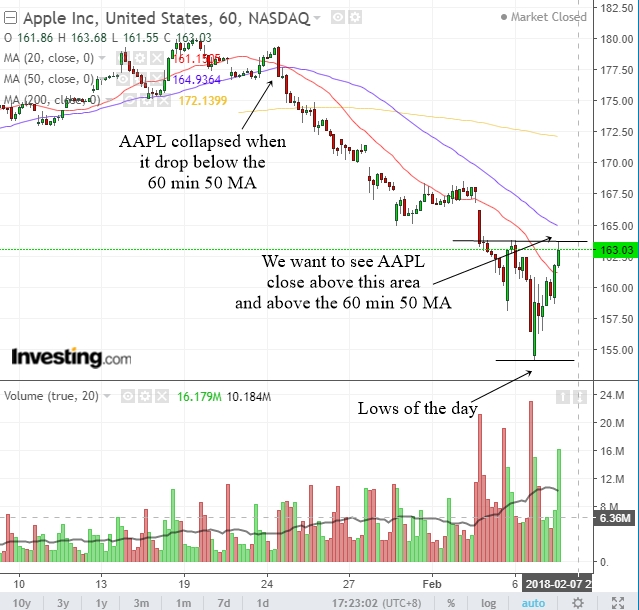
For timing purposes, we can often use a smaller time frame to see what is happening in the stock. The chart above is the 60 min chart of AAPL. The smaller time frames can often give us an early warning of an important move in the daily charts.
Notice how AAPL collapsed when it dropped below the 60 min 50 MA. The stock also experienced a bearish cross where the 50 MA crossed below the 20 MA. The moving averages may not be perfect but they can help us to identify trend changes.
At this moment, AAPL has given us an area of reference that we can use to determine whether the support in the daily and weekly charts will hold.
If AAPL manages to break above the 163 area and go back above the 60 min 50 MA, then it is very likely that AAPL will be able to move higher. On the other hand, if AAPL drops below the 155 area and breaks below the low of yesterday's trading day, then we know more selling will happen.
Patience is needed when trying to buy the dips, but for those who are observant, it can be a very rewarding investment.


