NVDA Q3 Earnings Alert: Why our AI stock picker is still holding Nvidia stockRead More

Is Godzilla About To Crush The Nikkei?

Published 08/05/2016, 10:45 AM
Updated 05/14/2017, 06:45 AM
JP225
-

Falling Trend

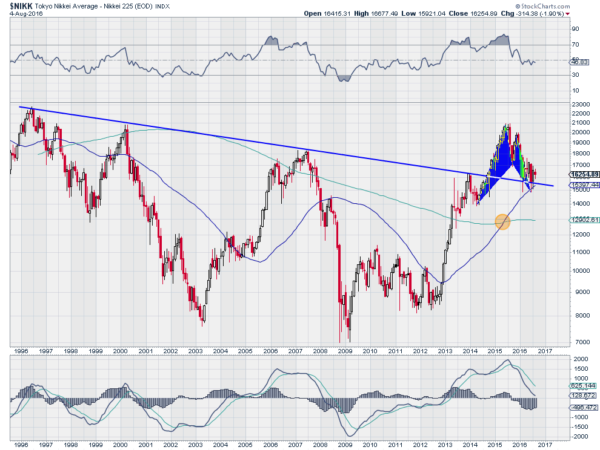
The chart below shows the Nikkei average over the past 20 years. Each bar or candlestick represents 1 month of price activity. There is a lot going on in the chart so lets start from 1996 and work forward. The first thing to note is the falling trend line across the tops in the Nikkei. It took the fourth try in 2014 to break above that trend line. The Average continued higher then to about the 2000 peak. It could not muster up any more strength to hit the 1996 high.

The Nikkei started back lower pulling back to that prior resistance trend line. Now it is acting as support though. Often when a market breaks resistance it will come back to retest it before reversing back higher to new highs. Put that one in the plus column. The Nikkei also managed to reconnect with its 50-month SMA in July, something it had not done since 2012. A quick touch and it moved back higher. Another one for the plus column. And there is a Golden Cross, with the 50-month SMA crossing up through the 200-month SMA, a bullish signal, especially with the Nikkei over both of them.
Nikkei

The two blue triangles appeared recently. They represent a bullish harmonic Bat pattern. The pattern reached its Potential Reversal Zone (PRZ) and did reverse. It has retraced 38.2% of the pattern, so it could be over, but continuation would look for a move to a 61.8% retracement. That would be to 18300 or so. Quite an abundance of evidence to support a move higher. On the other side of the ledger is the MACD continuing lower. It is not quite negative yet but falling. The RSI is also on the edge of the bullish zone, and may be stabilizing after falling. Even the bearish column is not so bearish.

So why all the fear that Godzilla (Abe) will crush the market? Best to just follow the evidence playing out in the price action. The Godzilla crush may be yet to come. But it will not happen until the Nikkei drops back below that long term trendline.

Latest comments

Loading next article…
Risk Disclosure: Trading in financial instruments and/or cryptocurrencies involves high risks including the risk of losing some, or all, of your investment amount, and may not be suitable for all investors. Prices of cryptocurrencies are extremely volatile and may be affected by external factors such as financial, regulatory or political events. Trading on margin increases the financial risks.
Before deciding to trade in financial instrument or cryptocurrencies you should be fully informed of the risks and costs associated with trading the financial markets, carefully consider your investment objectives, level of experience, and risk appetite, and seek professional advice where needed.
Fusion Media would like to remind you that the data contained in this website is not necessarily real-time nor accurate. The data and prices on the website are not necessarily provided by any market or exchange, but may be provided by market makers, and so prices may not be accurate and may differ from the actual price at any given market, meaning prices are indicative and not appropriate for trading purposes. Fusion Media and any provider of the data contained in this website will not accept liability for any loss or damage as a result of your trading, or your reliance on the information contained within this website.
It is prohibited to use, store, reproduce, display, modify, transmit or distribute the data contained in this website without the explicit prior written permission of Fusion Media and/or the data provider. All intellectual property rights are reserved by the providers and/or the exchange providing the data contained in this website.
Fusion Media may be compensated by the advertisers that appear on the website, based on your interaction with the advertisements or advertisers.
© 2007-2024 - Fusion Media Limited. All Rights Reserved.