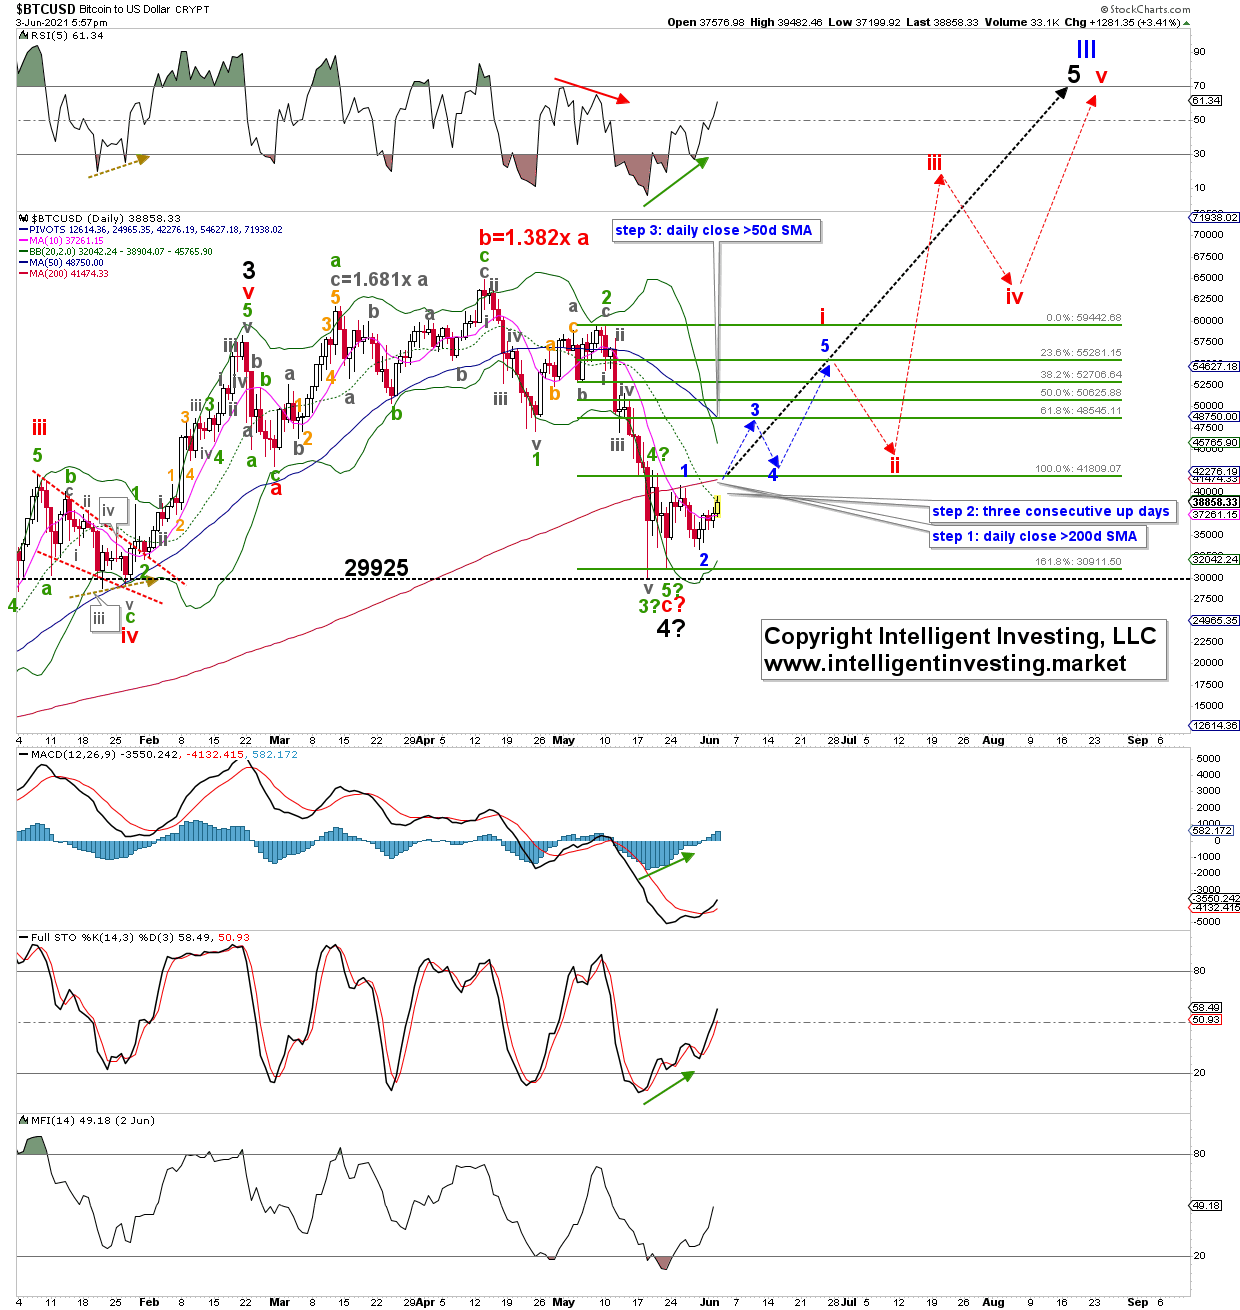
In my update from mid-May, I anticipated “a complex price move down to the low $40,000s [ending diagonal] before the next more significant rally to as high as $90,000+ starts. I will have to change my point of view when Bitcoin rallies back above $59,000 from current levels with a severe warning to the bears on a rally back above $55,100.”
I thought it would be an ending diagonal “until proven otherwise,” as I recognized I had “not enough price information available to confirm it.” As Bitcoin dropped quickly to the 161.80% Fibonacci-extension of (green) minor wave-1, measured from the top of minor wave-2, by mid-May it invalidated the diagonal pattern. See Figure 1 below.
As always, “anticipate, monitor and adjust if necessary” is all we can do. My anticipation was wrong, hence I adjusted. Regardless, looking down was the correct point of view, albeit we got a bit more than bargained for ($40,000 anticipated vs $30,000 achieved). The drop to $29,925 on May 19, the subsequent rally to $42,520 (the 100% Fibonacci-extension) and then the next drop to $31,007 can be viewed, in Elliott Wave Principle (EWP) terms as a 3rd, 4th, and failed 5th wave; respectively.
Figure 1: Daily Bitcoin candlestick chart, with EWP count and technical indicators

I do not prefer failed 5th waves, as those are rare and, thus, unreliable, but the market could care less what I prefer. If BTC can rally above the end of (green) minor wave-1 (April 25th low at $47004), I must view the complex irregular flat correction as complete. Then, ideally, the blue and red dotted arrows as outlined in Figure 1 should be the preferred path along which BTC should rally over the next few months. This path is accurate in price, but not in time.
Barring any Fibonacci-extensions of the waves, the cryptocurrency should then ideally target around $85,000 for (black) major wave-5 of (blue) Primary wave-III. However, there is also genuinely good, bigger picture, Fib-confluence in the $100K+/-10K region. I developed a three-step process to help me determine if the new uptrend has started. See Figure 1.
When BTC can check all three boxes it is, in my opinion, good to go. For now, it has not even checked off box 1 “move above the 200-day simple moving average.” Thus, there is still considerable downside risk. Namely, the above outlined bullish path only remains preferred and in play if BTC can stay above Sunday’s low ($33,425) and especially $29,925. Any drop below these level targets ideally $24-27.5K instead before the mentioned multi-month bull run starts.
