In my update about Bitcoin from two weeks ago, I concluded:
“Now may be a good time to be patient and let the market tell us where and when to place a low-risk, high-reward trade.” Because “using the Elliott Wave Principle (EWP) combined with technical analysis, there has been a 3-3-5 [waves] move since the late February high. This means two things: … a run to new all-time highs is under way (red path). Or, these smaller five waves are only the start of a more extensive five-wave down sequence (green route). How do we know which option is operable? Simple: If the price of BTC stalls at around $60,000 +/- 1000 and then starts to decline, the green path is operable. But if the price continues to rally past the upper end (>$61K), then the red course is most likely, and BTC should be on its way to $90K+.”
What has happened since then?
First, Bitcoin stalled in the ideal (red) bounce target zone (at $59,587 to be exact vs. my $60K+/-1K forecast).
Second, it revolved around its 50-day simple moving average for most of the time. It appeared investors were waiting for a catalyst to determine the outlined red path vs. green path. On Wednesday, Tesla (NASDAQ:TSLA) suspended vehicle purchases using Bitcoin. There was the trigger, and BTC dropped to as low as $47,000. The red path was negated. Remember, markets are all about probabilities of possibilities, and when one door closes, another one opens.
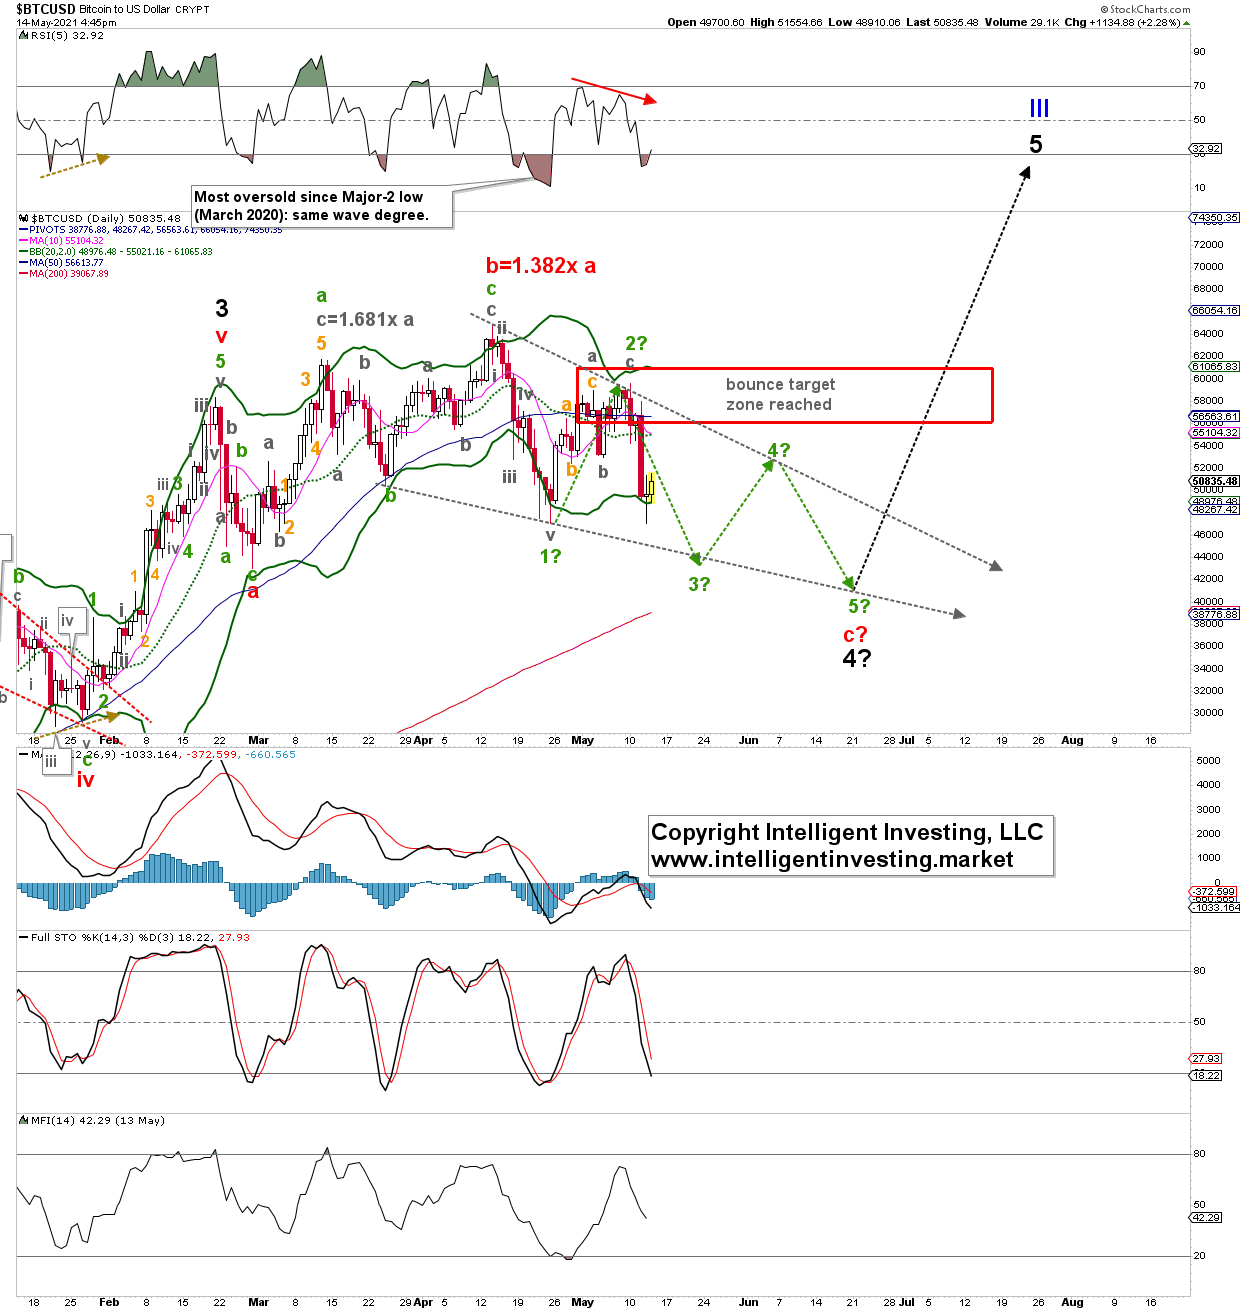
Here I would like to focus on the green path, as shown in Figure 1 below.
Figure 1. Daily Bitcoin candlestick chart, with EWP count and technical indicators

Although I do not have enough price information, given the anticipated short-term rally (green arrow to “2?”) was correct in time and price, I continue to view the current decline as part of an ending diagonal (grey downward pointing arrows) until proven otherwise. Diagonals, or wedges, are terminal patterns: in this case, red intermediate wave-c of black major wave-4. Once a diagonal completes, the rally coming out of it will be swift. In this case, a major wave 5. Unfortunately, ending diagonals are often complex overlapping price structures. Thus, for now, I view green minor wave-3 is under way, subdividing into smaller waves. If BTC stays below $55,100, this is the most viable option.
Bottom line: For now, Bitcoin took the green path as outlined two weeks ago. Therefore, I continue to anticipate a complex price move down to the low $40,000s before the next more significant rally to as high as $90,000+ starts. I will have to change my point of view when BTC rallies back above $59,000 from current levels with a severe warning to the bears on a rally back above $55,100.
