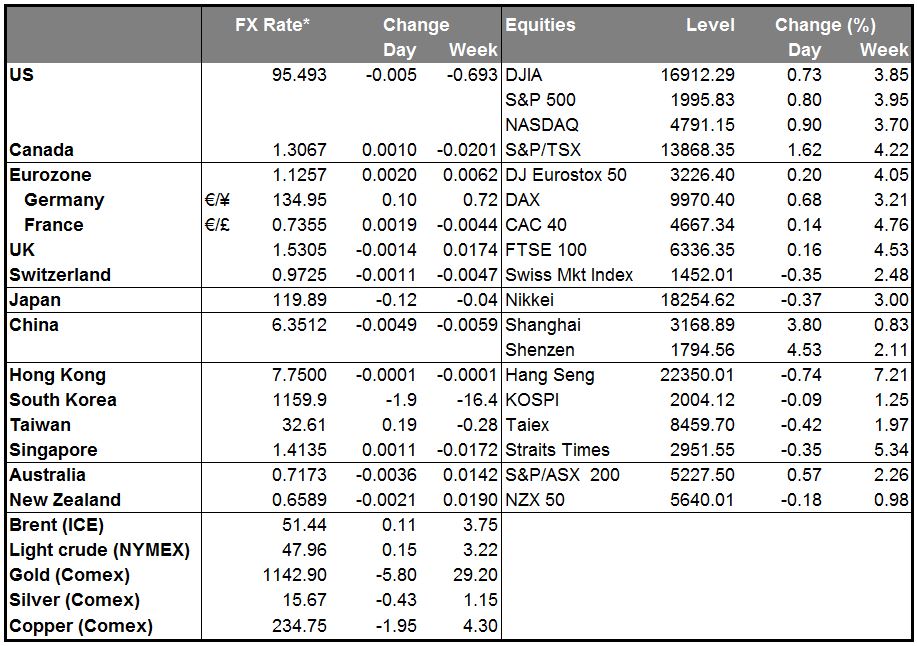
•Chinese markets open higher after a week-long break. Chinese stock markets, which have been under heavy selling pressure due to growth concerns and the devaluation of the yuan, rallied a bit after re-opening following the break since the end of September. The Shanghai Composite was up around 3.8%, trying to catch up the recent rally in global equity markets. The positive sentiment could roll into the European markets and keep them elevated.
• Overnight Japan’s current account surplus rose further in August, beating expectations of a moderate decline. On the other hand, machine orders plunged 5.7% mom in August, from -3.7% mom previously, missing expectations a 2.3% rise. This was the third successive drop, adding to the recent weak data coming from the country. The reaction on JPY was limited, as investors remain focus on the much anticipated end of October meeting.
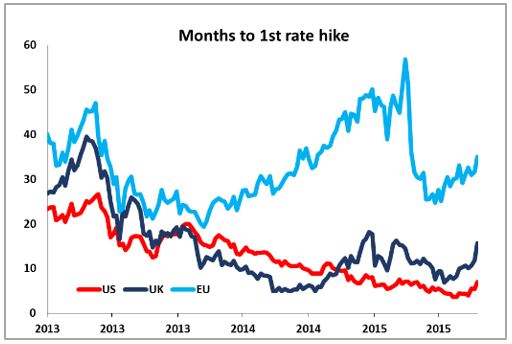
• Today’s highlights: During the European day, the spotlight will be on the Bank of England monetary policy meeting. With no change in policy expected, the number of dissenting votes is likely to be the key point again. The consensus is that the vote will once again be split 8-1, with Ian McCafferty to maintain his call for a rate rise. Market participants will be eager to see if McCafferty is joined by the formerly hawkish Martin Weale or Kristin Forbes, who argued that the underlying inflation should start to pick up soon and monetary policy would need to be tightened sooner. Despite the recent hawkish comments, however, market expectations for BoE tightening have been pushed back, with the timing for the first rate hike now slipping from around 9 months in August (meaning the first hike to occur around April) to 15 months in October. This explains a bit the recent weakness seen in GBP.
• In addition to the BoE meeting, the Fed releases the minutes of its September FOMC meeting. At this meeting the FOMC remained on hold, as the market had anticipated, but surprised investors by presenting a more dovish outlook than expected. The Committee did discuss the idea of hiking rates at this meeting, but decided not to because of global factors (as opposed to strong domestic factors). Although the market has shifted expectations of a Fed hike out to March 2016, many Fed officials continue to signal their willingness to raise rates before the end of the year. In the minutes released today, we will have the opportunity to see how close the call for a September liftoff was, and if they are likely to start hiking if the global environment calms down. In such case, USD could regain some of its lost momentum.
• As for the indicators, German trade surplus declined more than expected in August. This weakened EUR a bit.
• From Canada, we get the housing starts for September. The forecast is for the figure to decline somewhat, which could prove CAD-negative.
• In the US, initial jobless claims for the week ended Oct. 3 are coming out.
• We have several speakers in today’s agenda: ECB Executive Board member Peter Praet, St. Louis Fed President James Bullard, Minneapolis Fed President Narayana Kocherlakota, BoE Governor Mark Carney and San Francisco Fed President John Williams speak.
The Market
EUR/USD hits support slightly above 1.1200
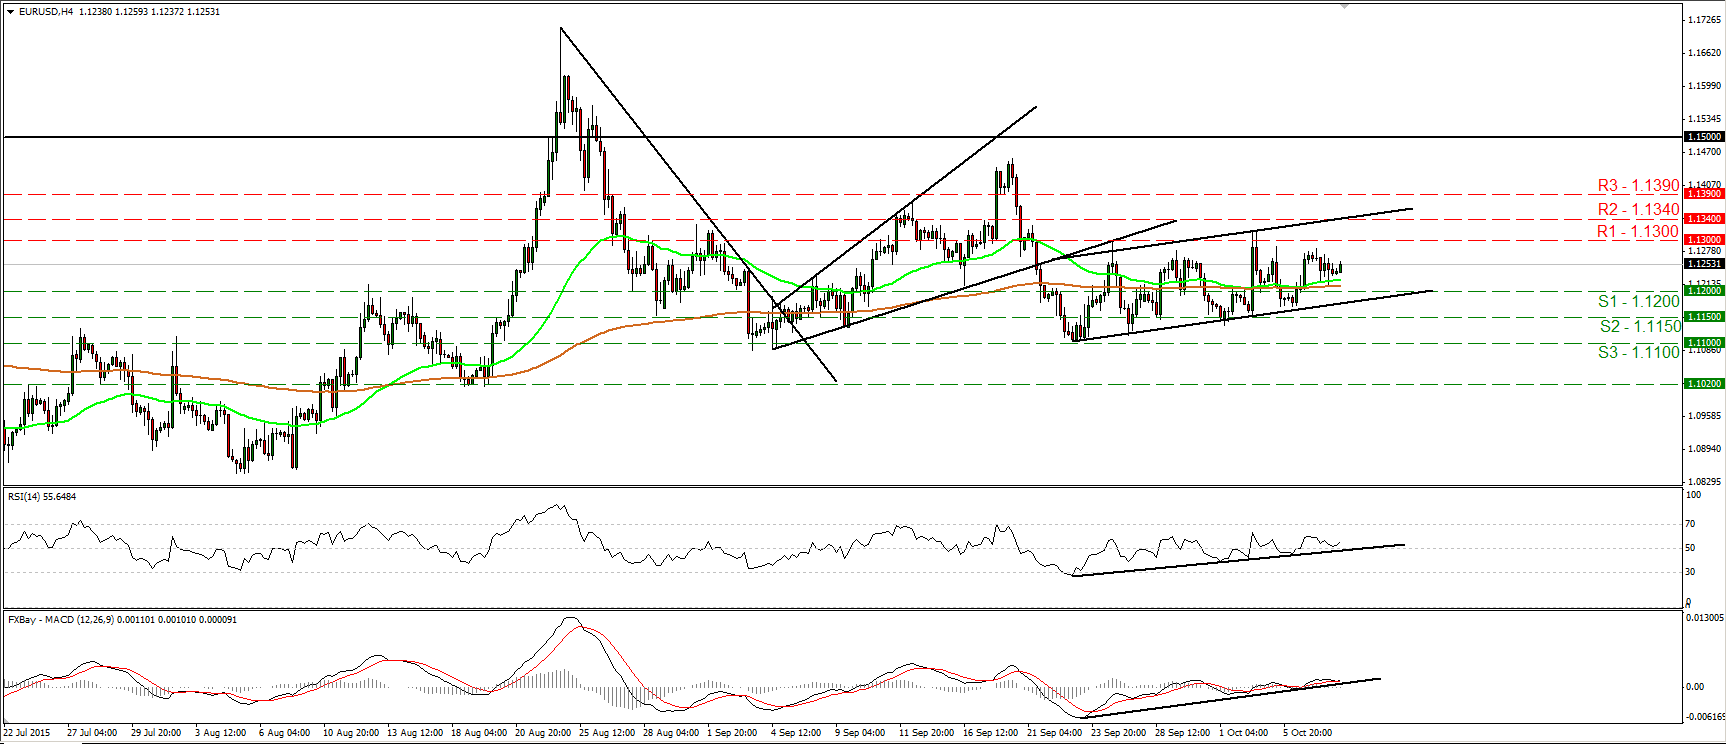
• EUR/USD traded lower on Wednesday, but hit support marginally above 1.1200 (S1) and then it rebounded somewhat. I would expect the rebound to continue for a while and perhaps aim for the 1.1300 (R1) line. A break above 1.1300 (R1) is likely to target the next resistance at 1.1340 (R2). The RSI turned up after it found support near its 50 line, while the MACD, already positive, shows signs that it could rebound from near its trigger line. These indicators detect positive momentum and support that the rate could still trade higher for a while. In the bigger picture, as long as EUR/USD is trading between the 1.0800 key support and the psychological zone of 1.1500, I would hold a flat stance as far as the overall picture is concerned. I would like to see another move above 1.1500 before assuming that the overall outlook is back positive. On the downside, a break below the 1.0800 hurdle is the move that could shift the picture negative.
• Support: 1.1200 (S1), 1.1150 (S2), 1.1100 (S3)
• Resistance: 1.1300 (R1), 1.1340 (R2), 1.1390 (R3)
GBP/USD finds resistance near 1.5330 ahead of the BoE meeting
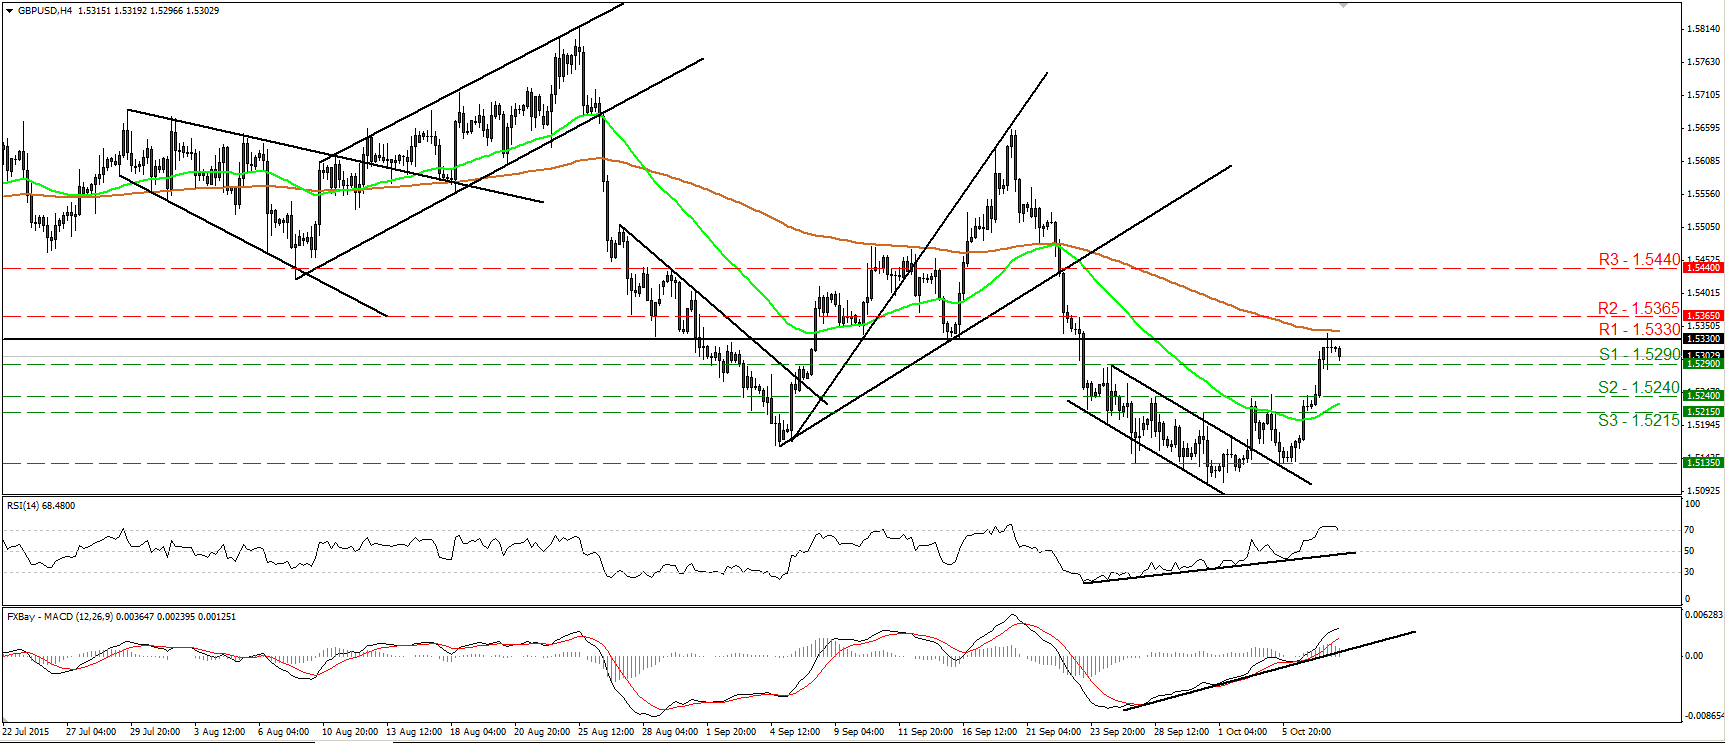
• GBP/USD traded higher yesterday, and managed to hit resistance slightly above the 1.5330 (R1) key resistance line. The short-term trend remains positive in my view, but we need a clear move above 1.5330 (R1) to have its continuation. Something like that could initially target the 1.5365 (R2) line and then the 1.5440 (R3) hurdle. Today, we have a BoE meeting and we also get the minutes of the meeting at the same time. The market attention will be once again be on whether any other members will join McCafferty in voting for a rate hike. In such a case, the pair could strengthen and manage to overcome the 1.5330 (R1) zone. Our short-term oscillators though, give evidence that a pullback could be looming ahead of the meeting, perhaps even below the 1.5290 (S1) support line. The RSI has topped within its overbought territory and just fell below 70, while the MACD, although positive, shows signs of topping. Plotting the daily chart, I see that cable remains below the 80 day exponential moving average. However, given the recent rally and that it is possible to continue, I would adopt a “wait and see” stance as far as the overall outlook of the pair is concerned.
• Support: 1.5290 (S1), 1.5240 (S2), 1.5215 (S3)
• Resistance: 1.5330 (R1), 1.5365 (R2), 1.5440 (R3)
USD/JPY trades somewhat lower
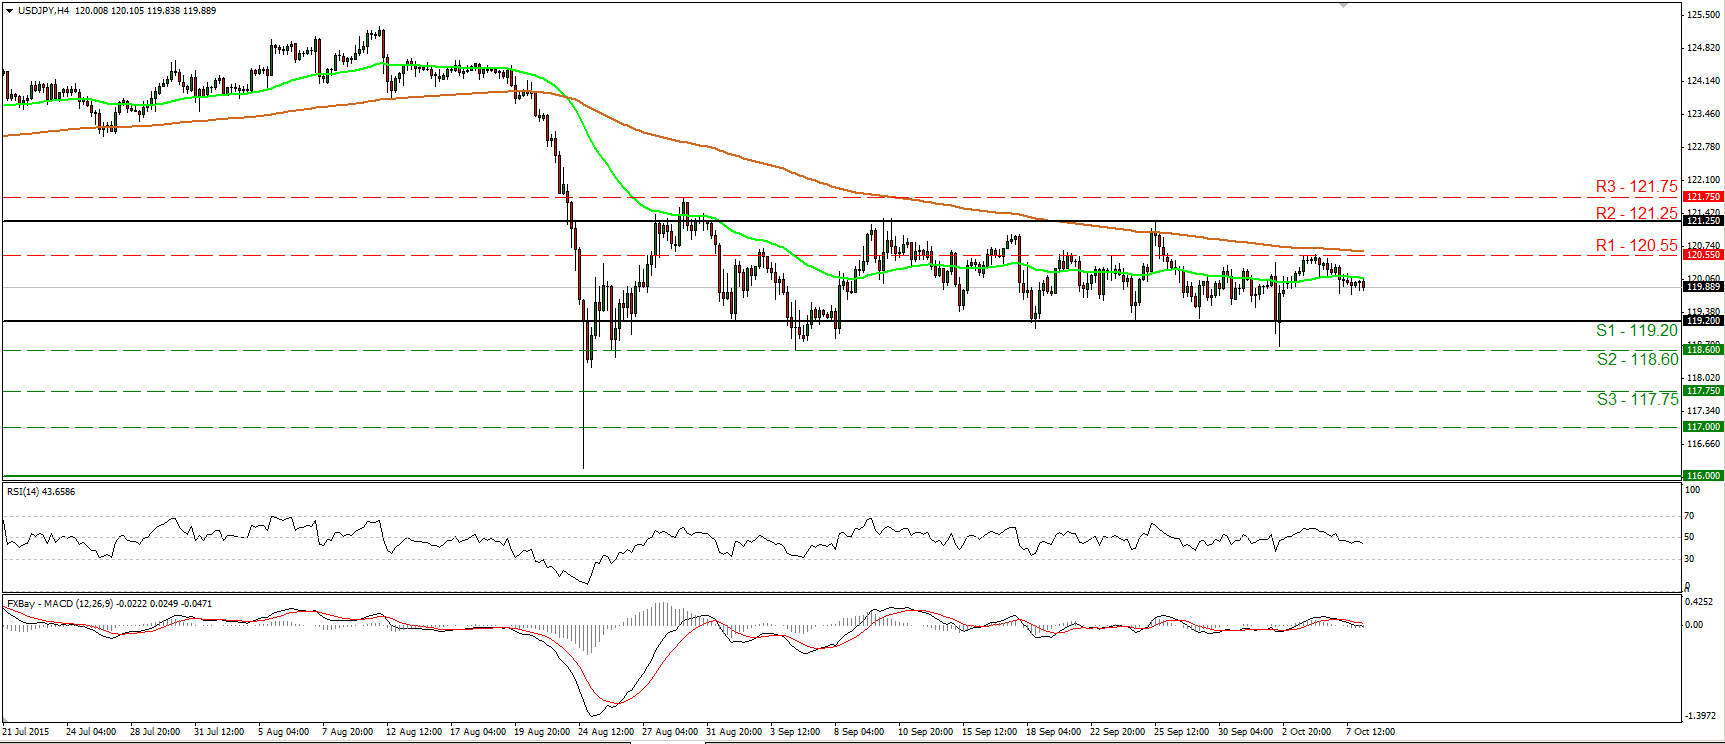
• USD/JPY continued trading lower on Wednesday, after it hit resistance at 120.55 (R1) on Tuesday. The rate is still trading within a sideways range between the support of 119.20 (S1) and the resistance of 121.25 (R2). As a result, I would still consider the short-term outlook to stay neutral. I believe that a break below 119.20 (S1) is needed to turn the near-term picture back to the downside. Something like that could initially aim for the next support at 118.60 (S2). The RSI fell below its 50 line and is pointing down, while the MACD, already below its trigger line, has just obtained a negative sign. These momentum indicators support that the rate could continue trading lower, at least for a test at 119.20 (S1), the lower bound of the aforementioned sideways range. As for the broader trend, the plunge on the 24th of August signaled the completion of a possible double top formation, which turned the medium-term outlook somewhat negative. As a result, I would treat the recovery from the 116.00 zone as a corrective phase and I believe that it is more likely for the pair to exit its short-term sideways range to the downside in the foreseeable future.
• Support: 119.20 (S1), 118.60 (S2), 117.75 (S3)
• Resistance: 120.55 (R1), 121.25 (R2), 121.75 (R3)
Gold hits resistance slightly below 1155 and pulls back
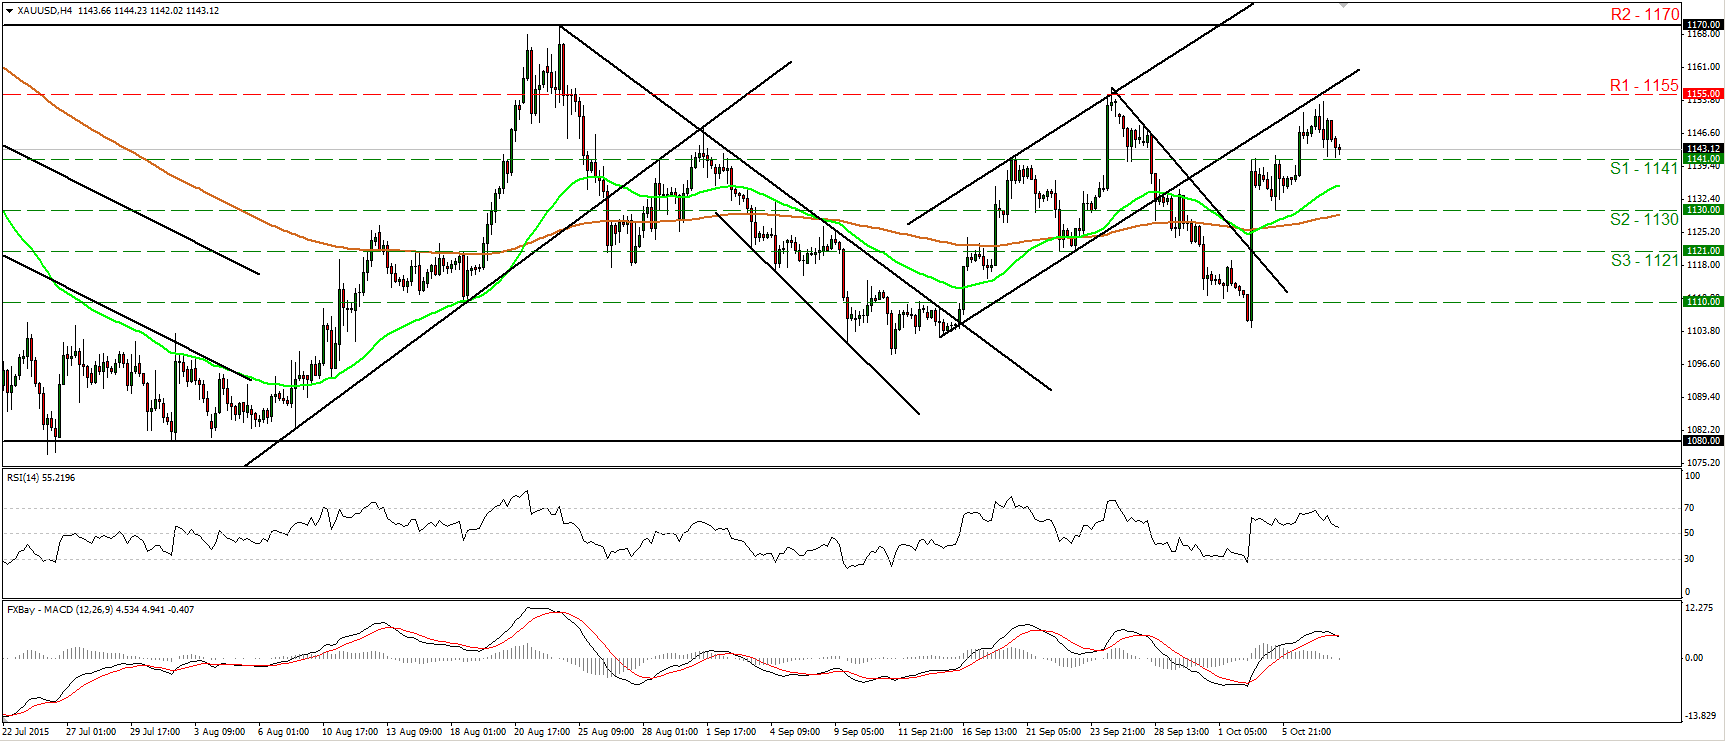
• Gold traded somewhat higher yesterday, but hit resistance slightly below the 1155 (R1) obstacle, defined by the peak of the 24th of September. Subsequently, the metal retreated to challenge the 1141 (S1) line as a support this time. Although the price structure still suggests a short-term uptrend, I see the likelihood for the pullback to continue for a while. A clear break below 1141 (S1) could confirm the case and perhaps open the way for the next support at 1130 (S2). Our short-term oscillators support the notion as well. The RSI hit resistance at its 70 line and edged lower, while the MACD, although positive, has topped and fallen below its signal line. As for the bigger picture, with no clear trending structure on the daily chart, I would hold my neutral stance as far as the overall outlook is concerned. I believe that a close above 1170 is needed to signal a newborn medium-term uptrend.
• Support: 1141 (S1), 1130 (S2), 1121 (S3)
• Resistance: 1155 (R1), 1170 (R2), 1185 (R3)
DAX futures trade higher and hit resistance at 10100
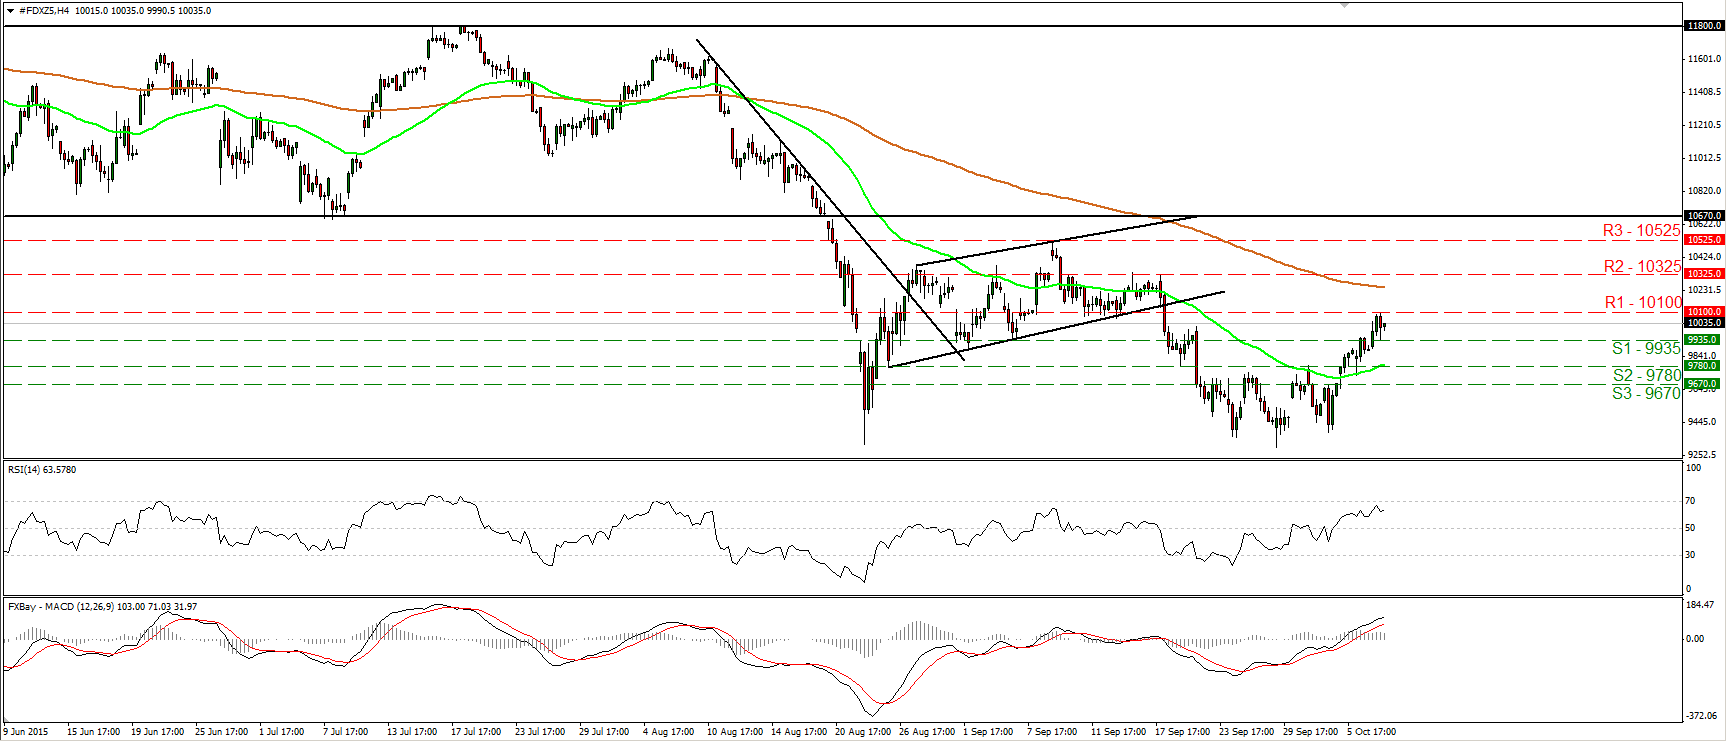
• DAX futures traded higher, breaking above the resistance (turned into support) barrier of 9780 (S2) and completing a short-term triple bottom formation. Yesterday, the index hit resistance at 10100 (R1), where a clear upside break is likely to open the way for the next obstacle at 10325 (R2). Our momentum studies reveal upside speed and magnify the case for further advances. The RSI edged higher, hit resistance near its 70 line, but turned up again and could break above 70 in the near future. The MACD stands above both its zero and trigger lines and points north. On the daily chart, the break below 10670 on the 20th of August has shifted the medium-term outlook to the downside, in my view. However, given that the index has printed two lows at around 9315, I would change my stance to neutral for now, as far as the overall picture is concerned.
• Support: 9935 (S1), 9780 (S2), 9670 (S3)
• Resistance: 10100 (R1) 10325 (R2), 10525 (R3)

