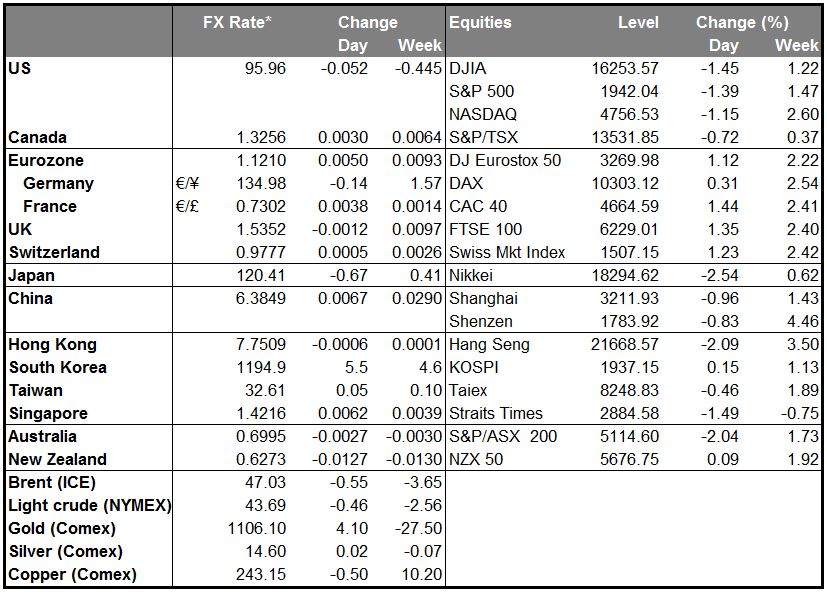
• Turns and roundabouts Yesterday saw amazing mean reversion. On Tuesday, it was risk on all the way: stocks soared, with the Nikkei showing the largest gain in several years; copper and oil rose sharply; and most EM currencies gained. Yesterday, it all reversed during US time, as there was a massive bout of derisking for reasons that remain obscure. Reuters said it was because “hopes of further stimulus measures in China faded,” but I wonder. I think the rally on Tuesday and during the European day Wednesday is what was questionable. The rally was probably caused by “hopes” of further China stimulus, plus the rally in Japan caused by talk of a cut in corporate tax rates, not to mention the market-specific factors that caused copper prices to rebound, which I mentioned yesterday. But perhaps these factors only caused momentary covering of short positions, after which people realized that the fundamental picture hadn’t or wouldn’t change. There was no big change in Fed fund rates expectations. Personally, I doubt that we are going to see any moves in China large enough to turn things there around – at best they may try to slow the slowdown, not reverse it. Large-scale investment funded by a huge increase in debt is just no longer possible there. The slide in stocks (and risk in general) accelerated as the Apple (NASDAQ:AAPL) event went on, although correlation is not the same as causation.
• In any event, the US stock market closed down 1.4%, commodity prices down (oil in particular off over 5%) and EM currencies largely fell. EUR rose, as is usual nowadays on risk-off days, but it was notable how little it rose relative to the big moves in stocks and commodities. That may be because the dollar gained sharply vs the commodity currencies.
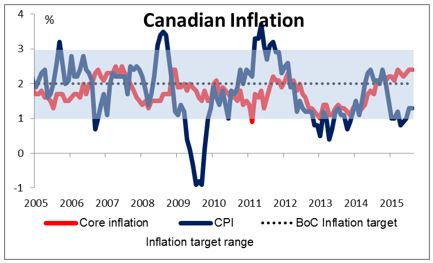
• Bank of Canada stays on hold The Bank of Canada (BoC) remained on hold at its meeting Wednesday, as we expected. The statement focused on headline inflation, which at 1.3% yoy is close to the bottom of its 1%-3% target range. Core inflation, however, has been at or slightly above the 2% midpoint of its target range for the past 12 months. They expressed concern about the Chinese economy and the effects of increased market volatility and lower commodity prices. On the other hand, they also noted that “the stimulative effects of previous monetary policy actions are working their way through the Canadian economy” and that exchange-rate sensitive sectors are regaining momentum, while they refrained from mentioning “elevated” vulnerabilities associated with household imbalances. On the whole, they seem to be satisfied with the impact of their recent reduction in rates and happy to remain on hold for some time. As for the currency, they mentioned approvingly that the fall in CAD is “helping to absorb some of the impact of lower commodity prices” and “facilitating the adjustments taking place in Canada’s economy.” That shows they are happy with the fall in the currency and so are not at all going to fight any further weakness. With monetary policy on hold for a while, I would expect oil prices to determine the direction of CAD for now, and therefore expect it to drift lower for the time being.
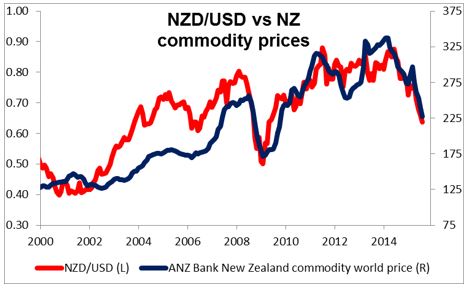
• RBNZ cuts rates, as expected The Reserve Bank of New Zealand (RBNZ) cut its official cash rate (OCR) by 25 bps at its meeting Thursday, also as expected. Importantly, it also retained its easing bias. It explained that the outlook had been revised down due to weaker activity in the developing economies, plus headline inflation remains below target. A reduction in the OCR is warranted by the softening in the economy and the need to keep future average CPI inflation near the 2 percent target midpoint, it explained. At this stage, some further easing in the OCR seems likely… As for the currency, it said that further depreciation is appropriate, given the sharpness of the decline in New Zealand’s export commodity prices. All told this seems to be a negative picture for the NZD: more rate cuts to come and a central bank that would welcome further depreciation in its currency. I expect to see NZD weaken further, particularly as the Chinese economy slows further (see next item).
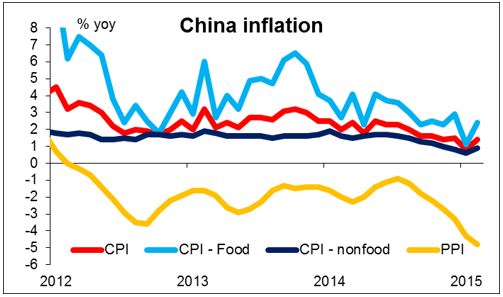
• China CPI inflation accelerates, but so does PPI deflation China’s CPI rate accelerated to 2.0% yoy from 1.6% yoy, beating estimates of 1.8% yoy, while PPI deflation also accelerated to -5.9% from -5.4%, also beating estimates of -5.6%. The acceleration in CPI is not significant for monetary policy, as it’s caused by higher food prices, and raising interest rates will not cause more pigs to be born. The weak PPI is what’s important for global markets, as it indicates that Chinese companies remain under pressure. This implies that growth will continue to slow and imports to decline = negative for AUD, NZD and the EM currencies.
• Australia unemployment falls to 6.2% from 6.3%, in line with expectations.
• Today’s highlights: During the European day, the main event will be the Bank of England monetary policy meeting. No change in policy is expected ,while consensus for vote split is 8-1 with Ian McCafferty to maintain his call for a rate rise. The minutes of the meeting are released at the same time as the meeting, which makes meeting days more exciting than before. The number of the dissenting votes is the key point again, with market participants eagerly expecting to see if the formerly hawkish Martin Weale will join McCafferty in voting to raise rates. Even though BoE Governor Carney recently stated that China’s turmoil will not affect the Bank’s plans, we believe it’ll be hard for any other members to join McCafferty at this meeting. Any signs that the MPC members are reacting to international events could leave GBP vulnerable. Furthermore, it will be interesting to see what will be the newly appointed member’s Gertjan Vlieghe stance and view regarding interest rates and inflation.
• Sweden’s CPI and CPIF for August are due to be released. Even though the country is expected to remain in deflation, the Sweden’s Riksbank maintained its benchmark interest rate unchanged and the monthly pace of bond purchases intact at its meeting last week. Unless we see a huge fall into deflation, the Bank is unlikely to alter its stance. However, given that the Bank remains willing to act, I would treat any short-term strength as a correction of SEK longer-term downtrend.
• Norway’s CPI for August is also coming out. Last time, NOK plunged after the country’s headline CPI decelerated from the previous month, falling back below the Norges Bank’s 2.5% target. It immediately recovered however and gained a bit, as the underlying rate came in line with market consensus of 2.6%. Therefore, the focus is most likely to be on the underlying rate again, which is expected to accelerate. This could prove NOK-supportive and ease expectations for further action by the Norges Bank at its end of September meeting.
• In the US, we get initial jobless claims and wholesale inventories for July.
• We have several ECB speakers on Thursday’s agenda. ECB Executive Board members Yves Mersch, Benoit Coeure and Peter Praet speak at the Eurofi Financial Forum in Luxembourg.
The Market
EUR/USD broke above 1.1200
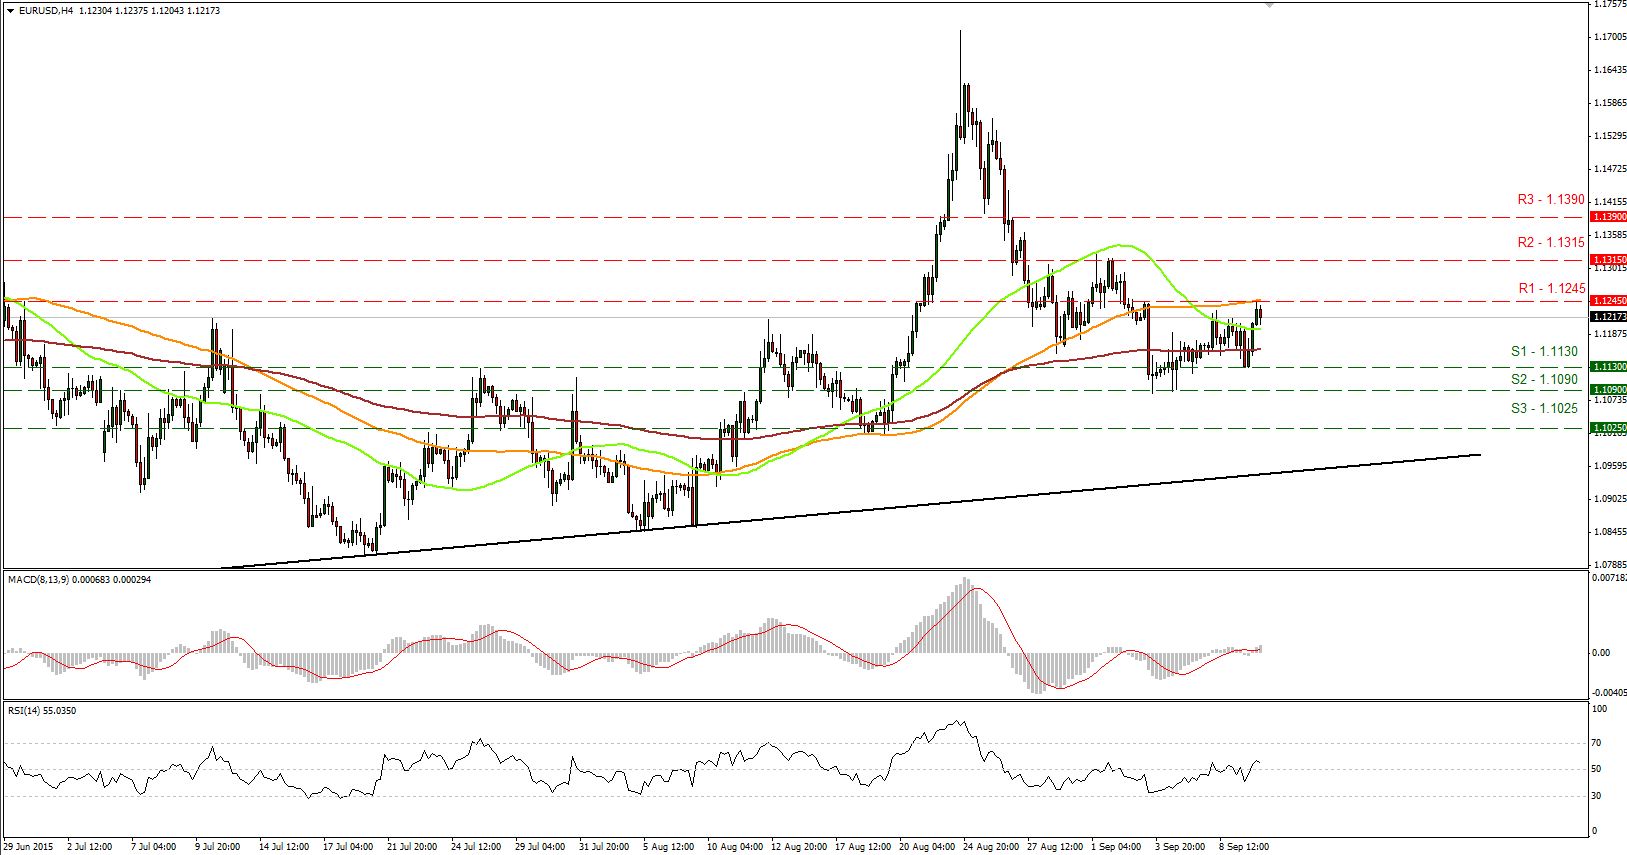
• EUR/USD moved higher on Wednesday to find resistance at 1.1245 (R1). The pair made two attempts to break above that territory, which coincides with the 100-period moving average, but none of them found much support and the pair remained slightly below that level. A break above that zone is likely to trigger further extensions, perhaps towards our next resistance of 1.1315 (R2). I would like to see a clear break above that hurdle to shift my view to the upside. Looking at our short-term oscillators, they both lie near their equilibrium levels. The MACD has topped slightly above its zero line and is pointing sideways, while the RSI stands just above its 50 line, pointing down. These momentum signs support the case to wait for a break above 1.1245 (R1) to trust the next leg higher.
• In the bigger picture, given that on the 26th of August EUR/USD fell back below 1.1500, I would maintain my neutral stance. The move below that psychological hurdle confirmed that the surge on the 24th of the month was a false break out. Therefore, I would like to see another move above 1.1500 before assuming that the overall outlook is back positive. On the downside, a break below the 1.0800 hurdle is the move that could shift the picture to negative. • Support: 1.1130 (S1), 1.1090 (S2), 1.1025 (S3) • Resistance: 1.1245 (R1), 1.1315 (R2), 1.1390 (R3)
GBP/USD stays above the key level of 1.5330
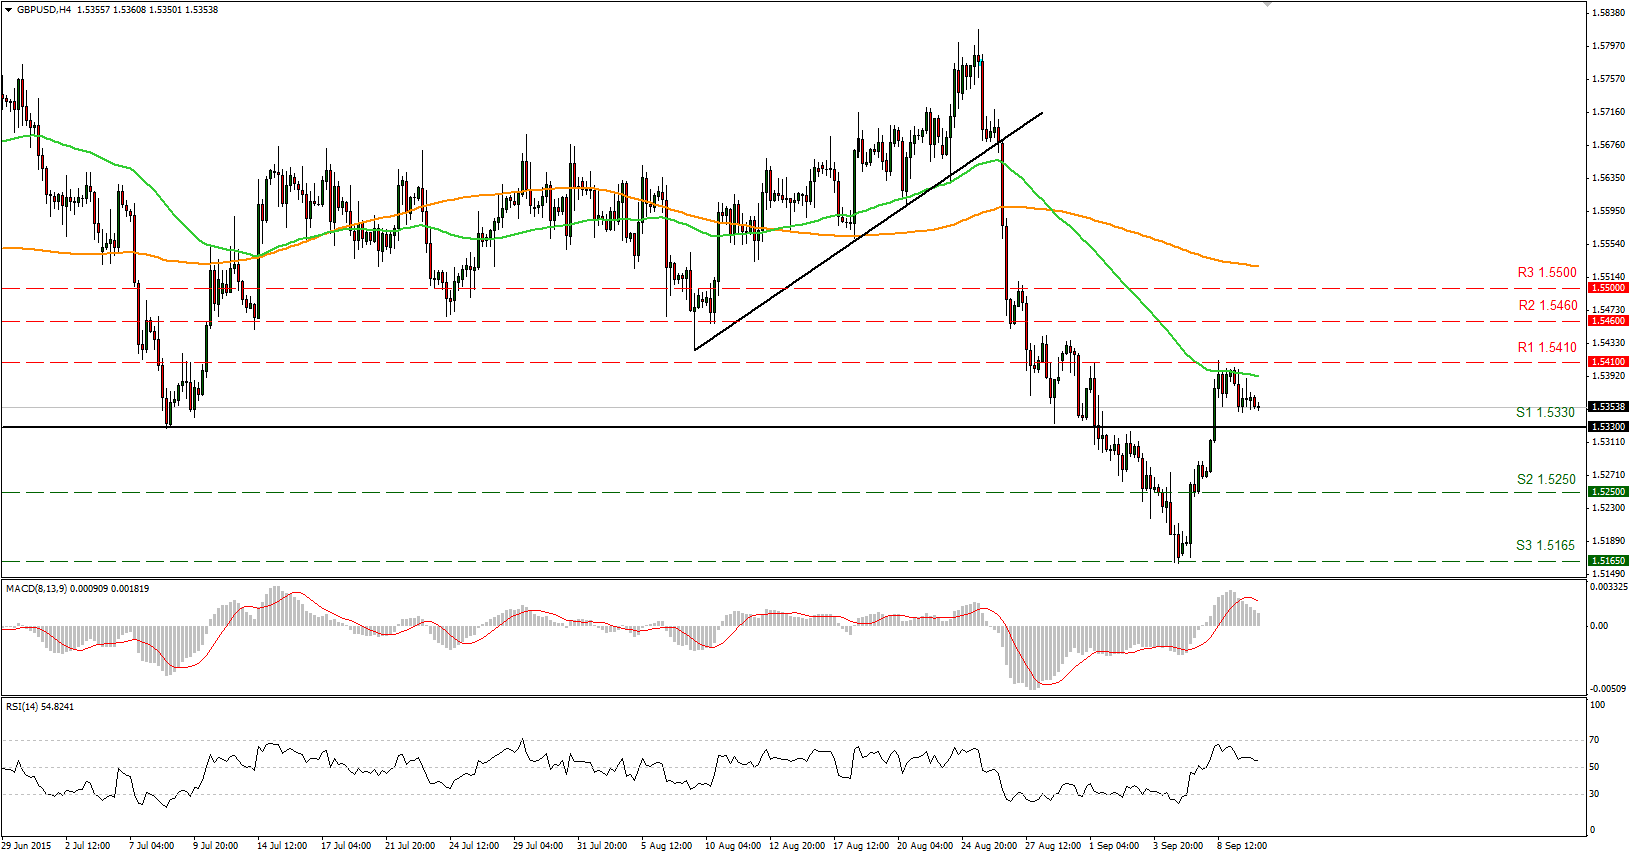
• GBP/USD traded somewhat lower on Wednesday following the disappointing industrial production for July, but stayed above the support barrier of 1.5330 (S1). Ahead of the Bank of England policy meeting today, I would prefer to take a neutral stance and wait for a break of the 1.5330 (S1) support line or the 1.5410 (R1) resistance zone to determine the near-term bias. Given that no change in policy is expected and the consensus is that the vote will once again split 8-1, I believe that cable could strengthen on the relief that MPC members are not reacting to China’s recent turmoil. A strong and clear break above the 1.5410 (R1) level is needed to trigger further extensions, perhaps towards our next resistance of 1.5460 (R2). As for the bigger picture, the collapse on the 26th of August brought the rate back below the 80-day exponential moving average, which is a bearish move in my view. However, the move above the key 1.5330 (S1) barrier has shifted the broader trend to neutral for now, as further advances could be on the cards.
• Support: 1.5330 (S1), 1.5250 (S2), 1.5165 (S3)
• Resistance: 1.5410 (R1), 1.5460 (R2), 1.5500 (R3)
USD/JPY above 120.00
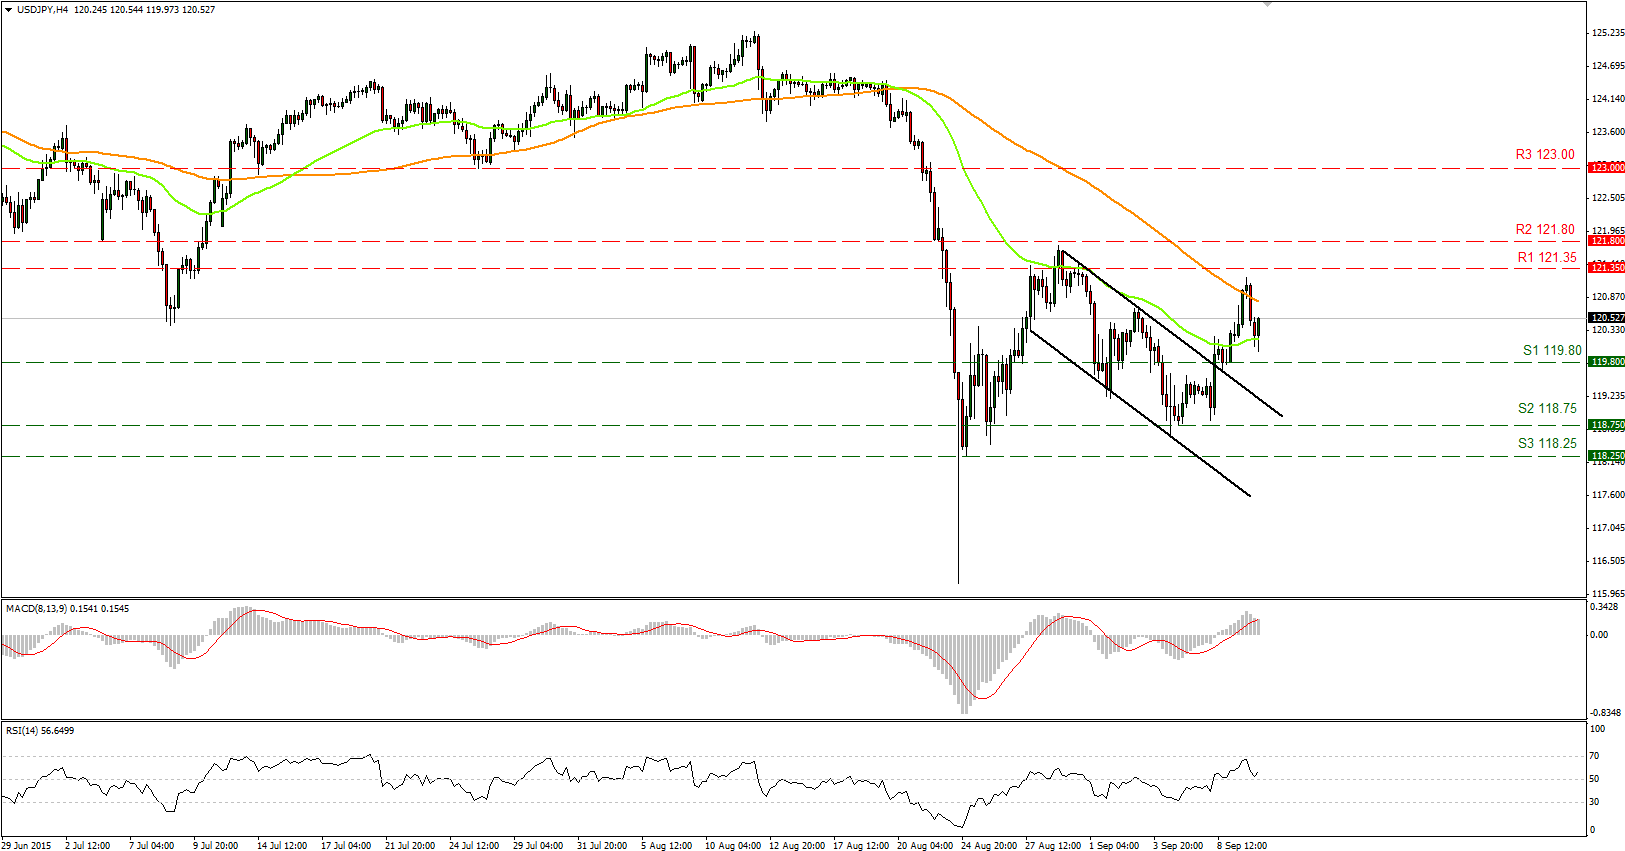
• USD/JPY found some sell orders slightly below our 121.35 (R1) resistance area and moved lower, but the move was halted marginally above our 119.80 (S1) support zone. Given that the pair remained above the upper boundary of the downslope channel that has been containing the price action since the 28th of August, I would consider the short-term trend to be slightly positive. Looking at our momentum studies, they detect positive upside momentum, and support the notion that the next move is most likely to be higher. The RSI found support at its 50 line and bounced up, while the MACD stands above both its zero and trigger lines.
• As for the broader trend, the plunge on the 24th of August signaled the completion of a possible double-top formation. Even though this keeps the overall picture somewhat to the downside, a break above the 121.80 (R2) resistance level is likely to shift the bias to neutral.
• Support: 119.80 (S1), 118.75 (S2), 118.25 (S3)
• Resistance: 121.35 (R1), 121.80 (R2), 123.00 (R3)
WTI broke two support lines in a row
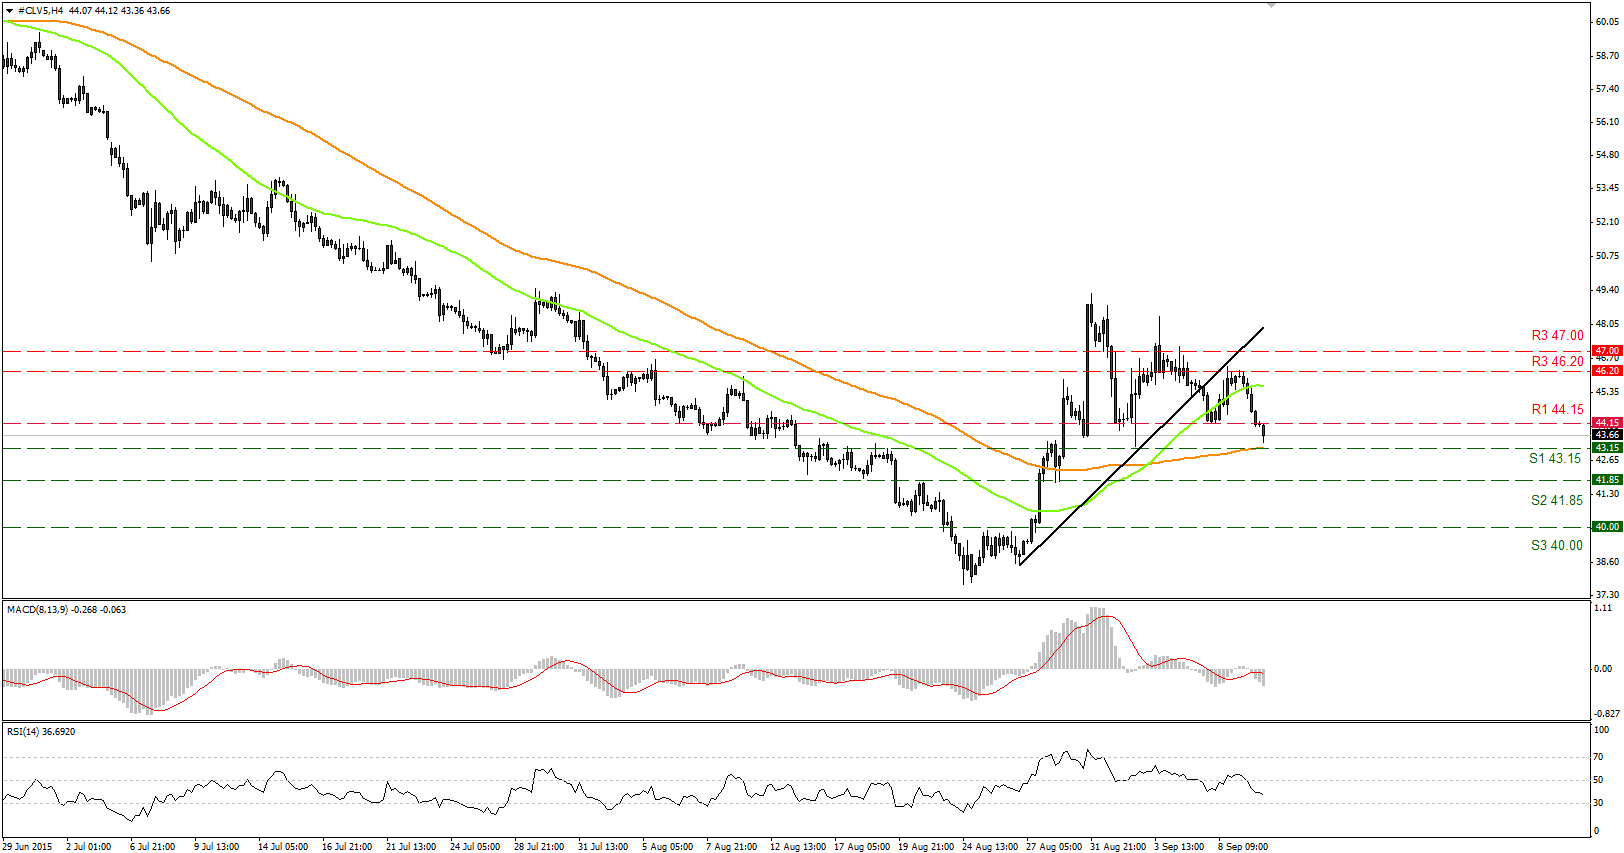
• WTI plunged on Wednesday, breaking two support lines in a row, only to find some buy orders near the 43.15 (S1) obstacle. A break below that area, which happens to lie near the 61.8% Fibonacci retracement level of the end of August advance, is likely to hold larger bearish implications and push the price towards our next support at 41.85 (S2). Our short-term momentum indicators support the case for further declines. The RSI fell below its 50 line and is pointing down, while the MACD, already below its trigger line, moved deeper into its negative territory.
• On the daily chart, I still see a longer-term downtrend. As a result, any short-term advances are likely to be corrective moves of that major downside path.
• Support: 43.15 (S1), 41.85 (S2), 40.00 (S3)
• Resistance: 44.15 (R1) 46.20 (R2), 47.00 (R3)
Gold slightly above 1100
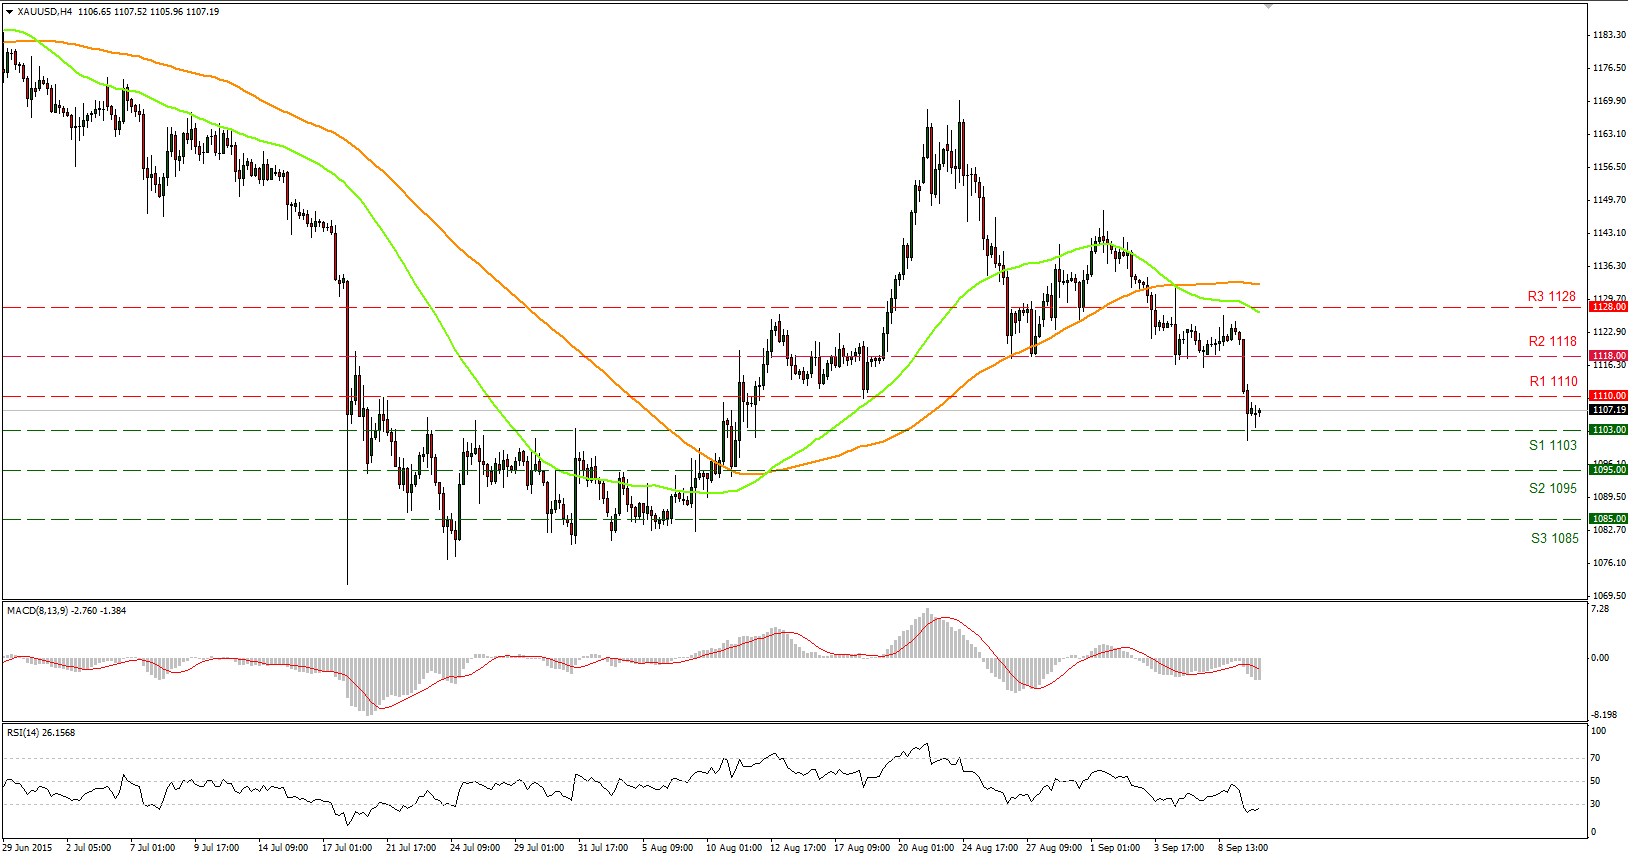
• Gold plunged on Wednesday, breaking below the tight range that had been containing the price action since the 3rd of September. The move was halted near the 1103 (S1) support area, and if the bears prove strong enough, they could challenge our next support of 1095 (S2). Our short-term momentum studies, however, favor a minor upside correction before the next wave lower. The MACD, although below its zero and trigger lines, show signs of bottoming and could move a bit higher, while the RSI, slightly below its 30 line seems willing to cross above it again. Therefore, we could see a test of the support-turned-into resistance zone of 1110 (R1) before the next leg down.
• As for the broader trend, with no clear trending structure on the daily chart, I would hold my neutral stance as far as the overall outlook is concerned.
• Support: 1103 (S1), 1095 (S2), 1085 (S3)
• Resistance: 1110 (R1), 1118 (R2), 1128 (R3)

