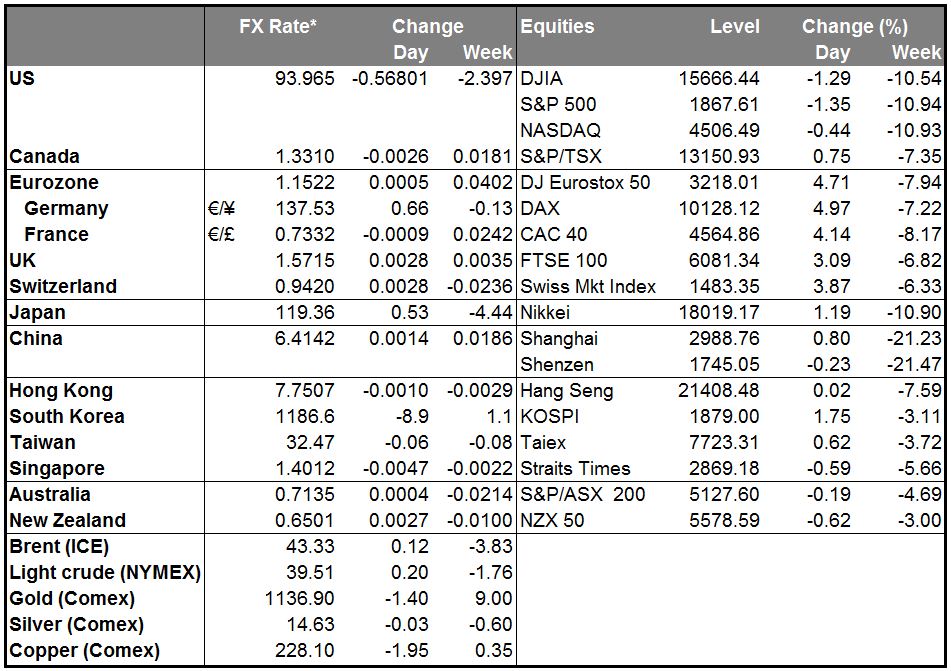
• China’s new rate cut fails to calm the markets US stocks were initially encouraged by the new moves from the PBoC to free up liquidity into the markets, but then sharply reversed the early gains to end lower on Tuesday. The focus then shifted to Asia and how Chinese stock markets would react on the fresh stimulus. China’s main equity indices appeared to recover and after several attempts to move higher, the Shanghai Composite index was up around 2.5% in late Asian session. Even though it’s a small move compared to the tumble of the last few days, at least the stock market seems to have halted a bit. Nevertheless, we remain unconvinced that China’s broadly-anticipated move to cut interest rates and the reserve requirement ratio (RRR) would be enough to stabilize the tumble in its stock markets. Much more support will be needed from the Chinese government and the PBoC to stabilize the slowdown, in our view. The government will probably need to announce fiscal stimulus on top of the monetary policy easing to fuel again its economy.
• Today’s highlights: During the European day, from Sweden, we get the economic tendency survey for August. The forecast is for the indicator to increase a bit, which could strengthen SEK somewhat.
• From Norway, we get the AKU unemployment rate for July. The official unemployment rate for the same month rose to 3.1% from 2.8%. This increases the possibilities for the AKU rate to rise as well. NOK could weaken a bit at these release.
• The highlight of the day will be the US durable goods orders for July. The headline figure is expected to fall, a turnaround from the month before, while durable goods excluding transportation equipment are estimated to decelerate somewhat. The focus is usually on the core figure, where a positive surprise could suggest the possible start of a turnaround in business investment and could be bullish for the dollar. On the other hand, another disappointment is likely to keep USD under pressure, as this will push even lower September rate hike expectations.
• We have two important speakers on Wednesday’s agenda. ECB Executive Board member Peter Praet and New York Fed President William Dudley speak. Investors are likely to pay more attention than usual to Bank officials for hints if the Fed is still on track to raise rates, following the developments in China, and if the ECB may extend its QE program. ECB Vice President Vitor Constancio said on Tuesday that the ECB will take further measures if it sees a significant risk to the inflation outlook. He also said that it’s too early to understand the effect of what is happening in China, and that the renewed fall in oil price is more relevant for the course of the headline inflation, but there is nothing monetary policy can do about that. The ECB may have to revise down its CPI forecasts at its monetary policy meeting next week.
The Market
EUR/USD pulls back and rebounds from 1.1400
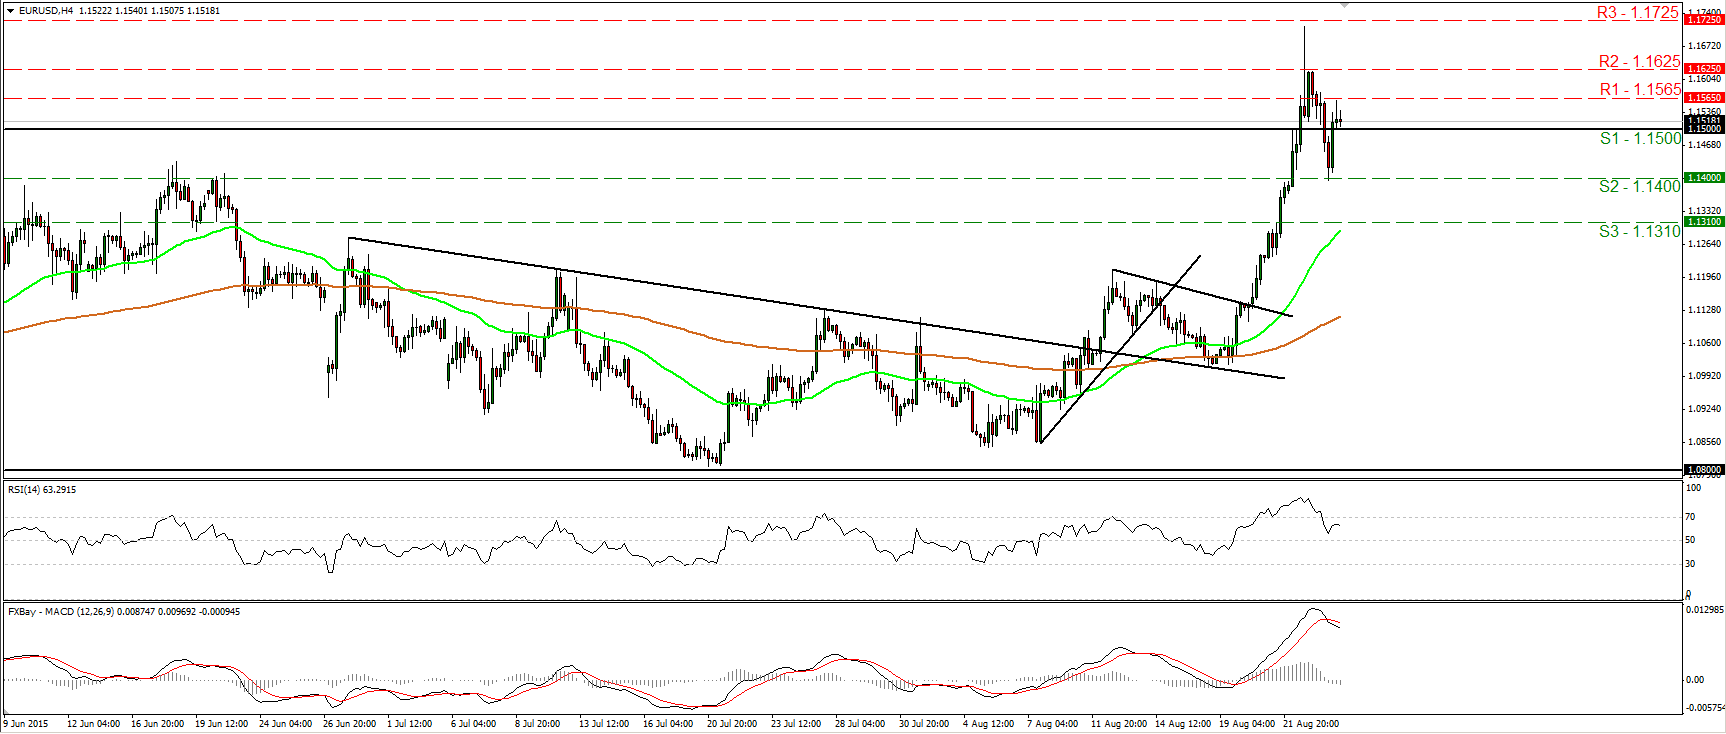
• EUR/USD retreated on Tuesday, falling below the psychological zone of 1.1500 (S1). However, the rate hit support at 1.1400 (S2) and rebounded back above 1.1500 (S1), and found resistance at 1.1565 (R1). The price structure on the 4-hour chart still suggests a short-term uptrend, but having in mind that there is the possibility for a lower high at around 1.1565 (R1), I would switch my stance to neutral for now. Another move below 1.1500 (S1) is likely to confirm the lower high and perhaps aim for another test at 1.1400 (S2). On the other hand, a clear break above 1.1565 (R1) could pull the trigger for the 1.1625 (R2) line. As for the broader trend, EUR/USD had been trading between 1.0800 and 1.1500 (S1) from the 23rd of April until Monday. On Monday, the rate managed to close above 1.1500 (S1), something that probably signals the exit of the aforementioned sideways range, and turns the overall outlook positive. As a result, I would treat any future possible near-term declines as a corrective move.
• Support: 1.1500 (S1), 1.1400 (S2), 1.1310 (S3)
• Resistance: 1.1565 (R1), 1.1625 (R2), 1.1720 (R3)
AUD/USD tumbles and hits 0.7100
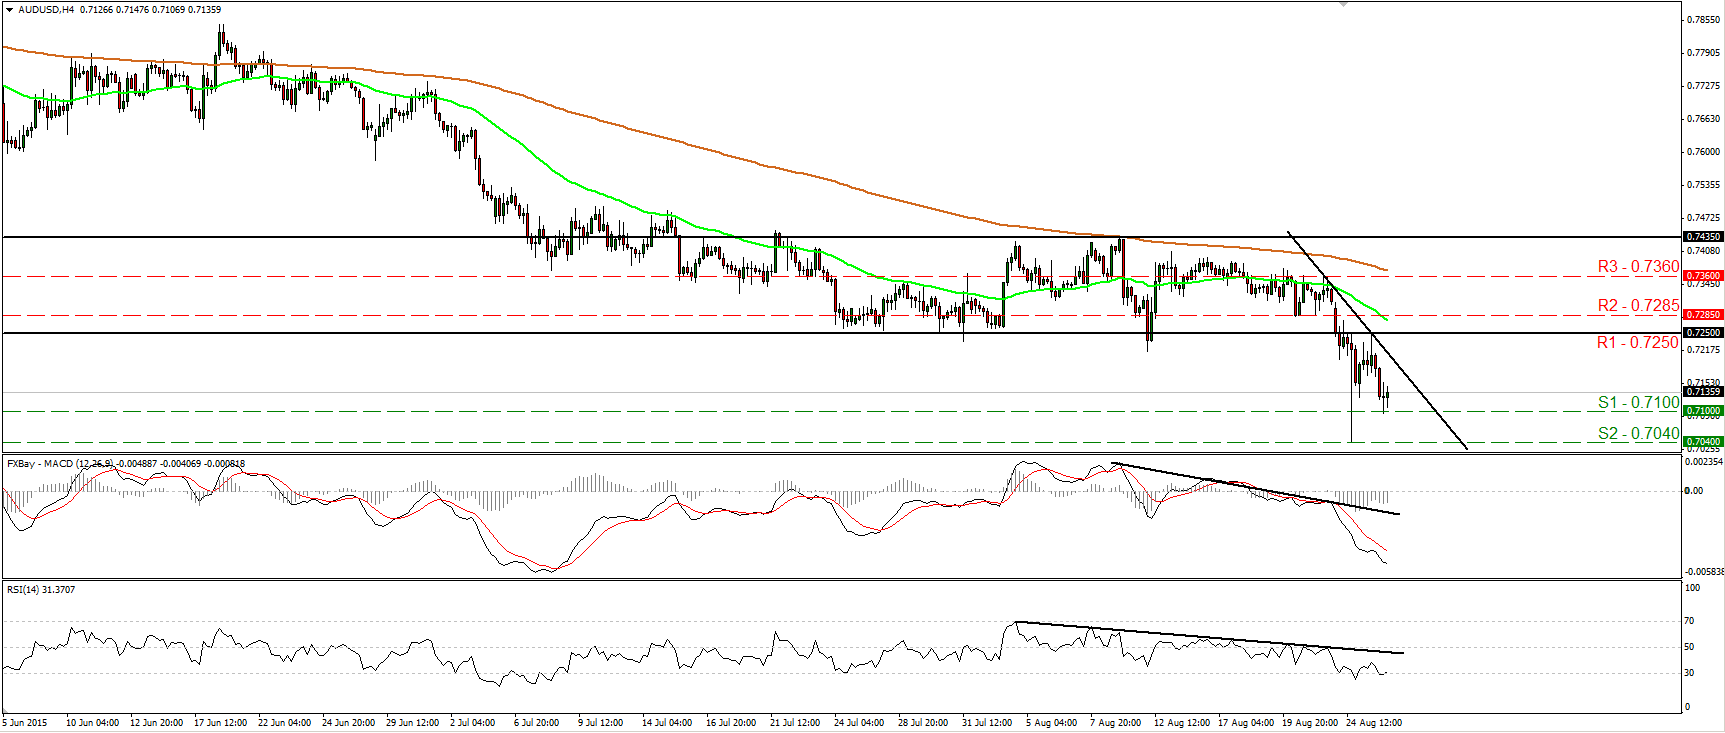
• AUD/USD hit resistance at 0.7250 (R1) and then tumbled to find support at 0.7100 (S1). I believe that the short-term bias remains negative, and I would expect a clear move below 0.7100 (S1) to pave the way for another test at the 0.7040 (S2) barrier, defined by the Monday’s low. The MACD stands well below both its zero and trigger lines, indicating strong downside momentum and supporting the case that the pair is likely to continue lower in the foreseeable future. The RSI though, has rebounded from near its 30 line and is pointing somewhat up, giving evidence that a minor bounce could be on the cards before the next negative leg. On the daily chart, the completion of a head and shoulders formation and the move below the psychological zone of 0.7500 signaled the continuation of the prevailing long-term downtrend, in my opinion. The break below 0.7250 (R1) confirmed a forthcoming lower low on the daily chart, and this supports the case that AUD/USD could eventually trade lower and perhaps aim for the psychological zone of 0.7000 (S3).
• Support: 0.7100 (S1), 0.7040 (S2), 0.7000 (S3)
• Resistance: 0.7250 (R1), 0.7285 (R2), 0.7360 (R3)
GBP/JPY rebounds from slightly below 186.25
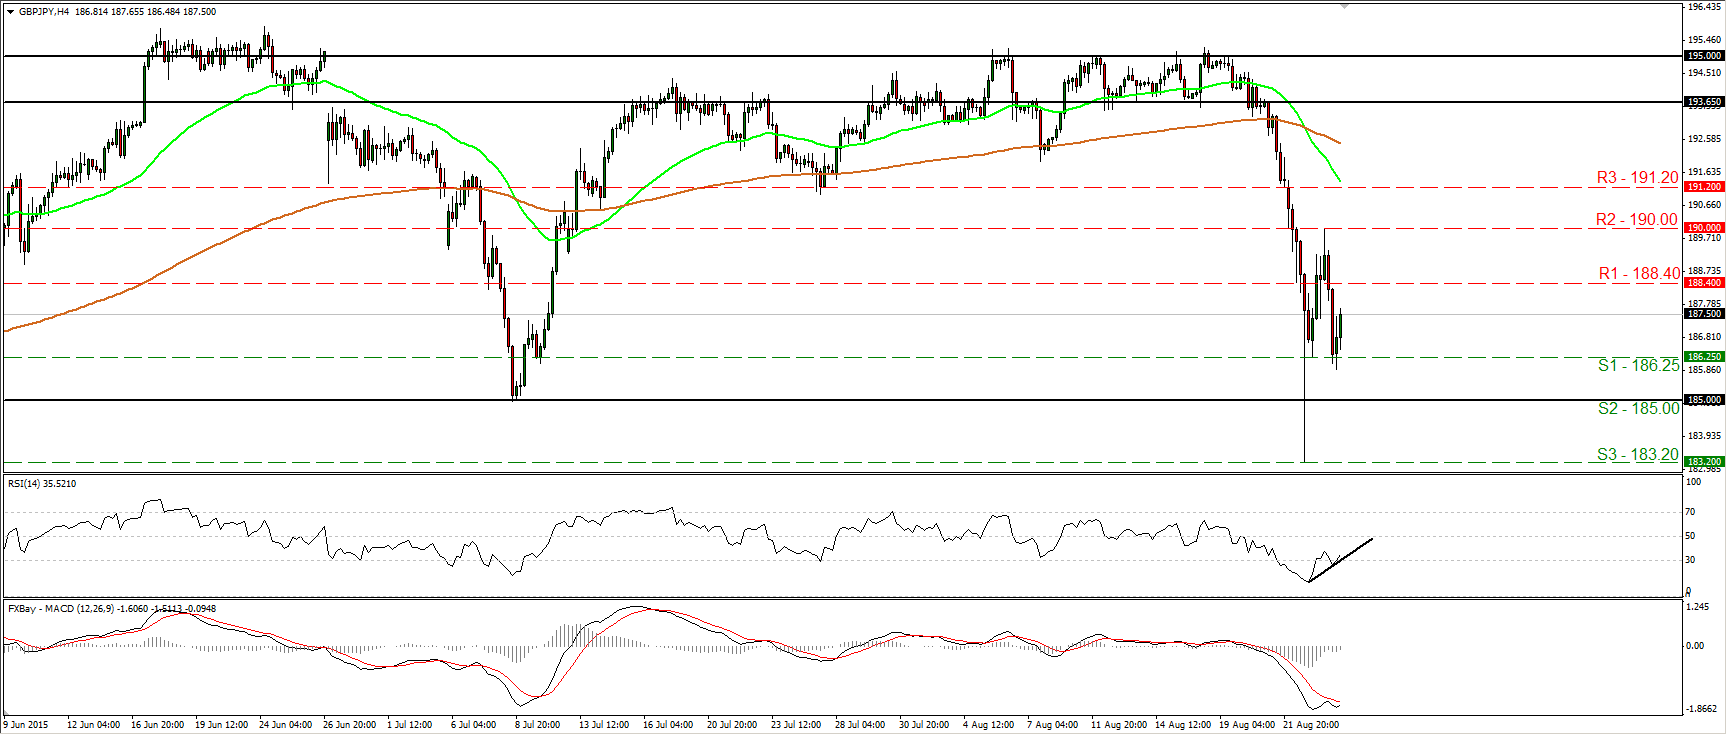
• GBP/JPY tumbled on Tuesday after finding resistance at the psychological figure of 190.00 (R2). However, the rate triggered some buy orders slightly below 186.25 (S1) and rebounded. The pair formed a lower high at 190.00 (R2) and this keeps the short-term downtrend intact for now. However, taking a look at our oscillators, I would expect the rebound to continue for a while, perhaps for a test at the resistance of 188.40 (R1). The RSI exited its below-30 territory and is pointing up, while the MACD has bottomed and could cross above its trigger line soon. What is more, there is positive divergence between the RSI and the price action. In the bigger picture, I see that on Monday, GBP/JPY found support at 183.20 (S3), which stands slightly above the 61.8% retracement level of the 14th of April – 18th of June advance. I prefer to see a clear close below that barrier before getting more confident on further medium-term declines.
• Support: 186.25 (S1), 185.00 (S2), 183.20 (S3)
• Resistance: 188.40 (R1), 190.00 (R2), 191.20 (R3)
Gold tumbles and finds support at 1135
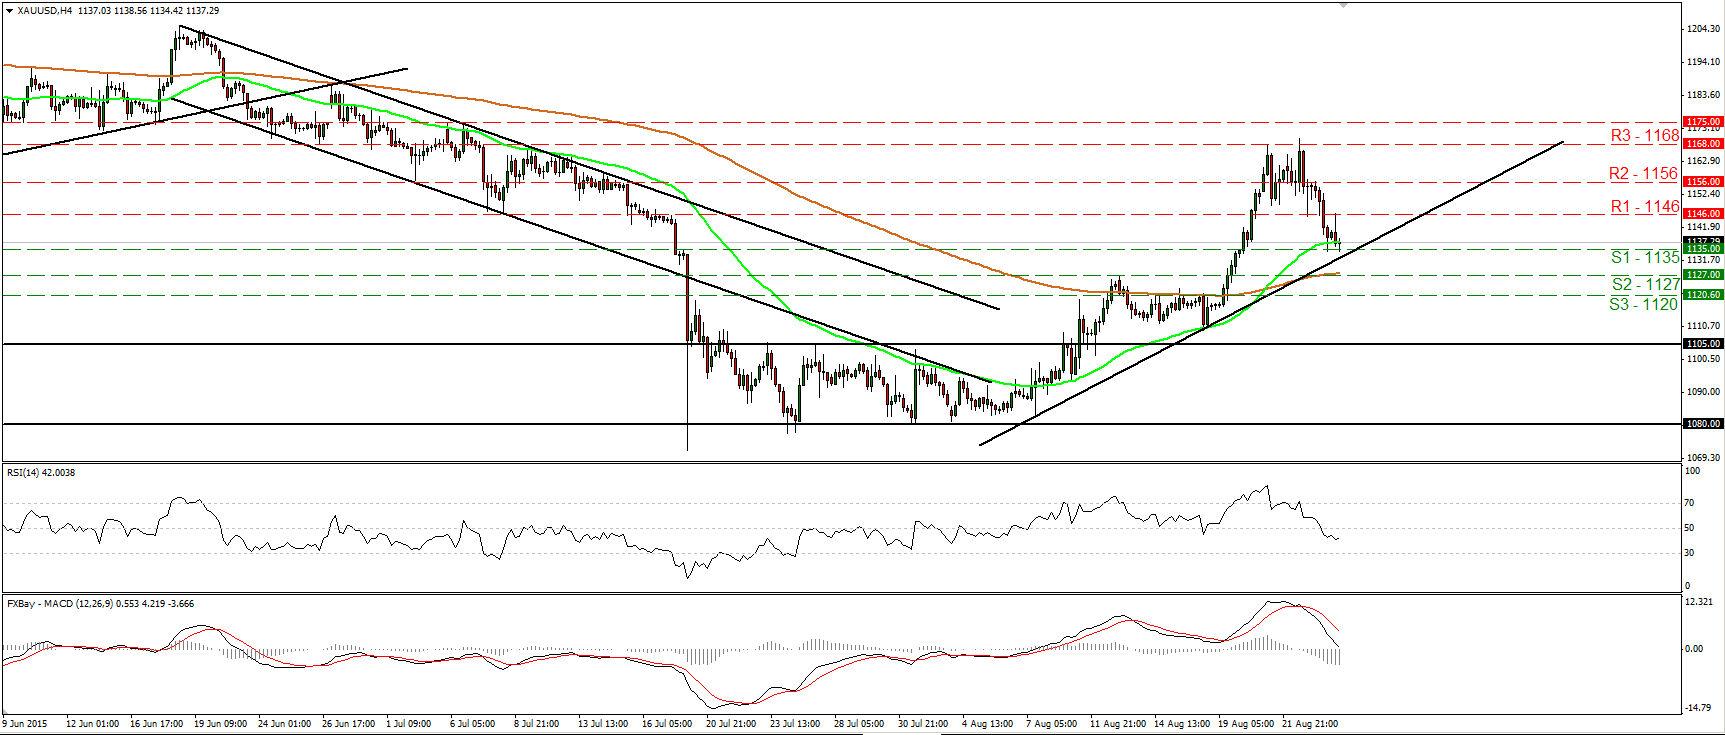
• Gold slid on Tuesday, but the decline was halted by the 1135 (S1) support barrier, slightly above the uptrend line taken from the low of the 7th of August. The possibility for a rebound near the trend line is high, but I would like to see a move above 1146 (R1) to confirm it. Such a move could initially target the 1156 (R2) obstacle. On the downside, a break below the aforementioned trend line and the 1135 (S1) support could carry larger bearish extensions. As for the bigger picture, having in mind that last Thursday’s rally brought the metal above the downside resistance line taken from the peak of the 18th of May, I would hold my neutral stance as far as the overall picture is concerned.
• Support: 1135 (S1), 1127 (S2), 1120 (S3)
• Resistance: 1146 (R1), 1156 (R2), 1168 (R3)
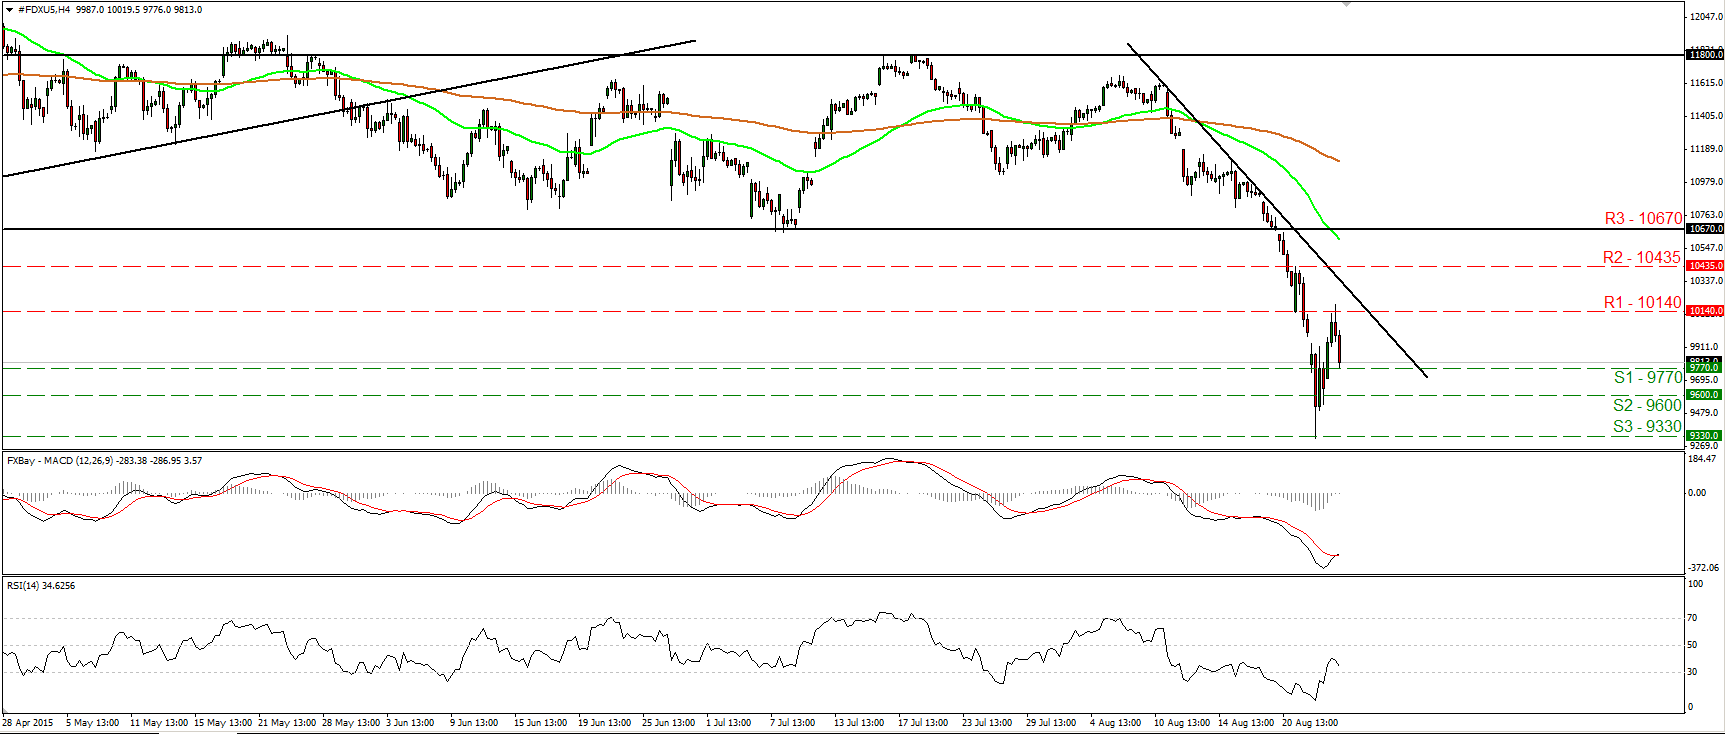
DAX futures slide after finding resistance slightly above 10140
• DAX futures traded higher yesterday, but found resistance slightly above 10140 (R1) and then tumbled to find support at 9770 (S1). As long as the price is trading below the downtrend line taken from the peak of the 10th of August, I would consider the short-term outlook to stay negative. A dip below 9770 (S1) could initially target the 9600 (S2) line, while a break below 9600 (S2) could carry larger bearish extensions, perhaps towards Monday’s low, at 9330 (S3). Our short-term oscillators support somewhat the notion. The RSI, although it exited its oversold territory, has turned down again, while the MACD, although above its trigger, shows signs that it could start topping and fall below the trigger line again. On the daily chart, I believe that the break below 10670 (R3) has shifted the medium-term outlook to the downside. Therefore, I would expect the index to continue to trade lower in the not-to-distant future.
• Support: 9770 (S1), 9600 (S2), 9330 (S3)
• Resistance: 10140 (R1) 10435 (R2), 10670 (R3)

