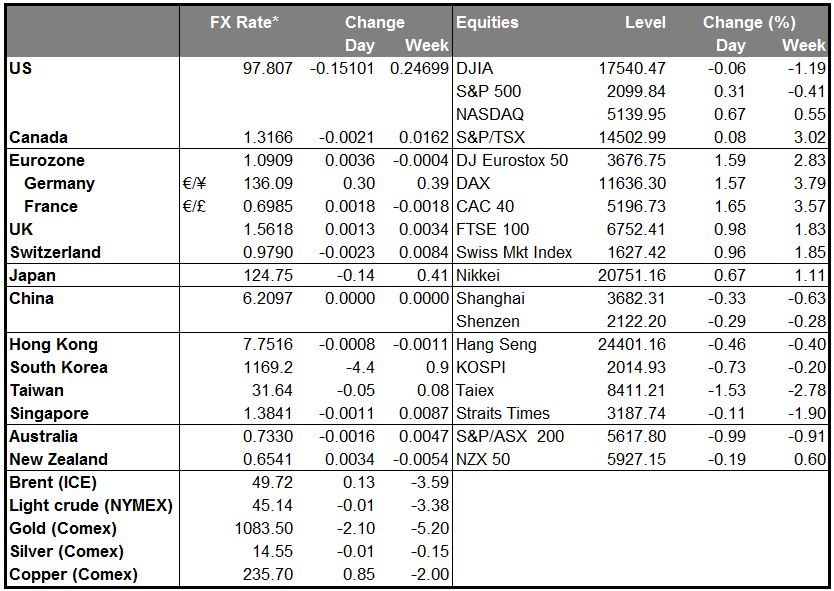
• Markets still watching the data: Despite Atlanta Fed President Lockhart’s comments about raising rates in September, the market is still watching the data closely. Maybe that was because Fed Gov. Jerome Powell started the US day off by saying that although the time for a rate hike was coming, he was still undecided about when the right time was and that he’d be “very, very focused on the data.” He said he would be especially attuned to employment data, which he said has been giving a better signal of growth than the GDP numbers. In that respect, Wednesday’s disappointing ADP report was definitely a negative event for the USD and the currency fell temporarily.
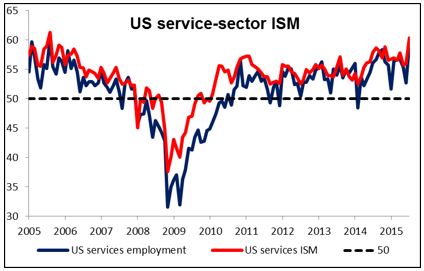
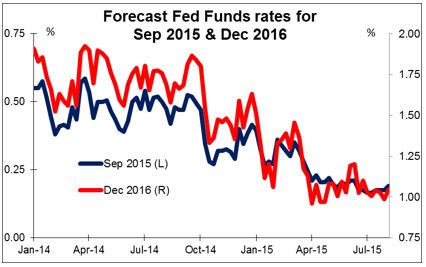
• But then the July non-manufacturing ISM index came in very strong, with the employment component particularly strong – both at post-crisis highs, indeed the highest levels in nearly 10 years. The implications of that number for Friday’s payroll figure partially cancelled out the weak ADP report and investors apparently still expect a number over 200k. That would be enough to satisfy those FOMC members who want to tighten in September, and Fed funds rate expectations continued to rise. Nonetheless, USD was opening modestly lower in Europe this morning against most of the G10 currencies, the exceptions being AUD, JPY and CHF.
• I expect that the market won’t be fully convinced about the Fed’s intentions until of course the Committee announces its decision on Sep. 17th. But until then, there is still plenty of room for the market to revise up its rate expectations, which are currently pricing in only about a 50-50 chance of a rate hike in September. That means USD can still strengthen further, in my view.
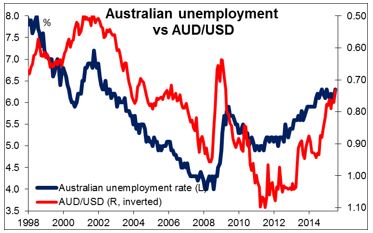
• AUD falls on higher unemployment AUD fell this morning after unemployment in July rose to 6.3% from 6.1%. However, in my view, the news was actually good: the number of employed people rose far more than expected and the rise in unemployment was largely due to a rise in the participation rate, not the number of unemployed persons. However, the market focused on the overall number, probably due to the “challenges” that the statistics agency has said it faces in compiling the report, which makes it less trustworthy. In any event, a weaker AUD would go a long with the weaker tone in commodities yet again today, so the trend seems likely to continue.
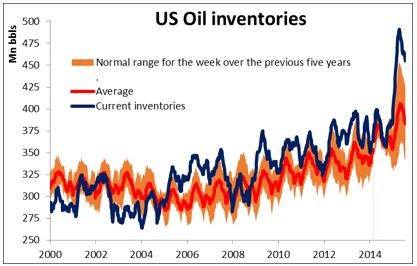
• Oil falls further despite bigger-than-expected drawdown Oil prices continued to fall in the US despite a much larger-than-expected decline in US inventories in the latest week. Nationwide refinery demand hit a record high. However, US domestic oil production continued to rise, and despite the big drawdown, inventories remain far above the usual level for this time of year, so prices fell anyway. I see this is a very bearish indication and so I remain negative on oil and the oil-related currencies. NOK was the strongest G10 currency over the last 24 hours; I’d suggest taking a look at whether it’s worth shorting it.
• Today’s highlights: focus on Bank of England The spotlight today will be squarely on the Bank of England. We have a very big day in the UK, as the Bank will release its rate decision and the minutes of the meeting, plus the quarterly Inflation Report, all at the same time. The first reaction will most likely be on the number of dissenting votes, if any, and later on the new economic forecasts. Market expectations and ours are that the two most hawkish MPC members, Weale and McCafferty, will once again vote to raise rates by 25 bps, as they did up to and including last December.
• The minutes of the last meeting showed that if it had not been for the crisis in Greece and China, a number of members would have found the decision not to raise rates more finely balanced than before. Therefore, in the absence of these uncertainties, the hawks could decide to split and vote for a small increase in interest rates. If another member joins the dissenters, this could be noticeably GBP-bullish.
• Following the tidal wave of the votes, we will shift our focus to the new economic forecasts for signs of further GBP support. Even though GBP has continued its choppy price action against EUR and USD, the pound has strengthened significantly against the commodity currencies AUD, NZD and CAD, and the Nordics SEK and NOK.
• As for the indicators, German factory orders for June were much stronger than expected, rising 2.0% mom instead of 0.3% as expected. EUR/USD spiked up on the news.
• UK industrial production for June will be released.
• In the US, initial jobless claims for the week ended Aug. 1 are due to be released.
The Market
EUR/USD hits support at 1.0850 and rebounds
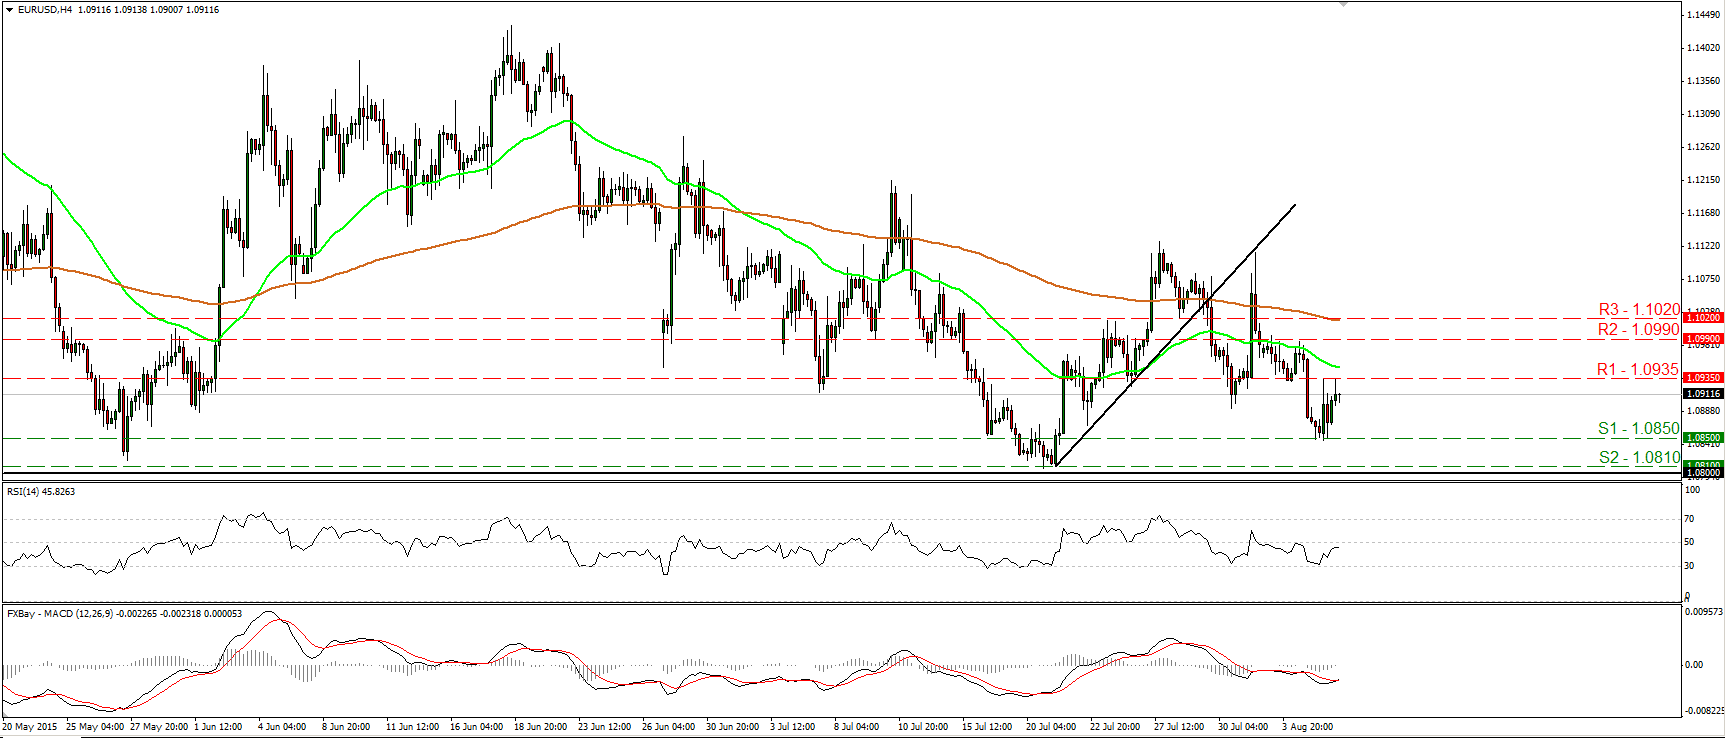
• EUR/USD failed to extend lower towards the 1.0810 (S2) barrier on Wednesday. It hit support at 1.0850 (S1) and following the disappointing US ADP report, it rebounded to find resistance at 1.0935 (R1). Now the rate is trading slightly below the 1.0935 (R1) line, and since the possibility for a lower high still exists, I would consider the short-term trend to remain negative. I would expect the bears to eventually take control and drive the battle down for another test at the 1.0850 (S1) barrier. Taking a look at our momentum studies though, I see signs that the rebound may continue for a while. The RSI edged higher after hitting its 30 line, while the MACD, although negative, has bottomed and crossed above its trigger line. As for the broader trend, as long as EUR/USD is trading between 1.0800 and 1.1500, I would consider the longer-term picture to stay flat. I believe that a move above the psychological zone of 1.1500 is the move that could carry larger bullish implications, while a break below 1.0800 (S3) is needed to confirm a forthcoming lower low on the daily chart and perhaps turn the overall bias back to the downside.
• Support: 1.0850 (S1), 1.0810 (S2), 1.0800 (S3)
• Resistance: 1.0935 (R1), 1.0990 (R2), 1.1020 (R3)
GBP/USD getting ready for the big day
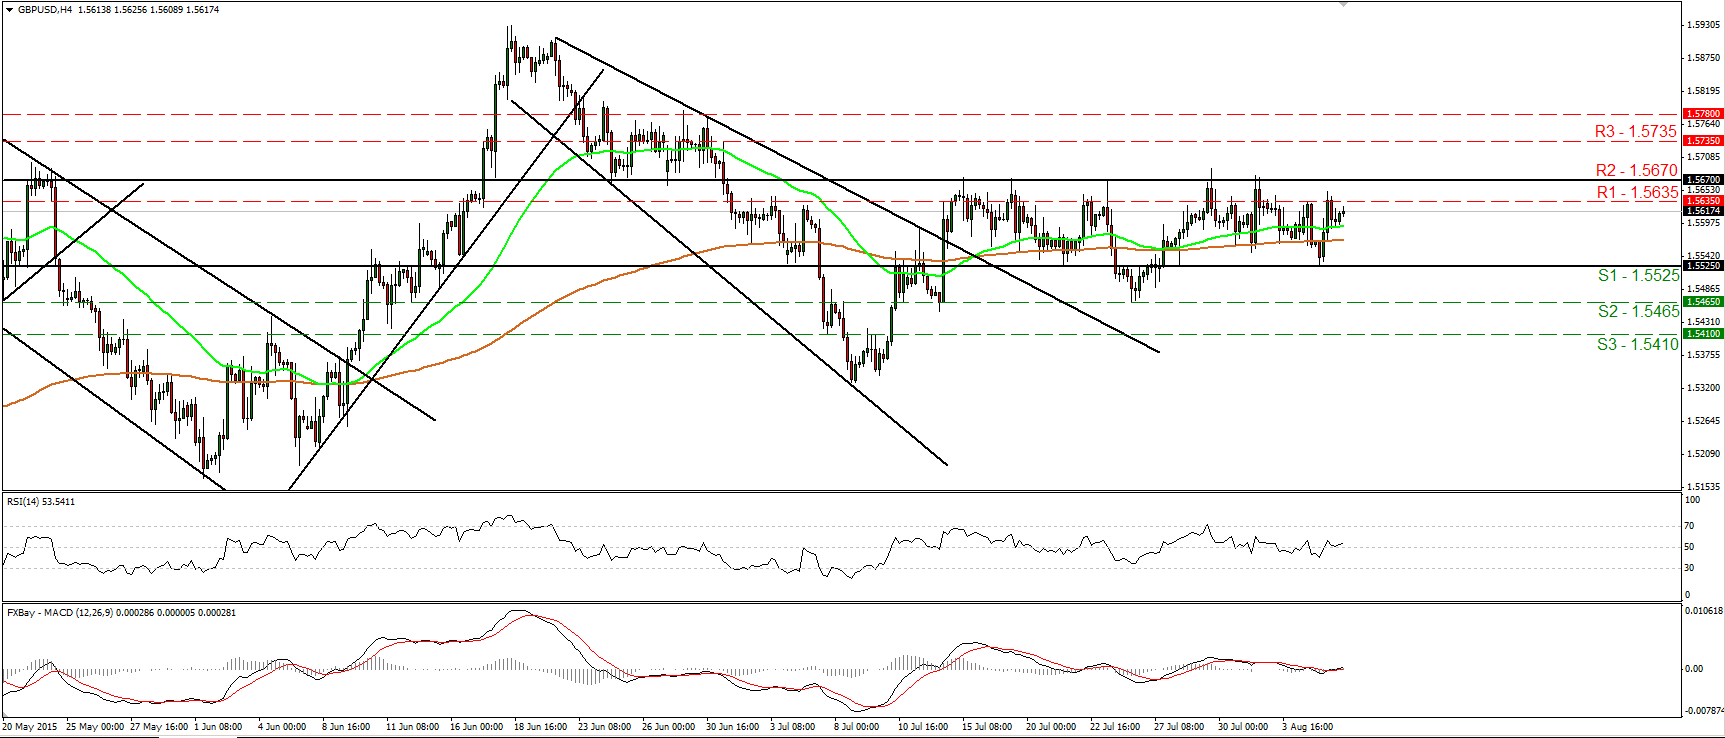
• GBP/USD traded higher after it hit support at the 1.5525 (S1) line. Since there is no clear trending structure on the 4-hour chart, I consider the near-term path to be sideways. I prefer to wait for a break above the well-tested resistance zone of 1.5670 (R2) before I get more confident on the upside. Today, the BoE releases its rate decision, the minutes of the meeting and the quarterly Inflation Report, all at the same time. Any dissenting votes along with upbeat growth and inflation forecasts could be the catalyst for a break above the aforementioned key resistance zone. Something like that would confirm a forthcoming higher high and could initially target the 1.5735 (R3) resistance line, defined by the peak of the 1st of July. As for the broader trend, the price structure on the daily chart still suggests an uptrend. What is more, cable is still trading above the 80-day exponential moving average. These technical signs make me believe that the overall picture remains somewhat positive and that there is still the likelihood for the rate to trade higher.
• Support: 1.5525 (S1), 1.5465 (S2), 1.5410 (S3)
• Resistance: 1.5635 (R1), 1.5670 (R2), 1.5735 (R3)
EUR/JPY rebounds and hits resistance at 136.40
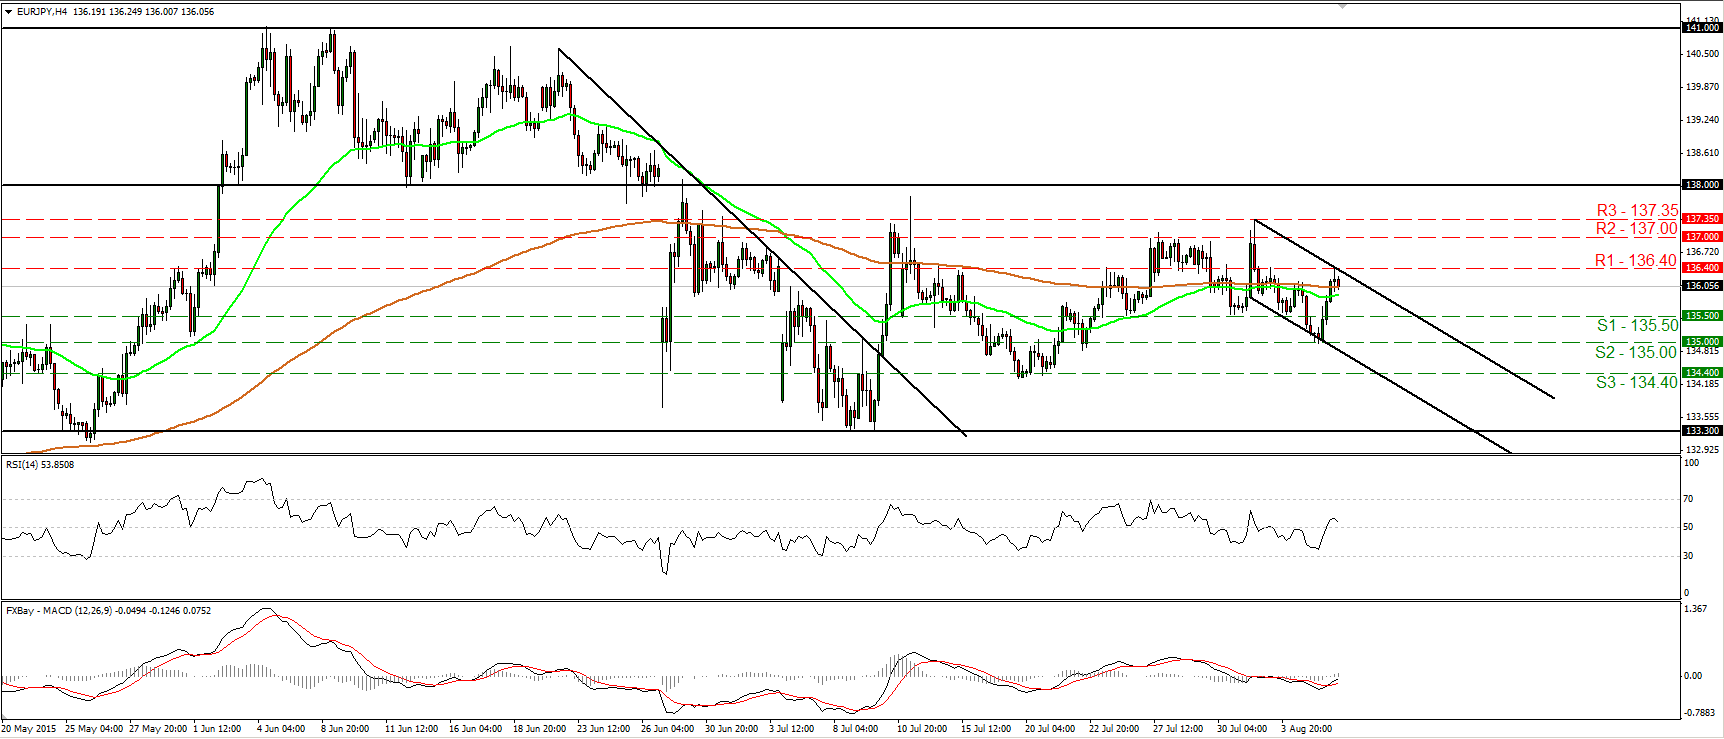
• EUR/JPY traded higher on Wednesday after hitting support at the psychological zone of 135.00 (S2). However, the advance was halted at 136.40 (R1). As long as the pair is trading within the short-term downside channel that has been containing the price action since the 31st of July, I would consider the near-term outlook to be bearish and I would expect the forthcoming wave to be to the downside, perhaps for an initial test at the 135.50 (S1) barrier. On the daily chart, the pair is still trading above the 133.30 support area, which stands marginally below the 50% retracement level of the 14th of April – 4th of June advance. As a result, I would like to see a daily close below that area before I assume that the medium-term picture has turned negative as well.
• Support: 135.50 (S1), 135.00 (S2), 134.40 (S3)
• Resistance: 136.40 (R1), 137.00 (R2), 137.35 (R3)
Gold trades in a quiet mode
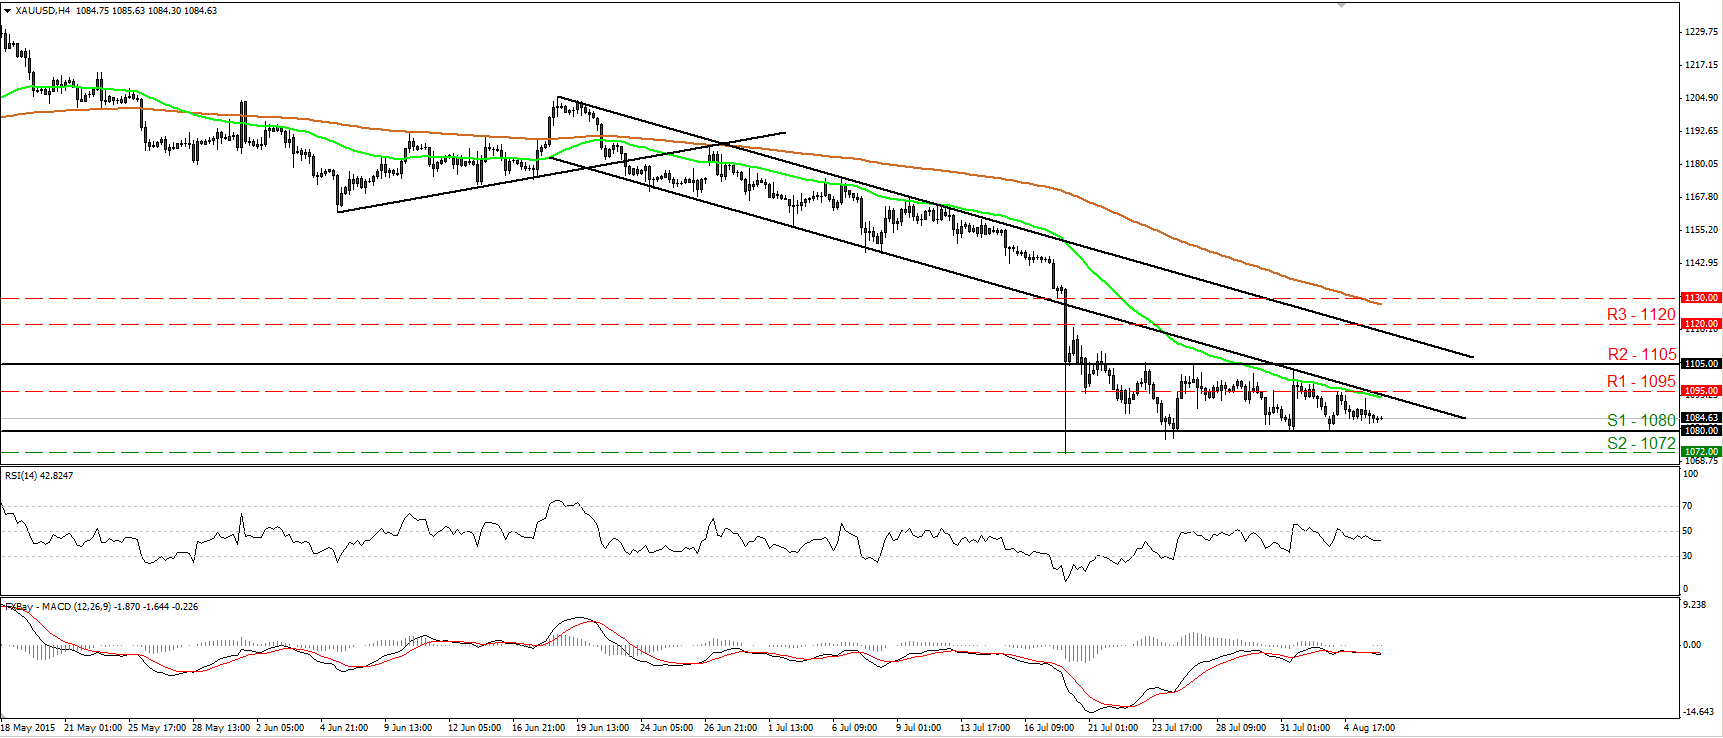
• Gold traded in a quiet mode on Wednesday, staying slightly above the support barrier of 1080 (S1). The metal has been oscillating between that support and the resistance of 1105 (R2) since the 21st of July, and therefore, I consider the short-term picture to be neutral. A break below 1080 (S1) is likely to shift the bias negative and perhaps bring into play the 1072 (S2) barrier, marked by the low of the 20th of July. A break below 1072 (S2) could set the stage for more bearish extensions and perhaps target the 1060 (S3) zone. Our short-term oscillators reveal negative momentum and increase the likelihood that the metal would exit the sideways range to the downside. In the bigger picture, the plunge on the 20th of July triggered the continuation of the longer-term downtrend and kept the overall bias of the yellow metal to the downside, in my view.
• Support: 1080 (S1), 1072 (S2), 1060 (S3)
• Resistance: 1095 (R1), 1105 (R2), 1120 (R3)
DAX futures extend higher and hit 11640
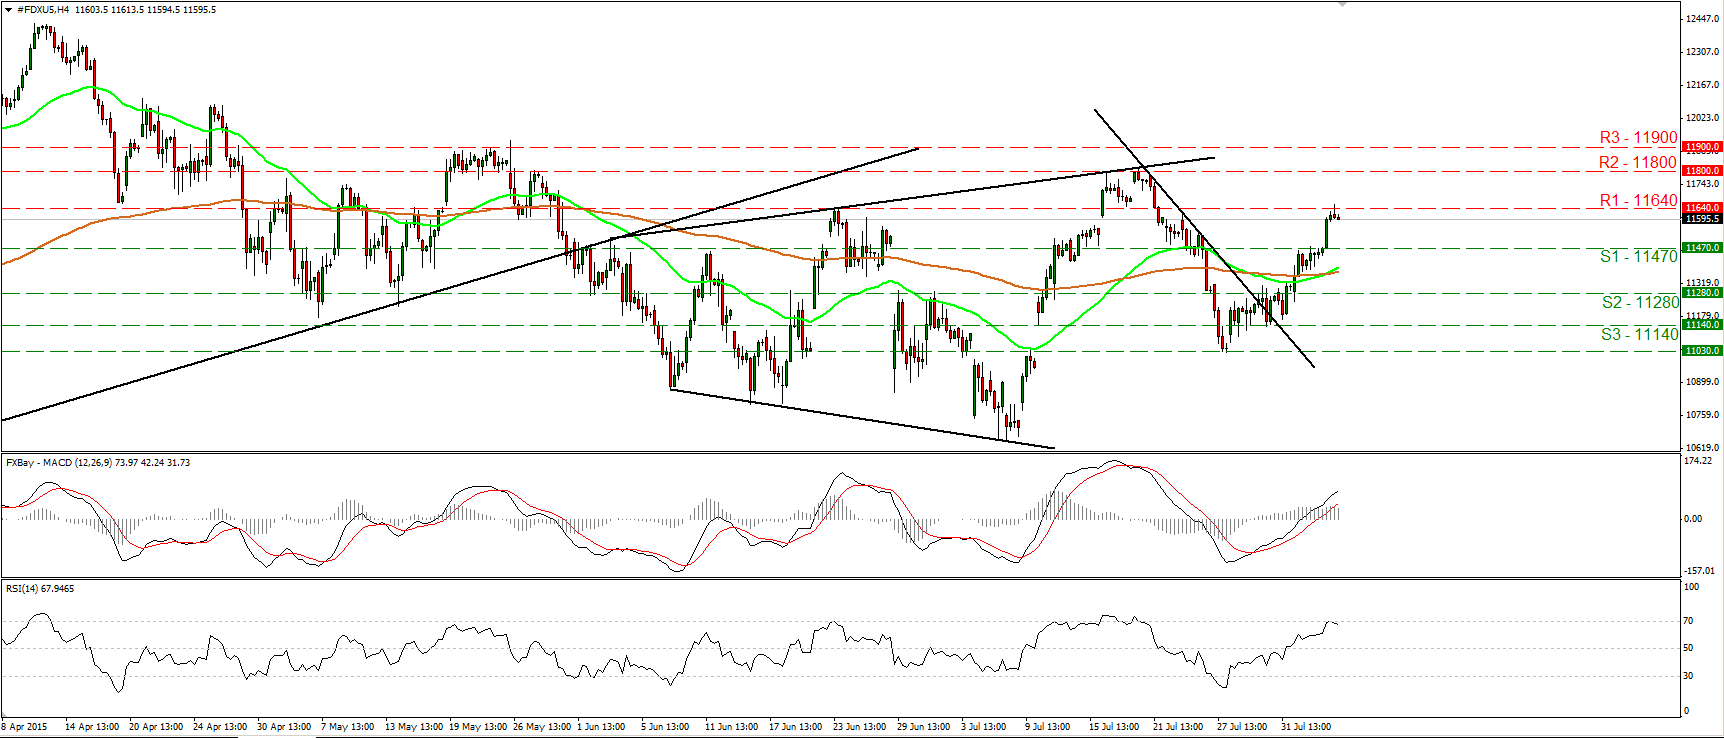
• DAX futures continued trading north on Wednesday, breaking above the resistance (now turned into support) of 11470 (S1) and reaching the 11640 (R1) obstacle. Since the index traded higher after it broke the short-term downtrend line taken from the peak of the 21st of July, I would consider the near-term bias to stay positive. As a result I would expect a clear move above 11640 (R1) to open the way for the next resistance at 11800 (R2). The MACD stands above both its zero and trigger lines pointing north, indicating bullish momentum. However, the RSI hit resistance at its 70 line and turned down, giving evidence that a downside corrective move could be in the works before the next positive leg. As for the broader trend, given the 20th -27th July plunge, I would switch my stance to neutral. I would like to see a clear close above 11800 (R2) before I get confident on the continuation of the major upside path. On the downside, only a daily close below 10670 would confirm a forthcoming lower low on the daily chart and turn the overall bias of DAX to the downside.
• Support: 11470 (S1), 11280 (S2), 11140 (S3)
• Resistance: 11640 (R1) 11800 (R2), 11900 (R3)

