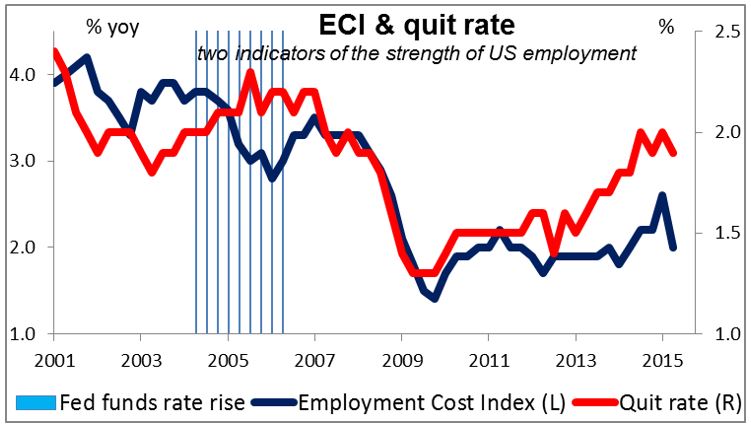
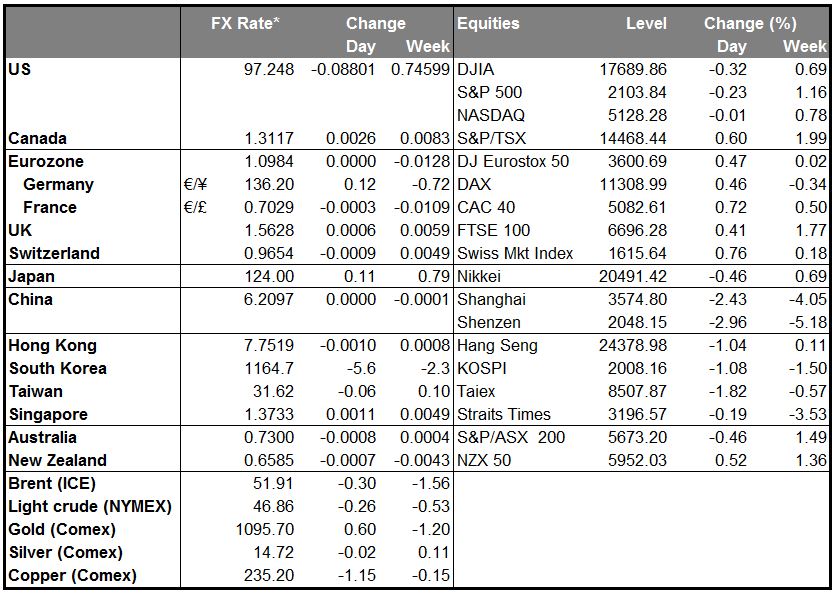
Dollar rallies on end-month buying The FOMC has said that the decision on whether to raise rates depends on the US economic data, so traders are ultra-sensitive to the US data nowadays. Friday’s Q2 employment cost index (ECI) shocked the market on the downside, with the smallest qoq growth in earnings since the series began in 1982. The Fed wants to see rising compensation and people quitting their jobs at an increasing pace as indirect indications of a firmer employment market. The disappointment led to some dollar weakness, as this was the last ECI report before the September FOMC meeting, but gradually investors dug into the data more and found that there were many special factors that reduced its credibility. End-month buying took over after that and the dollar ended Friday generally higher, even though fed funds rate expectations fell notably – end-2016 is back below 1%, for example.
• The dollar was helped by comments from St. Louis Fed President James Bullard, who said that the outlook for the US economy “remains fairly good” and that the latest data boosts the case for a rate hike in September. Although Bullard isn’t a voting member of the FOMC right now, his comments do show how some members of the FOMC must be viewing the data.
• Oil falls sharply on OPEC output, China fears; oil currencies fall too Oil fell sharply on Friday after the OPEC Secretary General said the group is “not ready” to cut production, while sluggish demand in China may reduce demand. The fact that Exxon Mobil Corp (NYSE:XOM) and Chevron Corp (NYSE:CVX), the biggest US energy producers, also announced disappointing earnings didn’t help matters either. Then the Iranian oil minister was quoted as saying Iran’s production can increase by 1mn barrels a day one month after sanctions are lifted, which Iran expects to happen by late November. That’s all the market needs to hears. Then this morning, the Caixin/Markit China manufacturing PMI for July was revised down sharply to 47.8 from 48.2, showing that the contraction in manufacturing is accelerating, which has caused oil to fall further today.
• The plunging oil price explains why CAD and NOK are the two worst-performing G10 currencies and RUB the second-worst performing EM currency. (TRY remains the worst performing, falling another 4% or so). However, MXN continued to recover, as did the Eastern European currencies. I remain bearish on oil and therefore bearish on these oil currencies in particular, commodity currencies in general.
• On the other hand, sterling looks like it could gain further as positioning is neutral (see below). There is a lot of news coming out about sterling on Thursday that could be the catalyst for a further leg up in the currency (or down too, don’t forget) (see below for details).
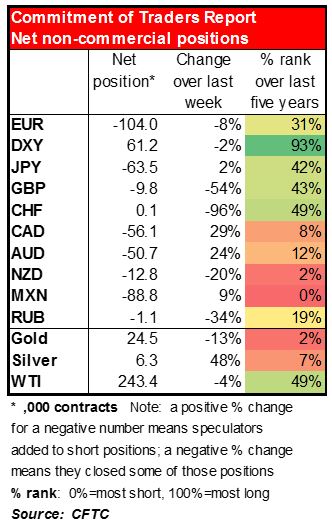
• Commitment of Traders report: positioning at extremes Positioning among speculators is hitting extreme levels for several currencies plus the precious metals. Investors seem very bearish indeed on the commodity-related currencies, especially those related to oil, even though positioning in oil itself is neutral. The large shorts in MXN may explain the snapback we’ve been seeing since the Mexican central bank announced that it would intervene in the FX market. Note though that positioning in the main G10 currencies – including EUR but more specifically JPY, GBP and CHF -- is quite neutral. This signals to me that there is plenty of room for speculators to expand positions in these currencies, particularly short JPY and long GBP.
• Today’s highlights: During the European day, we get the final manufacturing PMI figures for several European countries, and the Eurozone as a whole. As usual, the final forecasts are the same as the initial estimates. Market reaction on these news is usually limited unless there is a huge revision from the preliminary figures.
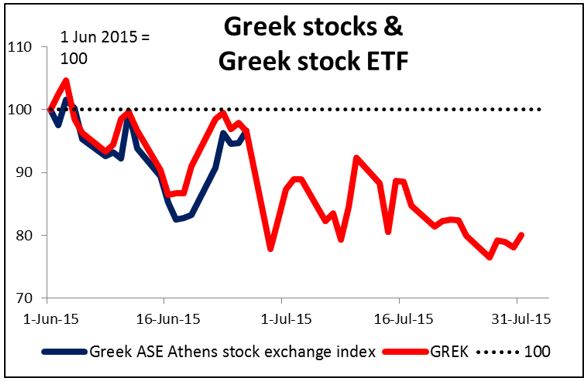
• The Greek stock market will reopen today. While it’s been closed, an ETF on Greek stocks listed in New York (NYSE:GREK) has fallen by 17%. That may be a reasonable estimate for what will happen when the Greek market reopens.
• In the US, we get the personal income and personal spending for June. Both are forecast to decelerate on a mom basis. The market will most likely focus on personal spending, which is forecast to slow sharply from May = a negative for the dollar. Even though the preliminary US GDP expanded in Q2, solid spending is needed to suggest that the economy has the steady momentum necessary to bring the Fed closer to a rate hike this year. Therefore, a significant positive surprise is needed for the USD to remain supported. The yoy rate of the PCE deflator and core PCE for June are also coming out. The PCE deflator is expected to decelerate, while the core PCE is forecast to remain unchanged in pace from May. The ISM manufacturing PMI index comes out a bit later and is expected to be unchanged at 53.5, which may offset the negative spending figures somewhat. Also, the final Markit service-sector PMI for July is due out.
• As for the speakers, Fed Governor Jerome Powell speaks.
• Rest of the week: We have a very busy week, featuring three G10 central bank meetings and the US nonfarm payrolls.
• Tuesday: The main event will be the Reserve Bank of Australia (RBA) policy meeting. At their last meeting, the RBA kept its cash rate unchanged and maintained a neutral bias as far as their future stance. The forecast is for the RBA to remain on hold again, hence the focus will most likely be on the statement accompanying the rate decision for any hints regarding the future path of the interest rate. If they maintain their neutral stance, AUD could strengthen a bit, at least temporarily.
• Wednesday: In the US, the ADP employment report for July is coming out two days ahead of the nonfarm payroll release, as usual. The ADP report is expected to show that the private sector gained fewer jobs in July than it did in the previous month, but still above the crucial 200k level. With a little more than a month before Fed’s September meeting, further improvement in the labor market is likely to increase speculation about the Fed raising rates.
• Thursday: We have a very big day in the UK; it’s going to be a super-Thursday, as we have the Bank of England policy meeting, the release of the minutes of the meeting with the officials’ votes, and new forecasts about the economy, all at the same time. On top of that, the August Inflation Report will be published simultaneously. This will be a massive amount of information and data that the market will have to digest very quickly. Besides the huge amount of data, the recent commentary by a number of MPC members suggest that a few of them are moving towards voting for the first rate increase. Therefore, we could have some dissenting votes this time. In such case, and along with new upbeat GDP and CPI forecasts, we believe that the pound would probably strengthen across the board, particularly against the weaker commodity currencies.
• Friday: The main event of the day will be the US nonfarm payrolls! The current market forecast for July is for an increase in payrolls of 223k, the same as in June. Another reading above 200k would suggest that the US labor market is gathering momentum and is likely to keep USD supported against its peers. Canada’s unemployment rate for July is also due to be released Friday.
• In addition to the employment reports, Bank of Japan hold its policy meeting Friday. Market expectations – and ours -- are for no change in BoJ policy. The focus will most likely be on Gov. Kuroda’s press conference afterwards. There will be particular interest in anything he might say about the controversy over revising the CPI statistics as part of the usual revisions every five year.
The Market
EUR/USD surges on the Employment Cost Index
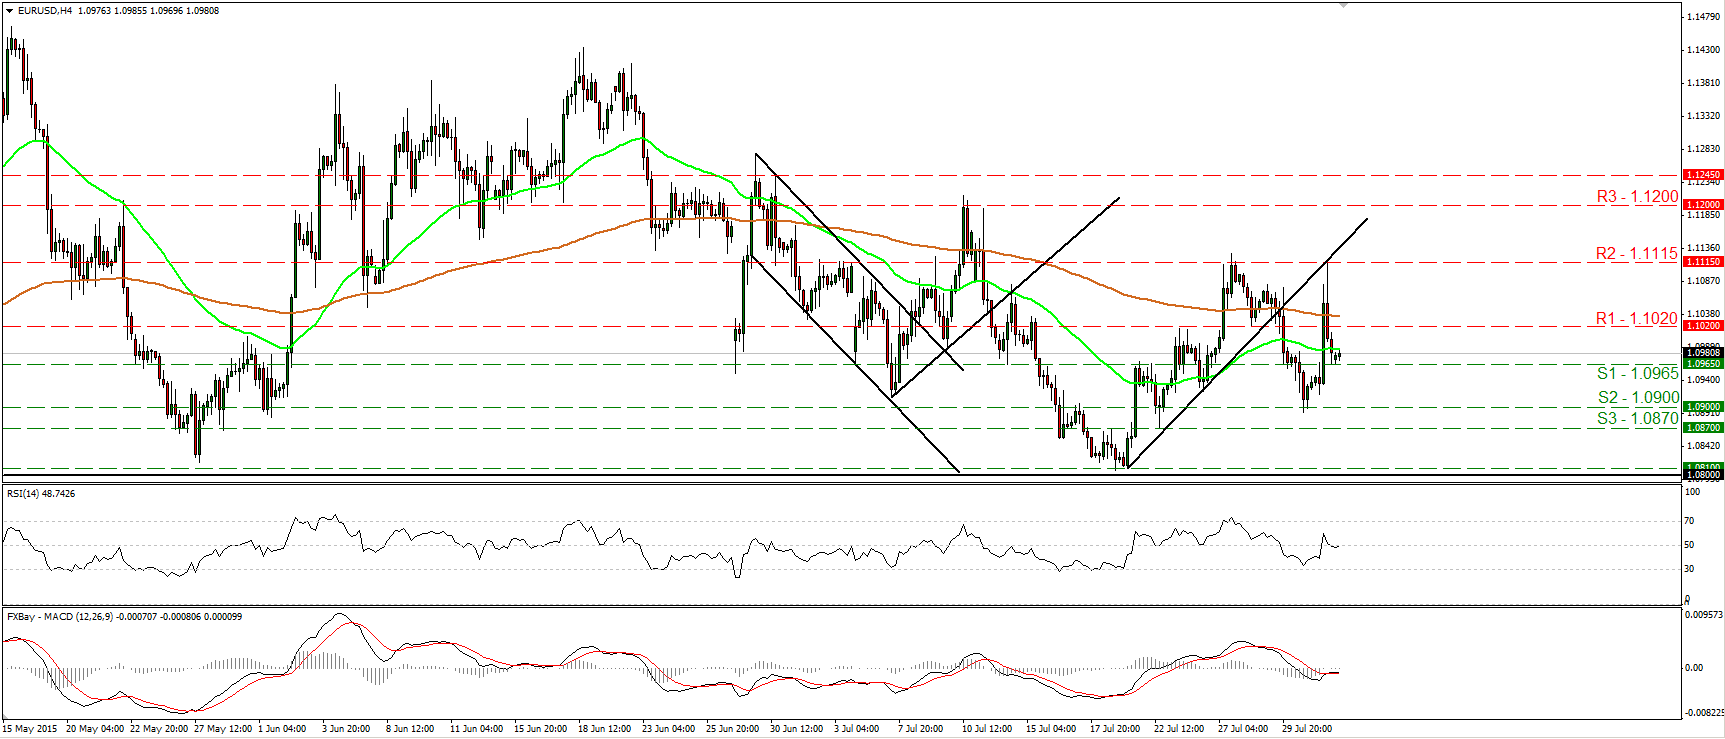
• EUR/USD surged on Friday after the US Employment Cost Index for Q2 rose by the lowest in the 33-year history of the report. Nevertheless, the rally was stopped at 1.1115 (R1) and the pair gave back a large portion of its gains. During the early European morning, EUR/USD is trading slightly above the 1.0965 (S1) line. A dip below that is likely to open the way for another test of the 1.0900 (S2) territory. Taking a look at our short-term oscillators though, I would be wary of an upside corrective bounce before the next negative leg, perhaps for a test at the 1.1020 (R1) line. The RSI shows signs of bottoming near its 50 line, while the MACD stands fractionally above its trigger line and could turn positive soon.
• As for the broader trend, as long as the pair is trading between 1.0800 and 1.1500, I would see a neutral longer-term picture. I believe that a move above the psychological zone of 1.1500 is the move that could carry larger bullish implications, while a break below 1.0800 is needed to confirm a forthcoming lower low on the daily chart and perhaps turn the overall bias back to the downside.
• Support: 1.0965 (S1), 1.0900 (S2), 1.0870 (S3)
• Resistance: 1.1020 (R1), 1.1115 (R2), 1.1200 (R3)
GBP/USD once again hits the 1.5670 barrier
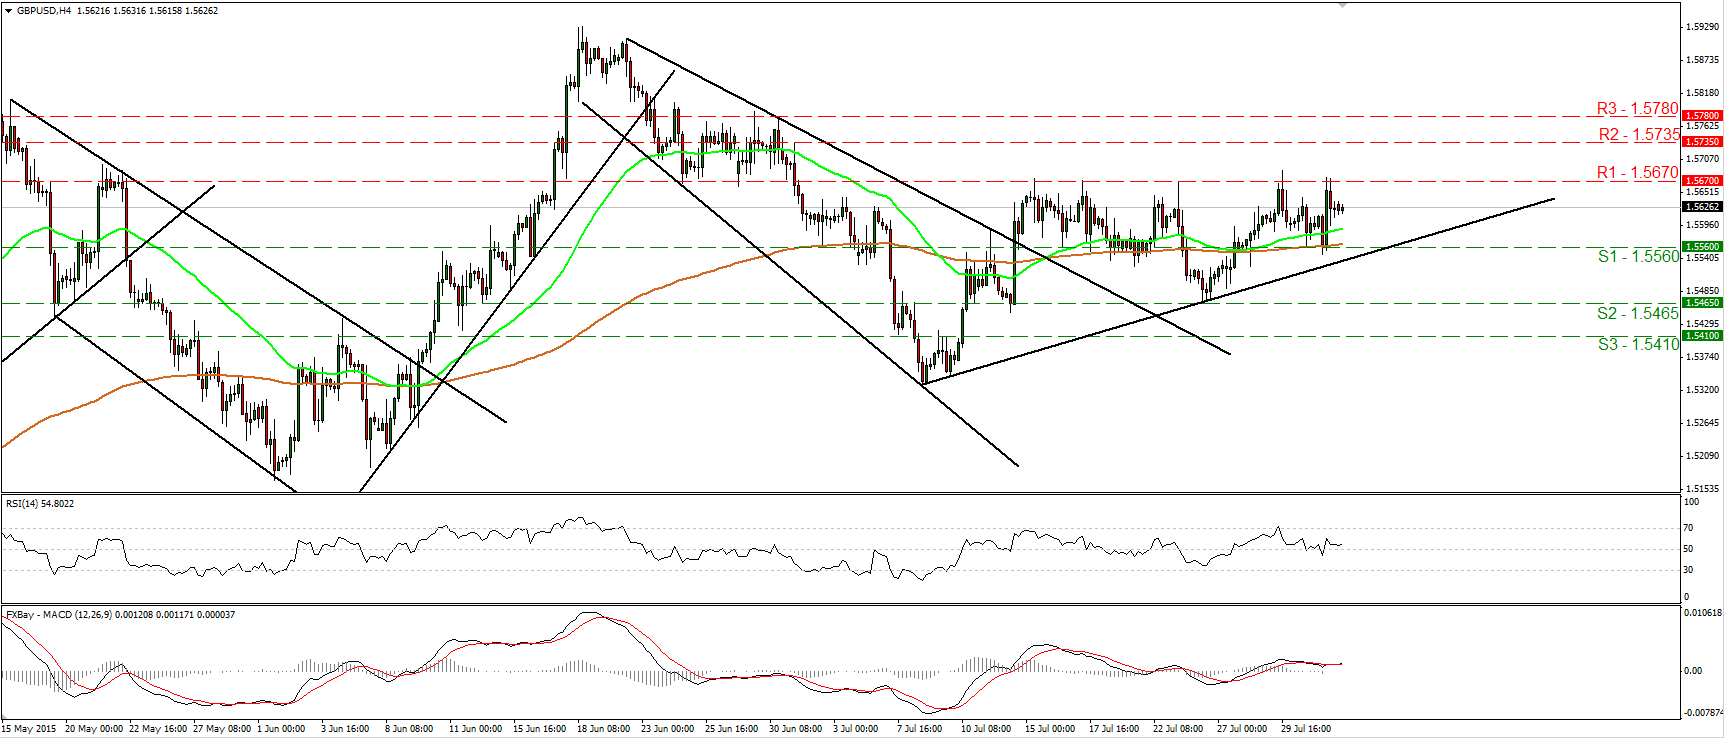
• GBP/USD found support near the 1.5560 (S1) line on Friday and rebounded to hit once again the strong resistance hurdle of 1.5670 (R1). I still believe that the short-term picture is cautiously positive, and therefore, a break above that resistance would confirm a forthcoming higher high on the 4-hour chart and perhaps open the way for the 1.5735 (R2) line. The RSI, already above its 50 line, looks ready to turn up again, while the MACD stands positive and just poked its nose above its trigger line. These indicators detect positive momentum and support that the pair could trade higher, at least in the short run. On the daily chart, cable is still trading above the 80-day exponential moving average. This makes me believe that the overall picture remains somewhat positive as well and that there is still the likelihood for the rate to trade higher in the not-to-distant future.
• Support: 1.5560 (S1), 1.5465 (S2), 1.5410 (S3)
• Resistance: 1.5670 (R1), 1.5735 (R2), 1.5780 (R3)
EUR/JPY climbs and hits resistance at 137.35
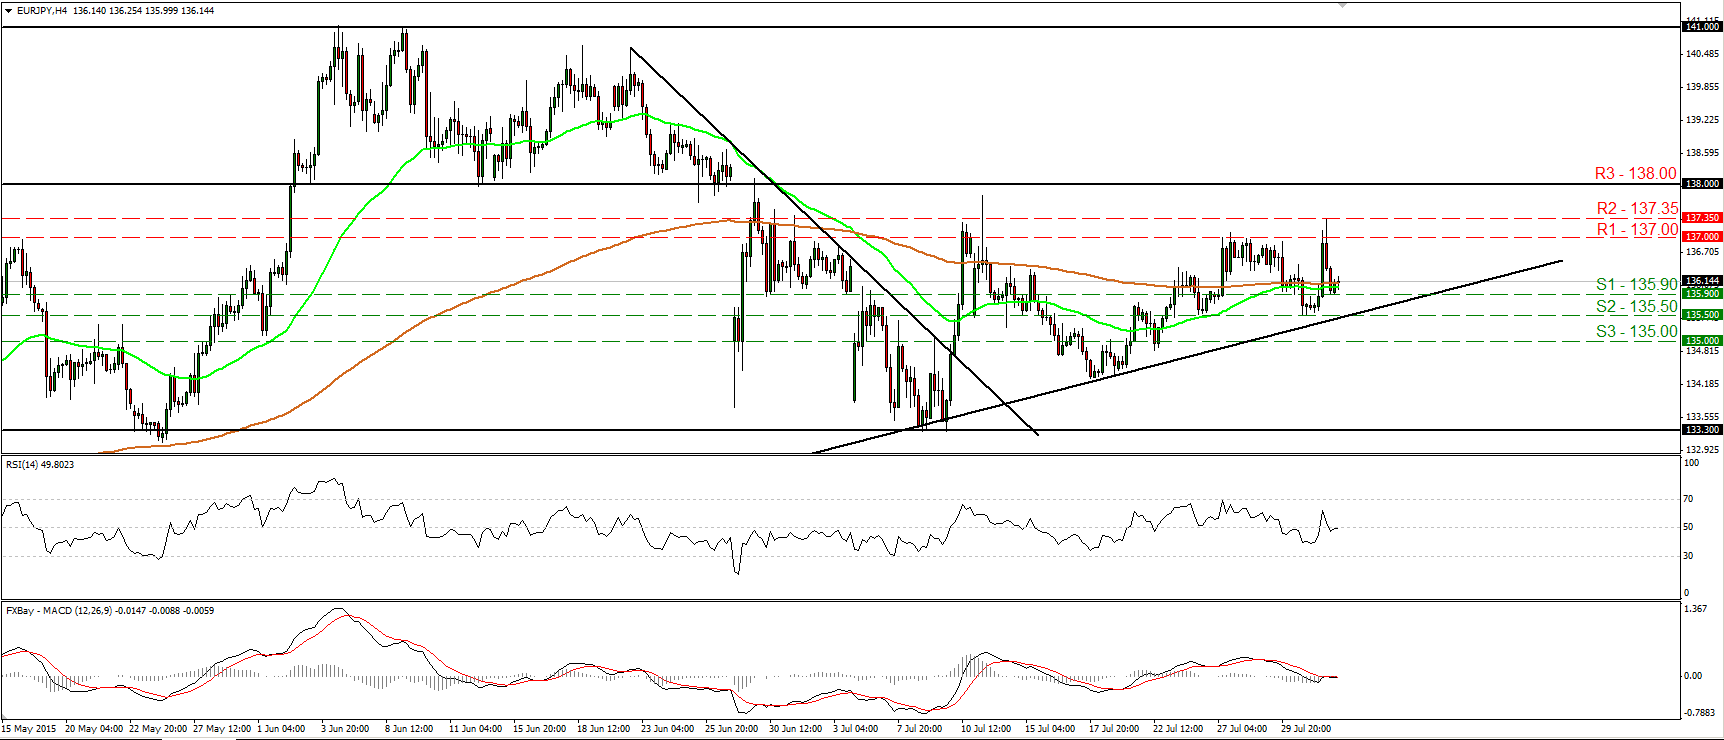
• EUR/JPY traded higher on Friday after it hit support at 135.50 (S2). Subsequently, the rate found resistance at 137.35 (R2) and retreated to find support at 135.90 (S1). I believe that the short-term picture stays somewhat positive and therefore, I would expect the forthcoming wave to be positive, perhaps to challenge once again the 137.00 (R1) barrier. Our short-term oscillators stand near their equilibrium lines, but the RSI has turned up and looks ready to move above 50 soon. This corroborates my view that the forthcoming move is likely to be to the upside. On the daily chart, the pair is still trading above the medium-term uptrend line taken from the low of the 14th of April, and above the 133.30 support area, which stands marginally below the 50% retracement level of the 14th of April – 4th of June advance. As a result, I would see a cautiously positive longer-term picture as well. I would like to see a daily close below that area before I assume that the medium-term picture has turned negative.
• Support: 135.90 (S1), 135.50 (S2), 135.00 (S3)
• Resistance: 137.00 (R1), 137.35 (R2), 138.00 (R3)
Gold rebounds from 1080
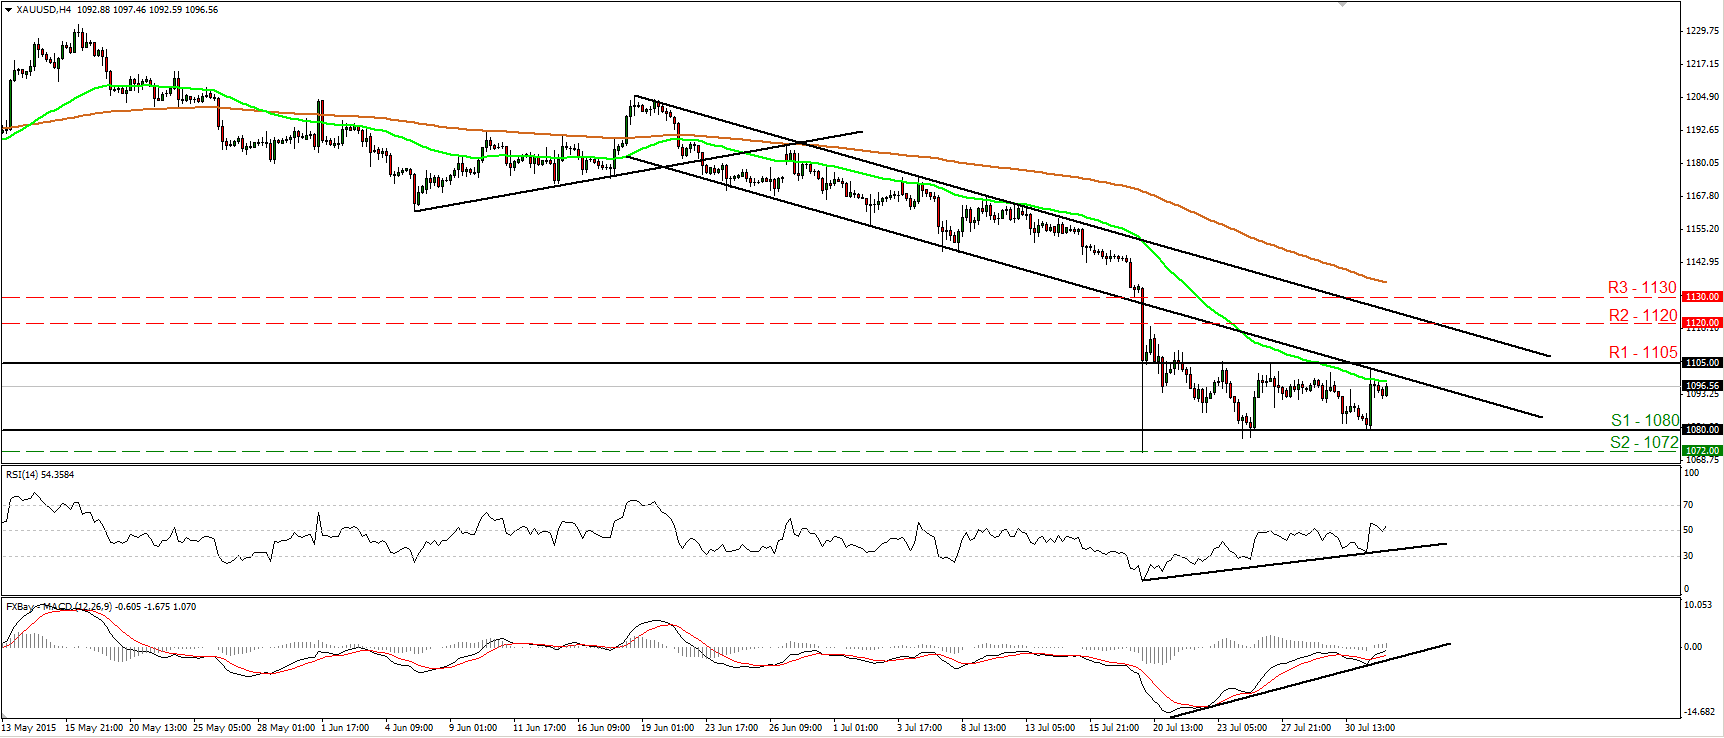
• Gold traded higher on Friday after it hit support at 1080 (S1). The metal has been oscillating between the aforementioned support and the resistance of 1105 (R1) since the 21st of July, and therefore, I would consider the short-term picture to be neutral. Looking at our short-term momentum indicators though, it is possible that gold could extend a bit higher. The RSI rebounded from its 50 line, while the MACD stands above its trigger line and could obtain a positive sign soon. What is more, there is positive divergence between both these indicators and the price action. A clear move above 1105 (R1) is likely to confirm the case and perhaps extend the bullish wave towards our next resistance of 1120 (R2). In the bigger picture, the plunge on the 20th of July triggered the continuation of the longer-term downtrend and kept the overall bias of the yellow metal to the downside, in my view.
• Support: 1080 (S1), 1072 (S2), 1060 (S3)
• Resistance: 1105 (R1), 1120 (R2), 1130 (R3)
WTI continues its tumble and hits 46.35
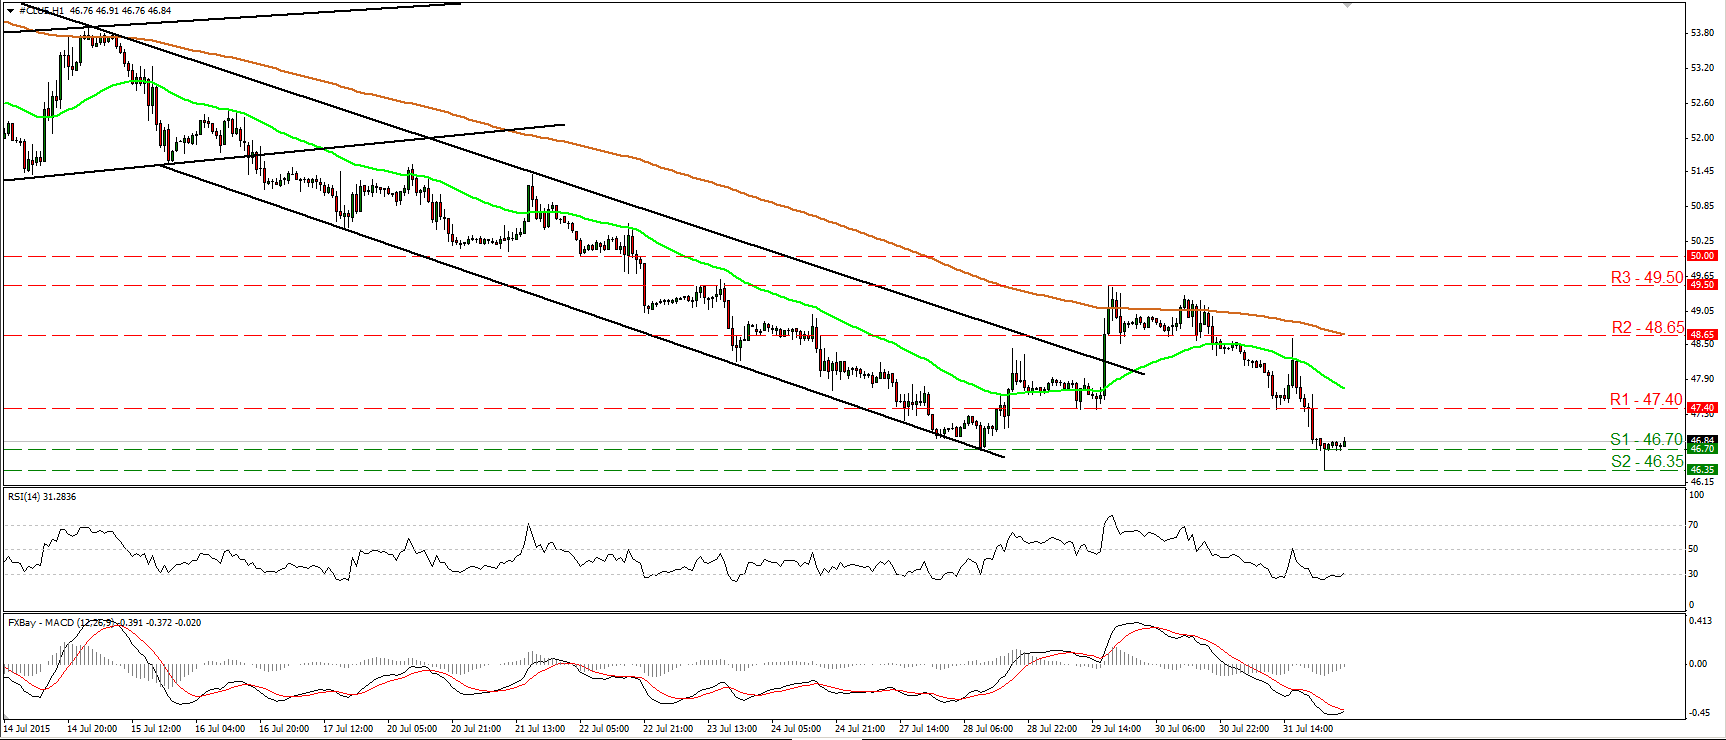
• WTI continued falling on Friday and during the Asian morning Monday, it hit support at 46.35 (S2). The short-term outlook remains negative, but I would now expect the forthcoming wave to be positive, perhaps for a test at the 47.40 (R1) resistance barrier. The 14-hour RSI has just exited its below-30 territory, while the hourly MACD has bottomed and could cross above its trigger line soon. On the downside, a move below 46.35 (S2) is needed to confirm a forthcoming lower low, and could probably open the way for the psychological barrier of 45.00 (S3). On the daily chart, I see that the medium-term trend is negative as well.
• Support: 46.70 (S1), 46.35 (S2), 45.00 (S3)
• Resistance: 47.40 (R1) 48.65 (R2), 49.50 (R3)

