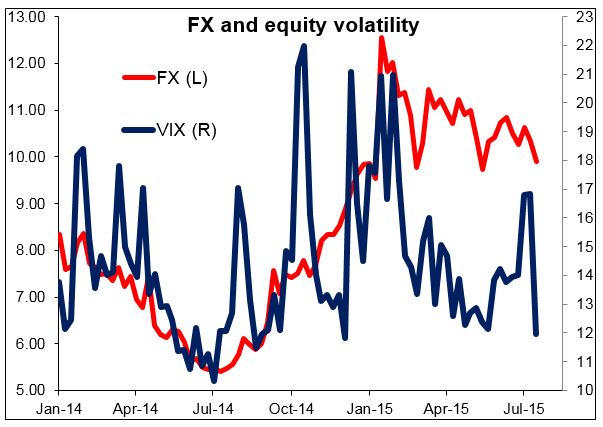
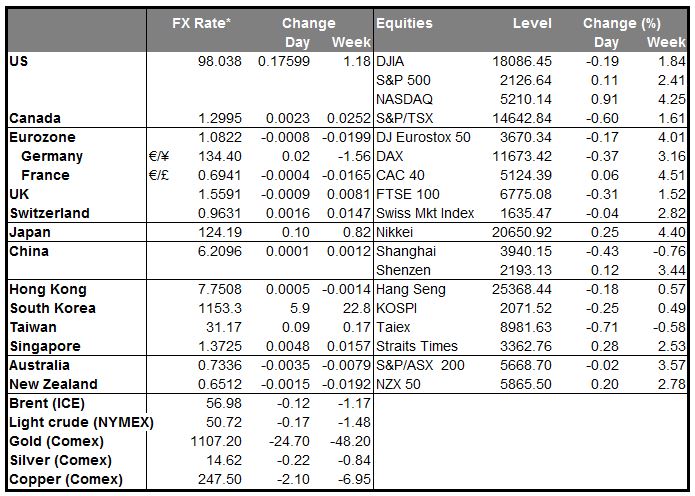
• Confidence returns, with a twist The fears of Greece imploding and bringing the global financial system down with it – if they ever existed – have faded quickly. The VIX index, the so-called “Wall Street fear gauge,” has gone from a three-month high on 9 July to a three-month low on Friday. Eurozone peripheral bond spreads finished the week stable at significantly lower levels than they opened on Monday (Spain for example narrowed 10 bps over the week to 115, while Portugal tightened 9 bps to 185).
• Confidence in the US economy increased too, as US inflation accelerated modestly in June and housing starts and building permits for the month both surpassed expectations. Fed fund rate expectations rose modestly, while bond yields were little changed. Stocks rose for the sixth day out of seven and the NASDAQ index hit a new record high.
• Yet the confidence did not return to commodities, which continued to sink: WTI is down 0.5% from Friday morning’s opening and copper is down 2%. Gold, another measure of risk version, is down 3.2%. This is odd because usually when investors expect economic expansion, they foresee increased demand for commodities.
• So what does it mean when confidence seems to be coming back, yet investors don’t expect increase in demand for commodities? Two things are possible: one, a supply shock that means any increase in demand will be more than offset by an increase in supply, and secondly, a change in the nature of the demand. I think both are at play here. Certainly the price of oil and iron ore, for example, are being depressed by new supply coming on stream. At the same time, the increase in economic activity seems to be shifting from the EM countries, which are relatively commodity-intensive, to the developed nations, which use less commodities for each unit of GDP. Growth in the US and Eurozone taking over from growth in China as an engine of the global economy would be one such example.
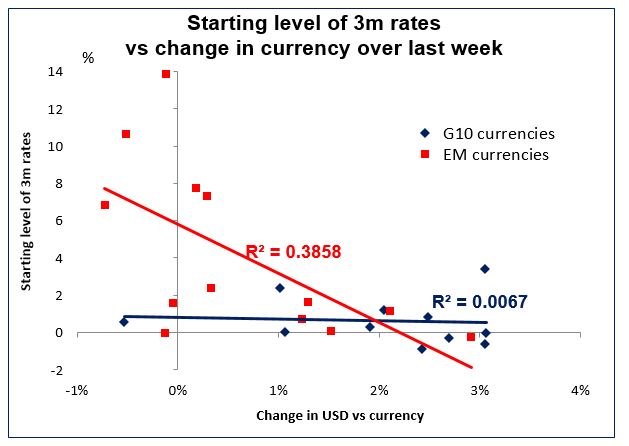
• From fear to carry It was noticeable that the US high-grade bond market had its fifth busiest week ever last week, and most new issued tightened once trading began. The fall in the VIX and the demand for bonds indicate a shift from fear to carry. Will this spill over to the FX market? Although the TRY was the worst-performing EM currency we track on Friday, nonethelessm it was the best-performing one over the week as a whole, followed by ZAR. Indeed, looking at the performance over the last week, it does seem that among EM currencies, those with the highest short-term interest rates were the best-performing ones. That should favour RUB, TRY, ZAR and MXN, although I suspect that RUB and MXN are more affected by oil prices than by carry. TRY not only has the benefit of some of the highest interest rates among currencies, but is also a commodity importer, not exporter, so its balance of payments should benefit from the fall in commodity prices.
• Among the G10 currencies, however, the level of interest rates had no discernible connection with the performance of the currency. Indeed NZD, with the highest short-term rates among the G10, was also the worst-performing currency. That shows one has to look at everything surrounding a currency, not just one factor.
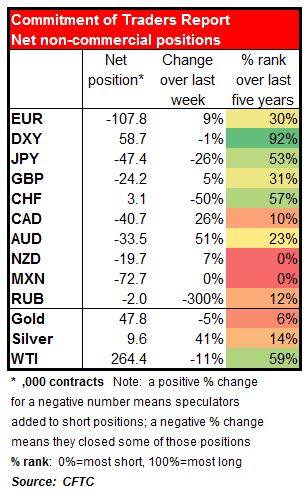
• Speculators add to EUR shorts, cut JPY shorts Friday’s Commitment of Traders report showed that investors added to their EUR shorts and cut JPY shorts. Is EUR going to replace JPY as the funding currency of choice? EUR shorts are still at only the 30% rank over the last five years, indicating that positioning is short, but not yet at an extreme level, unlike NZD and MXN, for example, which are the shortest they’ve been in the last five years (0% level). But the absolute number of NZD contracts, -19,654, is still relatively small, so I believe investors can add to their position. MXN may be due for a rebound, however, although that depends to a large degree on oil prices. Speaking of which, speculators are still very long oil – there could be further long liquidation that would pressure the price. The other notable point is that investors added to their short GBP positions last week – oops! Sterling was the only G10 currency to gain vs USD last week. I could envision a big repositioning in GBP that would push the currency higher.
• Today’s highlights: The calendar is relatively light with no major indicators on the agenda. During the European day, Eurozone’s current account for May is due to be released.
• As for the rest of the week, the highlights will be the RBNZ meeting on Thursday and three central banks (Japan, Australia and UK) releasing the minutes of their recent meetings.
• On Tuesday, during the Asian day, Bank of Japan releases the minutes of its June 18-19 meeting. As usual, these are not the minutes from the most recent meeting, but rather from the previous one. Since at their latest meeting, the Bank maintained the likelihood that it would achieve its 2% inflation target on schedule, despite having lowered slightly its FY2016 forecast, the minutes of the previous meeting shouldn’t be of much interest.
• In Australia, the RBA releases the minutes of its July meeting. At that meeting, the Bank kept its Cash Rate (CR) unchanged at 2% as expected and again, showed no clear bias with regards to the direction of the next move in rates. They could confirm that monetary policy should stay accommodative and that the data in the future will tell them whether their stance is appropriate. Therefore, the market reaction to this event could be minimal.
• On Wednesday, the Bank of England releases the minutes of its July meeting. Following the hawkish comments by the BoE Governor Mark Carney that the first rate hike is getting closer, it will be interesting to see if any of the MPC members who previously voted for a rate hike are likely to resume their hawkish stance any time soon. I would expect GBP to regain its momentum, as investors continue to re-price their rate hike expectations by the BoE.
• As for indicators, from Australia, Q2 CPI is forecast to accelerate. The market seems to focus on the trimmed mean CPI rate, which is expected to remain unchanged at 2.3% yoy. Even though the positive data are likely to strengthen AUD somewhat, I would expect the low energy and commodity prices to drag down the currency.
• On Thursday, the highlight of the day will be the RBNZ policy meeting. At their last meeting, the Bank not only cut rates by 25 bps, as the market largely expected, but also announced an easing bias. Given the recent weakness in the milk auction results, the poor CPI data for Q2 and the exposure to the soft Chinese and Australian economies, New Zealand’s biggest trading partners, the Bank could act again to support the economy. One of the important facts about New Zealand is that it remains one of the few G10 countries that can still lower interest rates – at 3.25%, the cash rate is still far above the next highest country Australia, which stands at 2.0%. I believe that as rate cut expectations build up, NZD could come under renewed selling pressure.
• Finally, Friday is a PMI day. During the European trading session, we get the preliminary manufacturing and service-sector PMI data for July from several European countries and the Eurozone as a whole. The expectations are for the figures to show a moderate improvement. With the Greek crisis now off investors’ radar, economic data are likely to start being important. A rise in the PMI could strengthen EUR a bit.
• In the US, the Markit PMI is expected to increase somewhat, another sign that the US economy is on a stable path.
The Market
EUR/USD hits the 1.0820 barrier
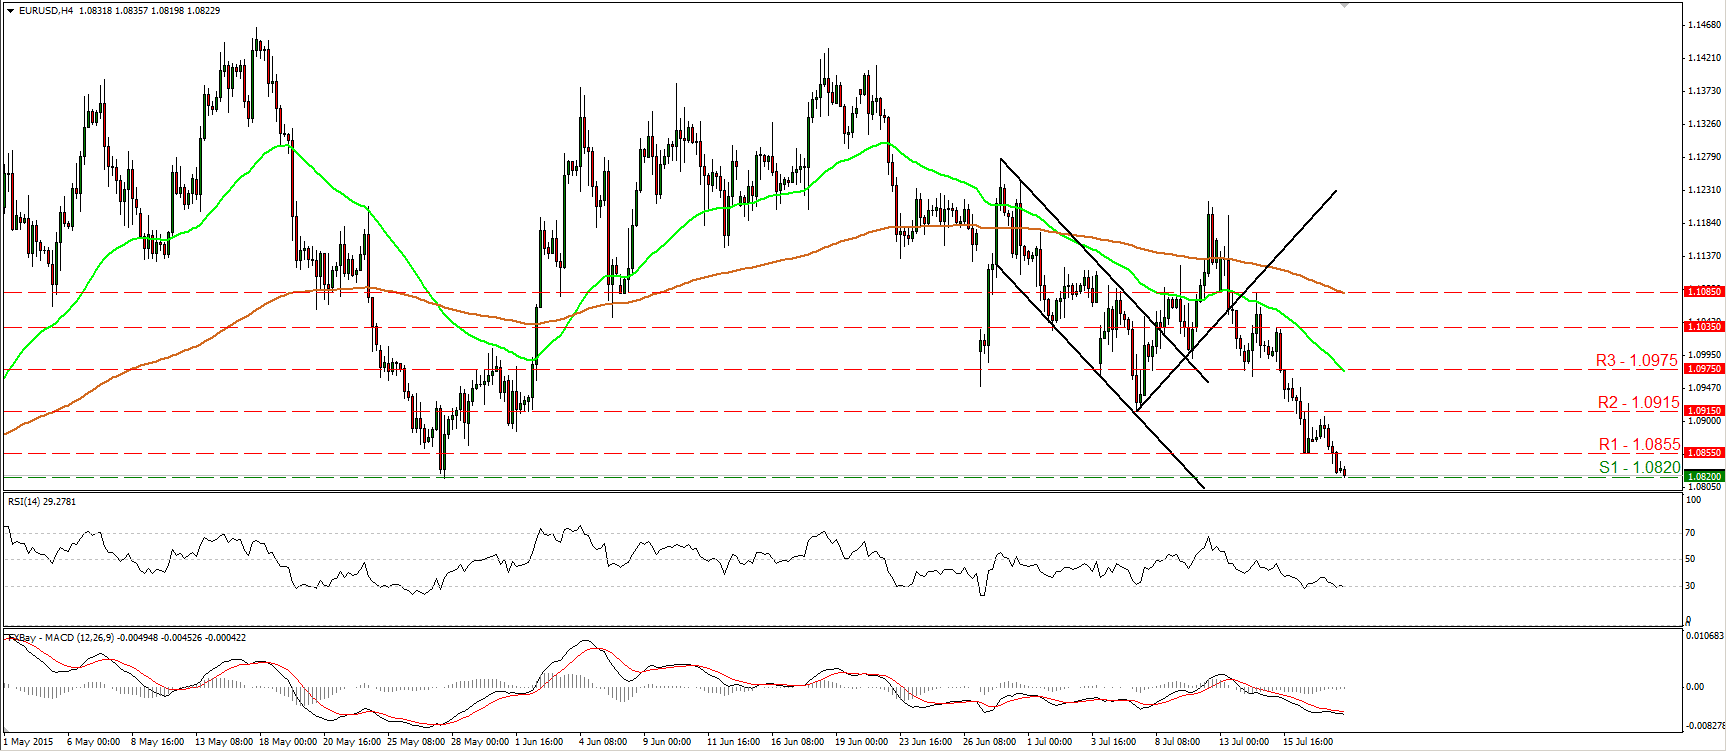
• EUR/USD hit resistance at 1.0915 (R2) on Friday and tumbled to break below the support (now turned into resistance of 1.0855 (R1). Today, during the early European morning, the rate is testing the 1.0820 (S1) support, defined by the low of the 27th of May. A break below that line is likely to bring into the game the 1.0800 (S2) obstacle. A decisive dip below that level could carry larger bearish extensions and perhaps target the 1.0660 (S3) area defined by the low of 23rd April. Our short-term oscillators detect strong downside speed and amplify the case for further declines. The RSI looks able to move below its 30 line, while the MACD stands below both its zero and signal lines, pointing south. As for the bigger picture, a daily close below 1.0800 (S3) is needed to confirm a forthcoming lower low on the daily chart and perhaps turn the overall bias back to the downside.
• Support: 1.0820 (S1), 1.0800 (S2), 1.0660 (S3)
• Resistance: 1.0855 (R1), 1.0915 (R2), 1.0975 (R3)
GBP/USD trades in a consolidative manner
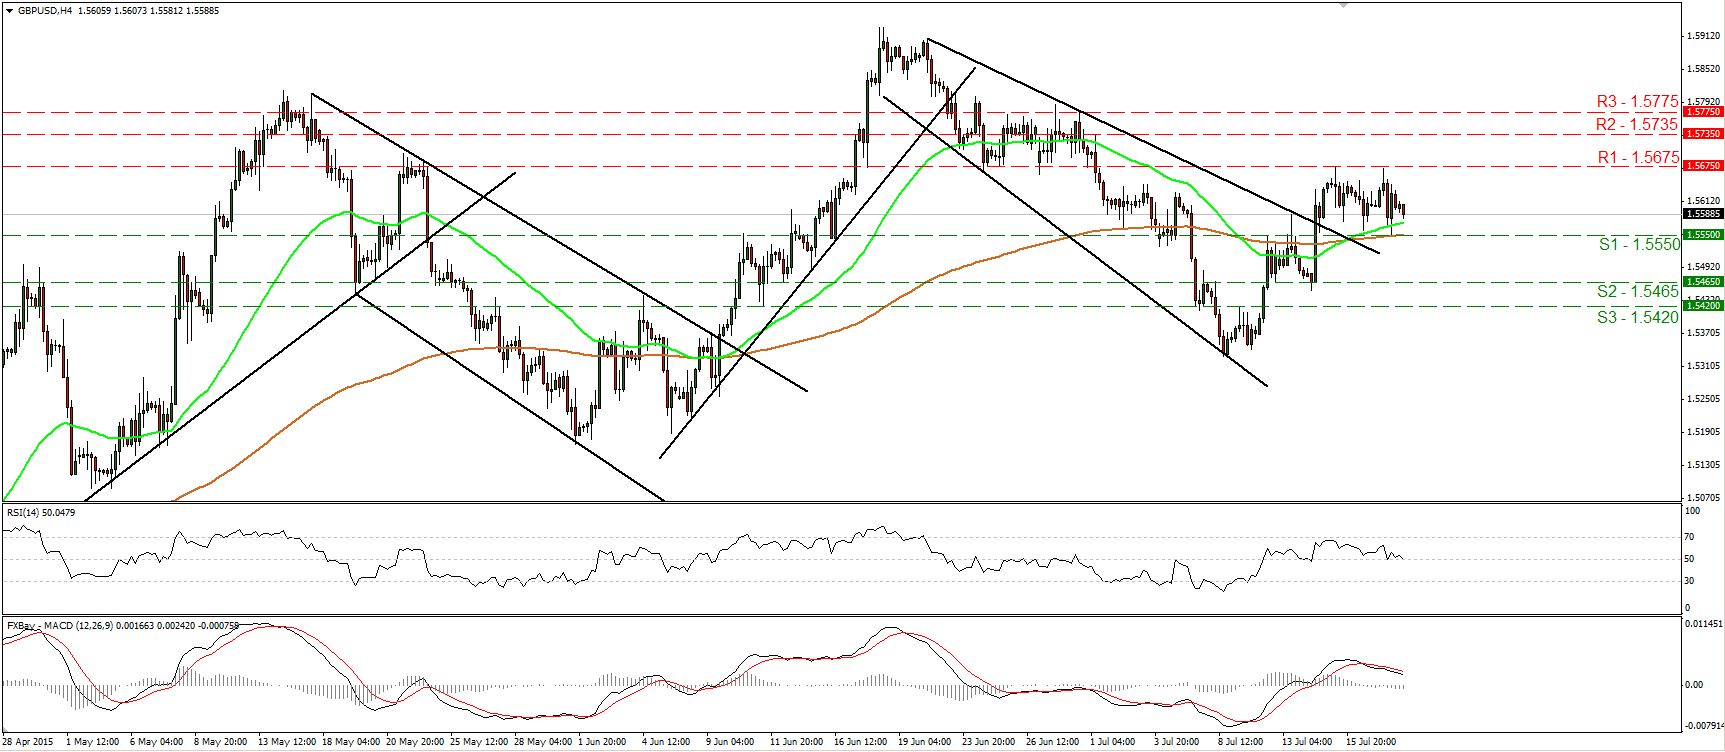
• GBP/USD again hit resistance at 1.5675 (R1) and retreated to find support at 1.5550 (S1). Cable has been oscillating between these two barriers since the 14th of July, and therefore, I would consider the short-term bias to be neutral for now. Taking a look at our short-term oscillators though, I see signs that we may experience the downside exit of the range in the near term. The RSI declined, and now looks ready to move below its 30 line, while the MACD, although positive, stands below its trigger line and is headed towards its zero line. A clear move below 1.5550 (S1) is likely to confirm the case, and perhaps pave the way for 1.5465 (S2). Switching to the daily chart, I see that cable printed a higher low at around 1.5330, and that is still above the 80-day exponential moving average. As a result, I would consider the overall picture to stay somewhat positive, and I would treat any possible near-term declines as corrective moves, at least for now.
• Support: 1.5550 (S1), 1.5465 (S2), 1.5420 (S3)
• Resistance: 1.5675 (R1), 1.5735 (R2), 1.5775 (R3)
EUR/JPY breaks below 134.70
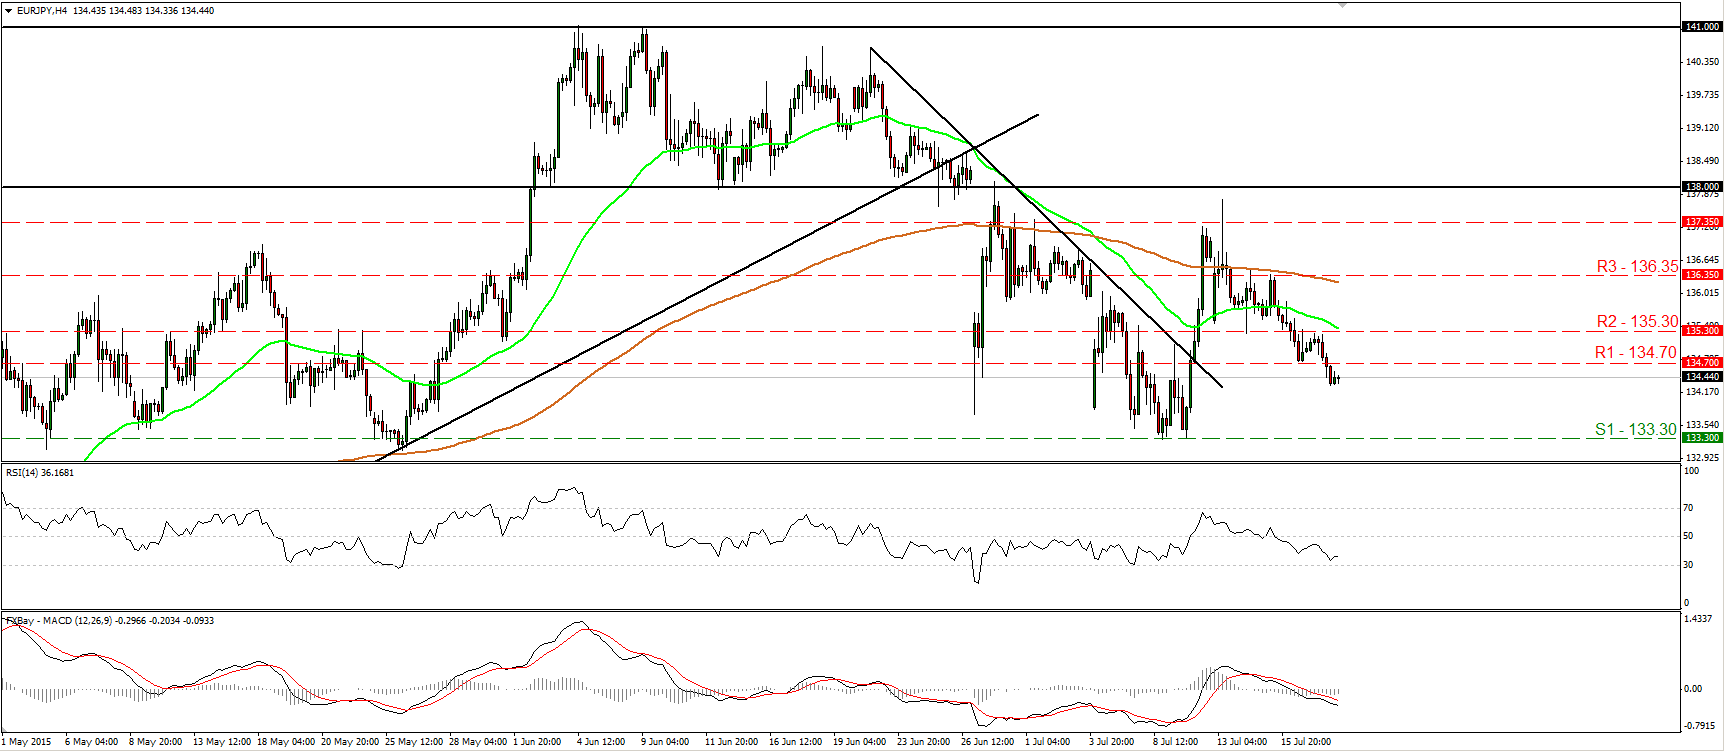
• EUR/JPY slid on Friday after hitting resistance at 135.30 (R2), and managed to break below the support (now turned into resistance) barrier of 134.70 (R1). I would now expect the bears to pull the trigger for the well-tested support area of 133.30 (S2). Shifting my attention to our momentum indicators, I see that the RSI continued lower and is now headed towards its 30 line, while the MACD stands below both its zero and signal lines. These momentum signs corroborate my view and amplify the case for further declines, at least in the short run. On the daily chart, I see that the 133.30 (S1) support area stands marginally below the 50% retracement level of the 14th of April – 4th of June advance. As a result, although I expect some further short-term declines, I would like to see a daily close below that area before I assume that the medium-term picture has turned negative as well.
• Support: 133.30 (S1), 132.55 (S2), 131.40 (S3)
• Resistance: 134.70 (R1), 135.30 (R2), 136.35 (R3)
DAX futures find resistance near 11800 and retreat
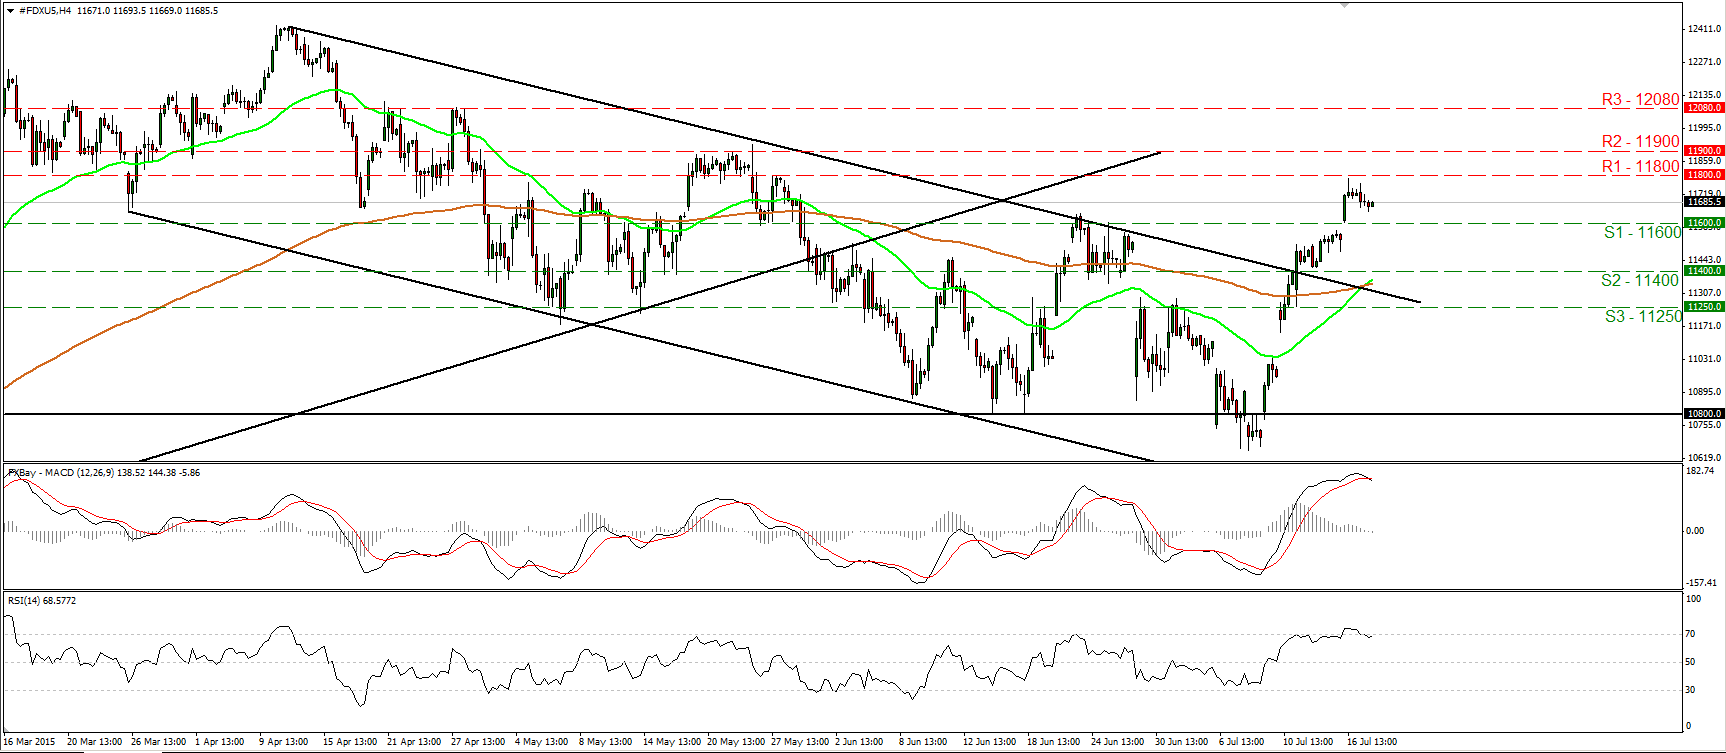
• DAX futures broke above the resistance (turned into support zone) of 11600 (S1) on Thursday, but the advance was halted fractionally below the 11800 (R2) zone. On Friday, the index retreated somewhat. As long as the index is trading above the upper bound of the downside channel that had been containing the price action from the last days of March until the 10th of July, I would consider the outlook to stay somewhat positive. If buyers are strong enough to overcome the 11800 (R1) zone, I would expect them to initially target the 11900 (R2) area. A break above 11900 (R2) is the move that could trigger larger bullish extensions, perhaps towards 12080 (R3). Taking a look at our near-term momentum studies, I see signs that further corrective pullback could be in the works before the bulls take charge again. The RSI exited its overbought territory, while the MACD has topped and fallen below its signal line. Plotting the daily chart, I see that the move out of the channel on the 13th of July, is a first sign that the 10th of April – 8th of July decline was just a corrective phase of the prior uptrend. What is more, the recent rally also confirmed the positive divergence between our daily oscillators and the price action.
• Support: 11600 (S1), 11400 (S2), 11250 (S3)
• Resistance: 11800 (R1) 11900 (R2), 12080 (R3)
Gold falls off the cliff
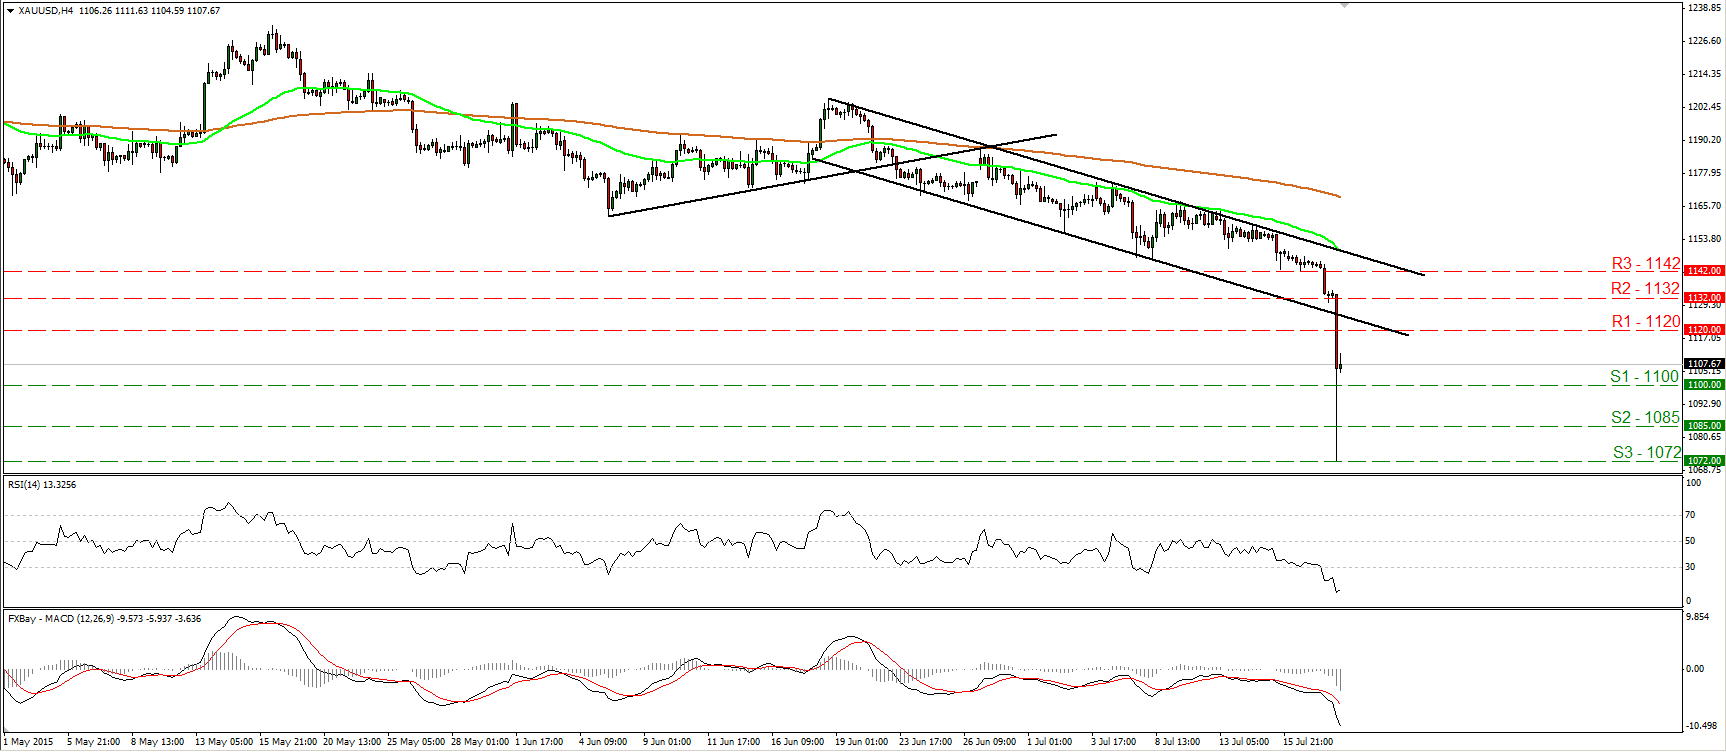
• Gold plunged during the Asian morning Monday, dipped below the 1100 (S1) barrier, and hit support at 1072 (S3). Subsequently the metal rebounded to trade back above the 1100 (S1) zone. The metal is now trading below the lower line of the short-term downside channel that had been containing the price action from the 18th of June until today, and as a result, I would consider the short-term outlook to remain negative. I would expect another move below 1100 (S1) to initially target the 1085 (S2) line, marked by the 24th and 25th of March 2010. Nevertheless, taking into account our short-term oscillators and the fact that the fall was overextended, I would expect the current rebound to continue for a while, perhaps to challenge the 1120 (R1) zone as a resistance this time. The MACD stands well below both its zero and signal lines, confirming the strong downside momentum, but the RSI has bottomed within its below-30 territory, supporting the case that the current rebound may continue for a while.
• Support: 1100 (S1), 1085 (S2), 1072 (S3)
• Resistance: 1120 (R1), 1132 (R2), 1142 (R3)

