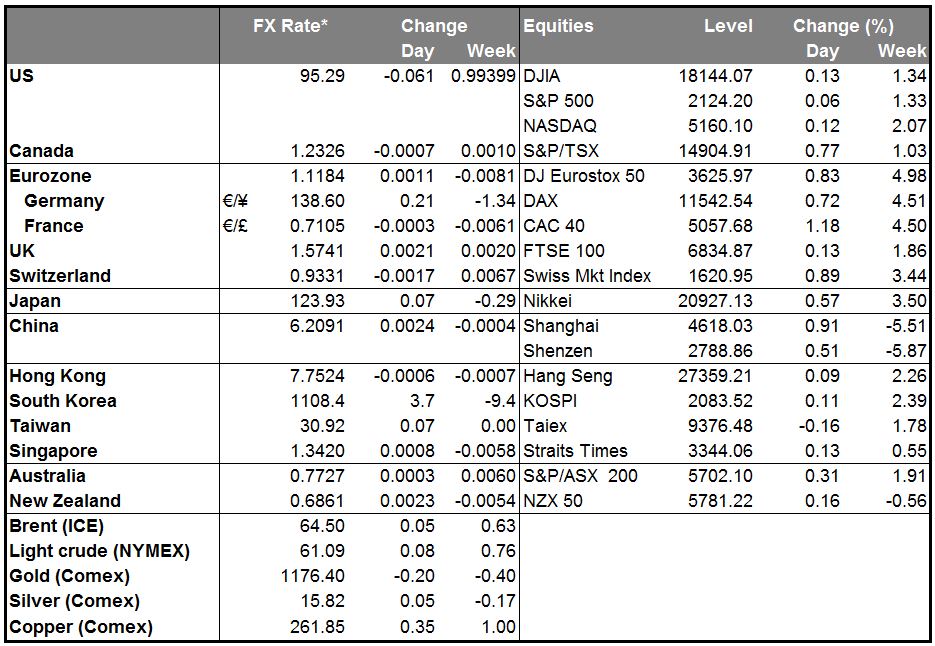
•With Greece on its way to being solved, monetary policy dominates markets As the market discounted the successful resolution of the long-running Greek drama, attention reverted to monetary policy divergence and the likelihood of Fed tightening. As a result, the dollar continued to gain against most currencies. The commodity currencies were the only exception, as oil prices surged.
•Fed funds rate expectations continued to move higher – up 2.5 bps from Aug. 2016 out – and bond yields also rose, as US new home sales exceeded expectations to hit a new high for this economic cycle. The May durable goods report was mixed, with the headline number falling more than expected on a large drop in the volatile civilian aircraft orders series, but the key core gauge of equipment demand -- nondefense capital goods excluding aircraft orders – extending a modest recovery. The news outweighed a somewhat disappointing Markit manufacturing PMI for the US.
•One reason for the dollar’s general strength was that Fed Governor Jerome Powell said he sees a 50-50 chance that the US economy will improve enough for him to support a rate hike in September and a second one in December, bringing to five the number of Fed officials who see two rate hikes this year. That’s one less than half of the 12 voting members of the FOMC. These people are comfortable raising rates, even though they see growth this year at only around 2%, which indicates that they have adjusted their outlook to take into account a substantial decline in trend growth, and they still want to lift rates from zero nonetheless. The fact that so many members of the FOMC hold such views means that on a risk-adjusted basis, the Fed funds futures for December at 0.32% — discounting only a small chance of a second rate hike — is perhaps too low.
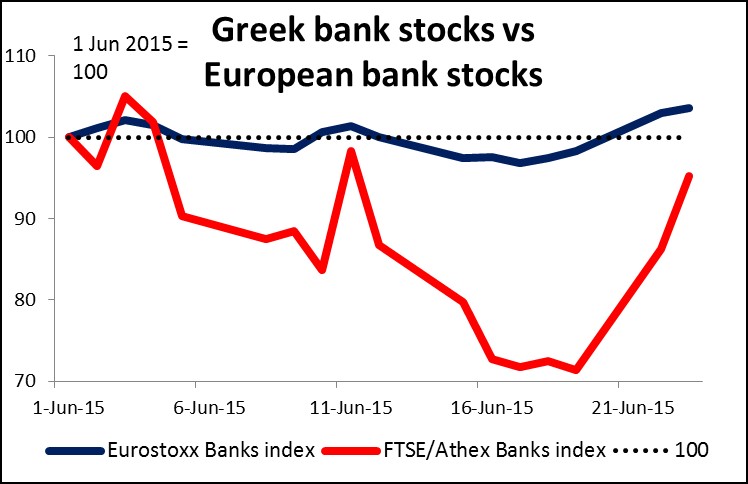
•Tsipras caught between a rock and a hard place Optimism about a solution to the long-running Greek drama is running high, as both sides show new determination to reach an agreement. Greek stocks were up 6.1% yesterday, with the banks rising 10.4%. Nonetheless, there are still a lot of hurdles to overcome as Greek PM Tsipras is caught between a rock and a hard place: Officials think his proposals do not go far enough, while members of his own party think they go too far.
•According to the Greek newspaper Kathimerini, EU officials say that Greece’s proposals violate many of the creditors’ “red lines” on value-added tax rates and pensions. Creditors think the Greek proposal is too heavy on revenue-raising measures, which could push the country back deeper into recession, rather than spending cuts, which tend to be more supportive of growth. The IMF In particular has been saying that Greece needs to cut spending, not raise taxes, yet EUR 7.3bn out of the EUR 7.9bn of measures that Greece proposed are increases in taxes and social security contributions. Such a “solution” would be unsustainable if it were actually implemented, but given the country’s dismal record in tax collection, it in fact has only a small chance of being successfully implemented. Thus there is the chance that when Tsipras meets today with ECB President Draghi, EC President Juncker and IMF Managing Director Lagarde, it’s possible that Lagarde may tell him that the proposals are unacceptable and must be revised.
•At the same time, some members of Tsipras’ SYRIZA coalition also object to the new measures as being too harsh and say that they will vote against them. The government’s narrow majority means that if only 10 SYRIZA deputies vote against the package or even abstain, the government would need the help of opposition parties to pass the measures. That would hurt its credibility and throw the government’s future into question. To make matters worse, there is talk that Finance Minister Varoufakis may leave the government. Meanwhile, thousands of pensioners Tuesday evening demonstrated in the streets of Athens against the cuts.
•Assuming though that Greece works out some compromise with the EU and Greek lawmakers do approve the measures over the weekend, Germany’s Bundestag could vote on it on June 29th or June 30th. That probably wouldn’t be soon enough for Greece to receive the last disbursement of funds in time to make the payment due to the IMF on June 30th, but the ECB would probably allow the Greek central bank to raise the money in time through T-bills. If, however, something goes wrong, then the country will miss the June 30th payment to the IMF and that’s that. While the assumption of a successful resolution to the Greek drama has turned out to be negative for the euro, failure would probably be much, much more negative.
•Oil rises after API stats apparently show large drawdown in inventories Oil prices rose sharply after the American Petroleum Institute (API) weekly statistics apparently showed an 3.2mn barrel decline in inventories in the week ended June 19th, far exceeding expectations of a 2mn barrel decline. Expectations of rising demand are replacing fears of a Greek collapse, boosting oil prices. The result was a rise in the commodity currencies – AUD, NZD, CAD and RUB – although NOK did not participate in the rally, probably because of the divergence in monetary policy there. Note though that Iran yesterday raised new objections to some of the conditions for lifting sanctions, calling into question whether the country will be able to start exporting more oil. The collapse of the Iranian talks would probably boost oil prices significantly.
•Today’s highlights: In the European evening, the Eurozone finance ministers will hold an emergency meeting in a bid to reach a final bailout deal for Greece ahead of an EU leaders’ summit the following day.
•As for indicators, we get the German Ifo survey for June. The weak ZEW indices last Tuesday increase the likelihood of soft Ifo indices as well. Even though Tuesday’s PMIs showed that business conditions had improved in June, another weak Ifo reading could add to evidence that Eurozone’s growth engine is losing steam. The final GDP figure for Q1 for France is also coming out. The final data is expected to confirm the preliminary growth figure, thus the market reaction could be limited.
•In the US, the 3rd estimate of Q1 GDP is expected to show that the US economy contracted less compared to the 2nd estimate. Even though this is the final estimate and not that big of a market mover, it could prove USD-positive, as it will show a stronger Q1 compared to what was initially estimated (-0.2% qoq SAAR vs -0.7% qoq SAAR). Along with expectations of a rebound in Q2, this will keep the September rate hike scenario alive. We believe that if the economic outlook continues to improve in the next months and the momentum picks up, the first rate hike could occur in September and the USD could regain its strength. The 3rd estimate of the core personal consumption index, the Fed’s favorite inflation measure, is also coming out.
•As for the speakers, ECB Vice President Vitor Constancio speaks.
The Market
EUR/USD falls below 1.1200
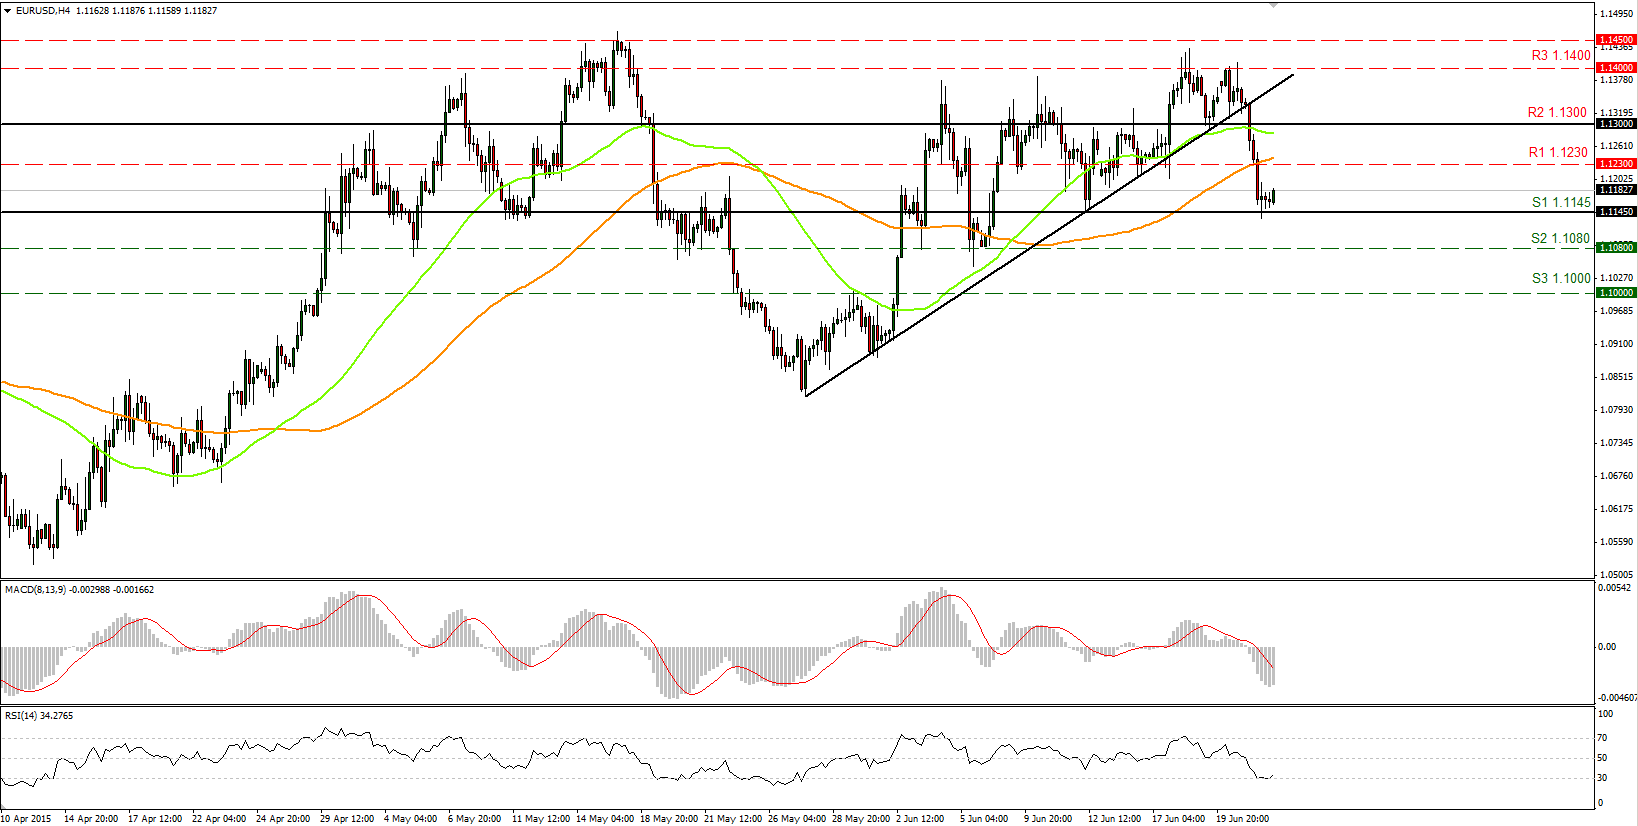
• EUR/USD fell sharply on Tuesday, breaking below the round number of 1.1200. The decline was halted near our 1.1145 (S1) support zone. Since the rate remains trapped in a range between the 1.1300 (R2) resistance line and the 1.1145 (S1) support, I view the price as moving within a sideways path. A break in either direction is likely to determine the forthcoming short-term bias. Given the inability of the bears to push the rate below that key support, I would expect the pair to bounce up a bit, at least for a test of 1.1230 (R1). This notion is supported by our momentum indicators. The RSI found support at its 30 line and rebounded somewhat, while the MACD, although still below zero, has bottomed and points up. A break of that hurdle could see scope for further advances towards the 1.1300 (R2) resistance line. In the bigger picture, I would like to remain neutral and wait for a break below the 1.1080 (S3) area to carry larger bearish implications or a move above the psychological zone of 1.1500 (R2) for further bullish extensions.
• Support: 1.1145 (S1), 1.1080 (S2), 1.1000 (S3)
• Resistance: 1.1230 (R1) 1.1300 (R2), 1.1400 (R3)
GBP/USD founds support just above 1.5700
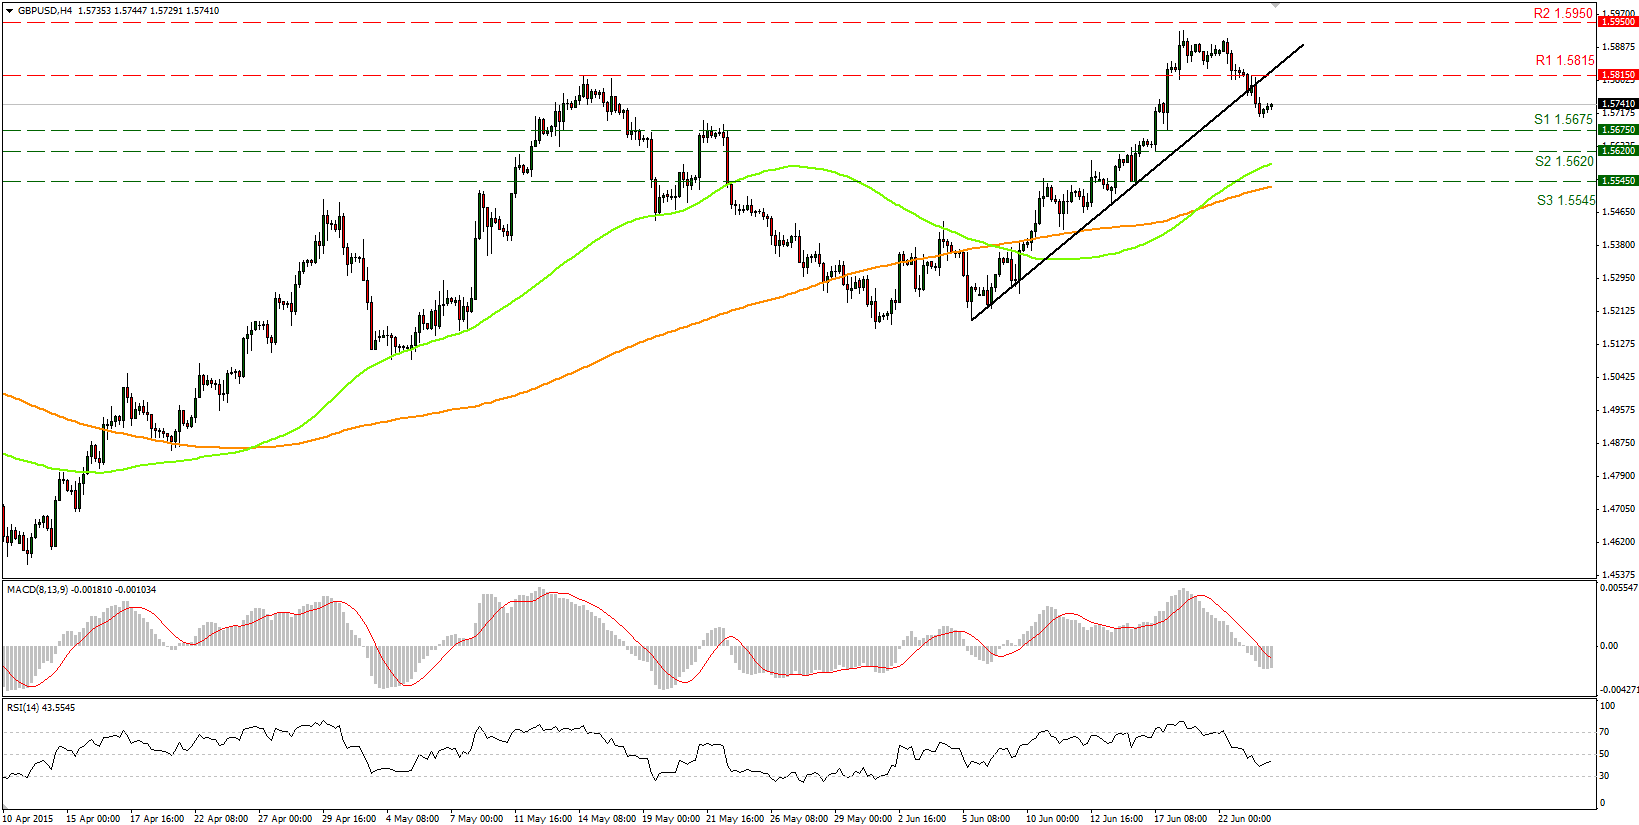
• GBP/USD broke below the black uptrend line on Tuesday and declined to find some buy orders around 1.5700. I would expect the decline to continue at least towards our 1.5675 (S1) support zone. A break below that line could trigger further declines, perhaps towards our next support of 1.5620 (S2). Looking at our momentum indicators, however, further declines may not be immediate. The RSI found support slightly above 30 and points up, while the MACD has bottomed and seems willing to cross its trigger line. Therefore, we could see a minor bounce before the next leg lower. On the daily chart, I see that after rebounding from the 50% retracement level of the 14th of April - 15th of May up leg, GBP/USD moved back above the 80-day exponential moving average. In my view, the move above 1.5800 on the 17th of June confirmed that the overall picture has turned positive.
• Support: 1.5675 (S1), 1.5620 (S2), 1.5545 (S3)
• Resistance: 1.5815 (R1) 1.5950 (R2), 1.6000 (R3)
USD/JPY test 123.80 as a support this time
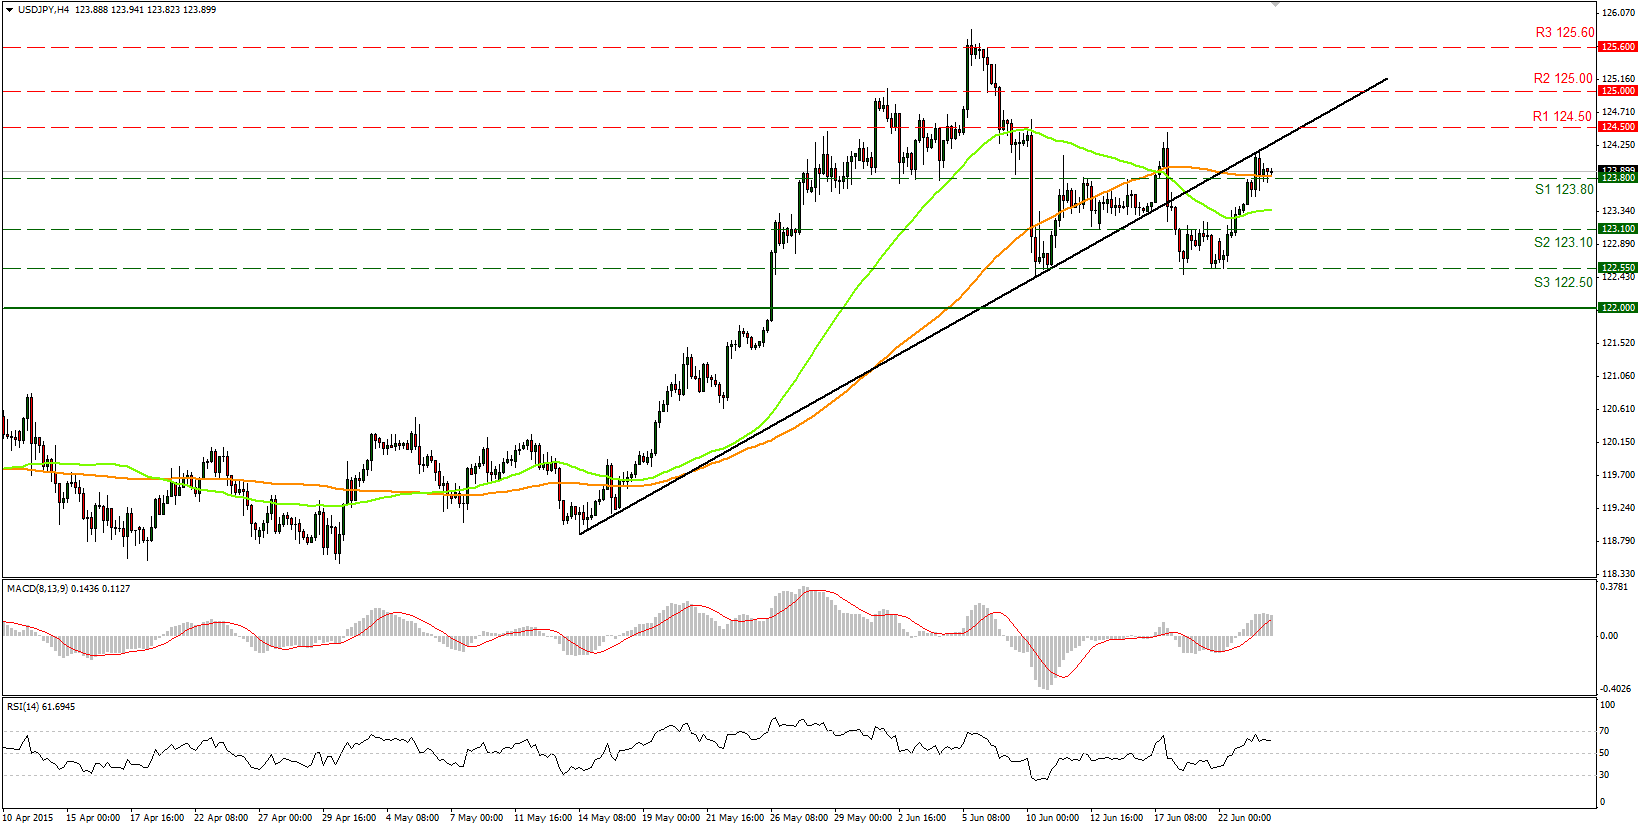
• USD/JPY moved higher on Tuesday, breaking above the resistance-turned-into-support line of 123.80 (S1). The advance was halted, however, at the black uptrend line and the pair declined a bit to test the 123.80 (S1) zone. If the bulls manage to take the price above that trend line, I would expect them to challenge our 124.50 (R1) resistance level. Given our momentum indicators, however, we will have to wait and see whether the bulls are strong enough to start a new attempt to take the price higher. The RSI lies just below its 70 line and is pointing sideways, while the MACD stands above its zero and trigger lines and is also pointing sideways. This amplifies the case to see a break above the uptrend line and further advances. On the daily chart, the break above the 122.00 zone on the 26th of May triggered the continuation of the long-term upside path.
• Support: 123.10 (S1), 122.50 (S2), 122.00 (S3)
• Resistance: 123.80 (R1), 124.50 (R2), 125.00 (R3)
DAX above the psychological level of 11500
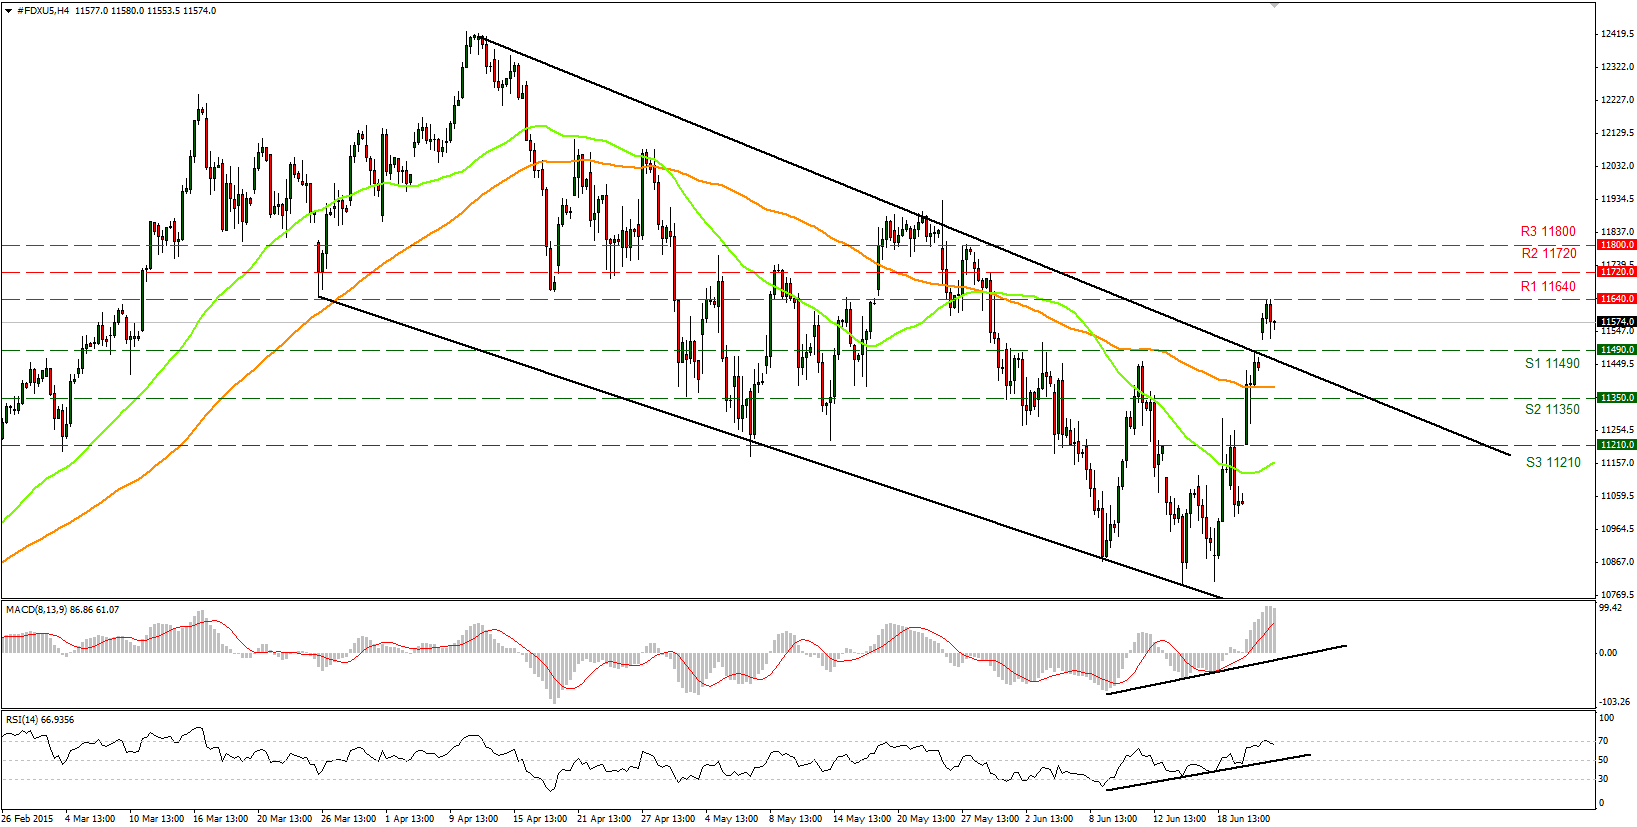
• DAX futures gapped up on Tuesday, breaking above the psychological figure of 11500 and the upper boundary of the downslope channel. The advance was halted at the 11640 (R1) resistance line. A break above that level is needed for the index to see scope for further bullish extensions. Even though our short-term oscillators reveal upside speed and amplify the case that DAX could trade higher in the near future, a minor correction towards the 11490 (S1) zone cannot be ruled out. In the bigger picture, I would need a decisive break above 11640 (R1) to switch the medium-term bias to the upside again.
• Support: 11350 (S1), 11210 (S2), 11070 (S3)
• Resistance: 11500 (R1) 11600 (R2), 11720 (R3)
WTI surged above 60
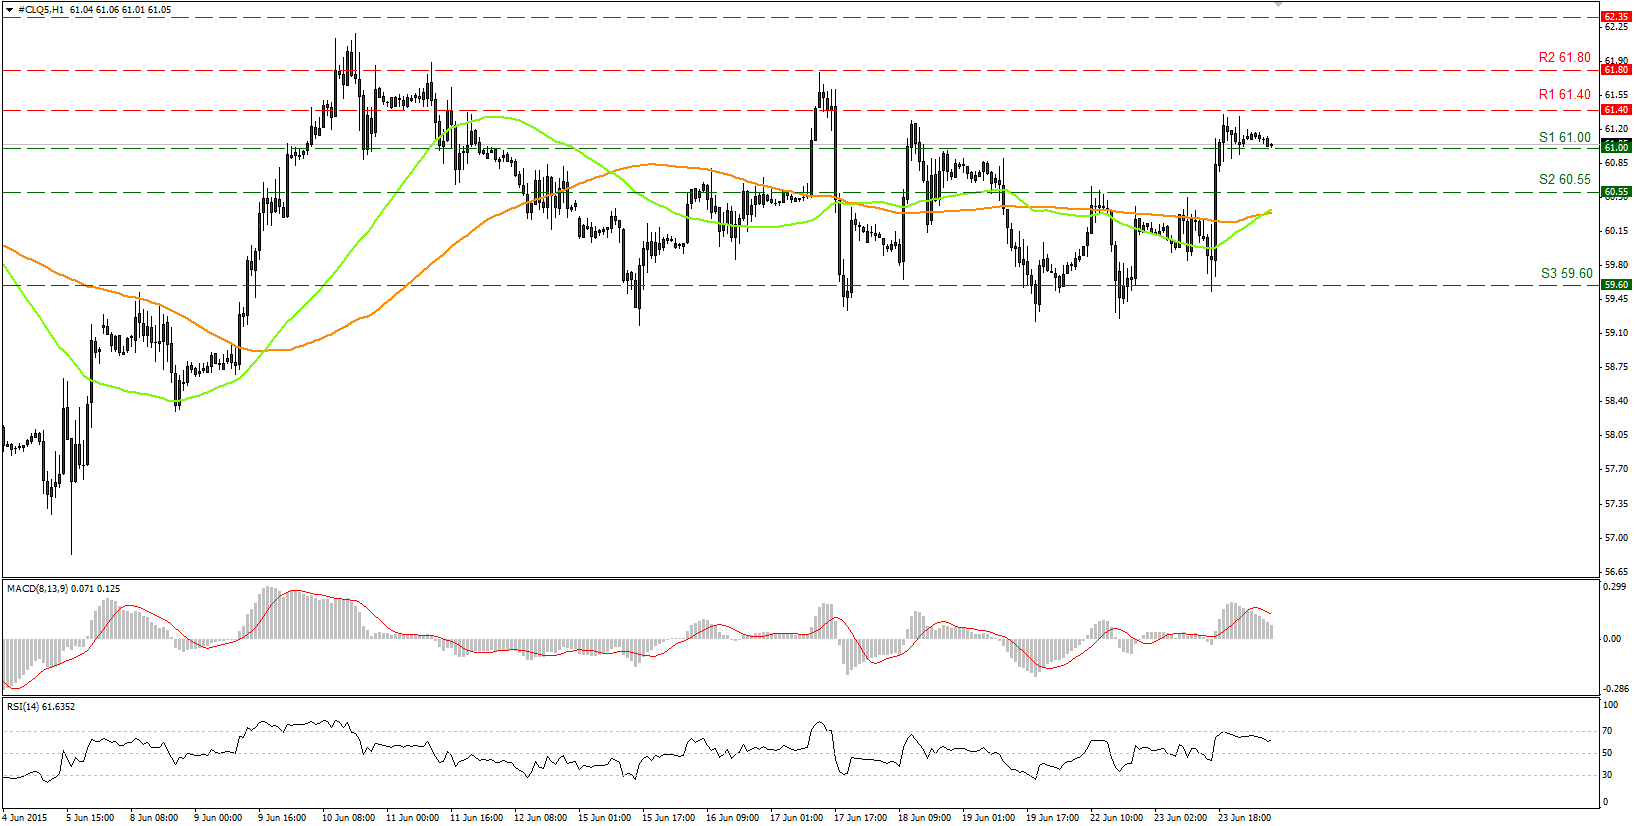
• WTI surged on Tuesday, breaking two resistance lines in a row. The move was halted at our 61.40 (R1) resistance line and today, during the early European morning Wednesday, WTI is testing the 61.00 (S1) level as a support this time. A break below that level could push the rate even lower, perhaps towards our next support of 60.55 (S2). Our technical studies support the decline. The RSI found resistance at its 70 line and is pointing down, while the MACD has topped, crossed below its trigger line and moves towards zero. As for the broader trend, the break above 55.00 on the 14th of April signaled the completion of a double bottom formation, something that could carry larger bullish implications in the not-too-distant future. However, WTI has been trading in a sideways mode since the 6th of May, with both momentum indicators near their equilibrium lines pointing sideways.
• Support: 61.00 (S1), 60.55 (S2), 59.60 (S3)
• Resistance: 61.40 (R1), 61.80 (R2), 62.35 (R3)

