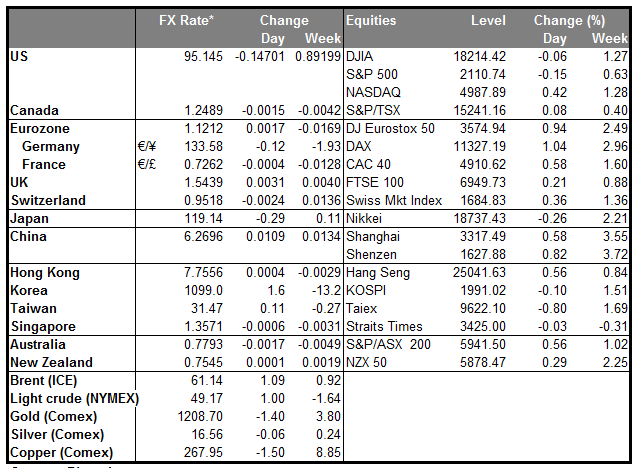
After several weak days following Fed Chair Janet Yellen’s testimony to Congress, the dollar turned around yesterday and gained against all the other G10 currencies and most of the EM currencies that we track. It started strengthening after St. Louis Fed President James Bullard said the Fed should remove “patient” from its statement in March. The dollar gained even more after the core US CPI rate for January came out higher than expected at the same pace as in December (+0.2% mom, +1.6% yoy) suggesting that indeed low energy prices are the main reason behind the slowdown in inflation, as Yellen argued in her testimony. Moreover, the slight deflation in the headline CPI boosted real average earnings, which rose a solid 1.2% mom, which bolsters the Fed’s case that the labor market is improving. Fed funds rate expectations rose 5 bps in the long end and U.S. 10-Year yields rose about 10 bps from the lows to once again top 2.0%.
The euro moved lower and many euro bears, who had pared risk and were waiting for the signal to jump back in, decided that the time was right to re-establish their short euro positions. Market participants have probably noticed that the recent pattern is that when the euro falls sharply, it does not recover to its previous level, so they probably figure it’s best to get in at the top of the move rather than waiting for the bounce.
Eurozone economic news yesterday was favourable, with the number of unemployed persons in Germany falling more than expected, consistent with the rise in consumer confidence also reported. Also bank lending, which bottomed out in August, continued to grow modestly. But EUR/USD has not been that responsive to European economic news recently, particularly news about growth, probably because there’s no indication that faster growth will translate into higher inflation and thereby influence ECB policy.
Meanwhile, the fact that Bund yields are now negative out to seven years is probably discouraging investment in European bonds. Portuguese yields are below Treasuries out to 10 years! It’s likely that there is some measure of capital flight from Europe as real money bond investors are probably not comfortable at such levels. Equities are another matter, with the Eurostoxx 50 up 13.6% so far this year in local currency terms (5.3% in USD terms) and the S&P 500 up only 2.5%. However I would expect that most of these flows would be currency hedged, for obvious reasons.
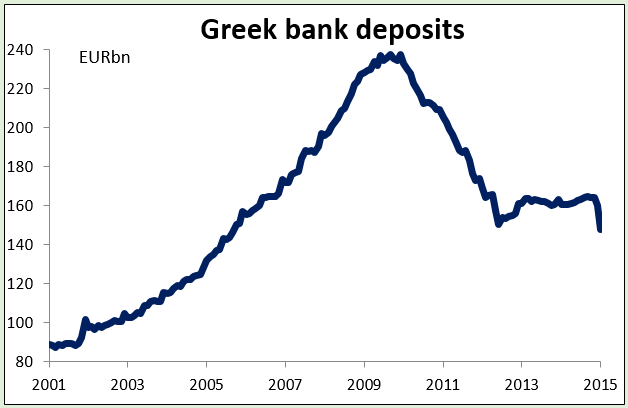
Greece confirms reports of capital flight The monthly data on bank deposits from Greece confirms the rumors of capital flight during the recent debt negotiations. Private sector bank deposits fell EUR 12.3bn or 7.7% during the month, a record either way you look at it. This demonstrates why a “Grexit” would be so difficult for the Eurozone as a whole. If Greece did leave, we’d probably see a similar response by savers in other troubled countries, which could spell disaster for the European banking system.
Crude oil fell sharply on a report in the Wall Street Journal that Iran and the six major powers were nearing an accord over Iran’s nuclear efforts. That would allow some 700k bbl/d of oil into the market, adding to the already-huge glut of oil. However, US Senate Foreign Relations Committee Chairman Bob Corker said he would introduce legislation giving Congress the power to review any nuclear deal with Iran. This makes it much less likely that any deal would get US approval. That doesn’t mean I'm bullish on oil, but there could be somewhat of a bounce today. The technical say the same thing (see below).
Japan’s data shows some recovery The usual end-of-month data deluge from Japan showed that output is recovering, but not because of domestic demand. Industrial production was up a faster-than-expected 4.0% mom, the biggest jump in four years, but retail sales were down a greater-than-expected 1.3% mom and household spending fell. This combination is likely to convince the authorities that export demand is essential and help to keep them firmly in the weak-yen camp, contrary to recent comments (ahead of the elections in April) that they are concerned about the impact of the weak yen on consumers. Meanwhile, the inflation rate was largely unchanged, meaning no immediate reason for the BoJ to get more concerned (or less concerned, either).
Today’s highlights: During the European day, German CPI for February is coming out, after several regional states release their data in the course of the morning. As usual, we will look at the larger regions for a guidance on where the headline figure may come in. Spain and Italy’s inflation rates are also coming out; both are expected to remain in deflation.
In Sweden, Q4 GDP is expected to show an expansion from Q3, which could strengthen SEK a bit.
In Norway, the official unemployment rate for February is coming out.
In the US, the 2nd estimate of Q4 GDP is expected to be revised lower. The 2nd estimate of the core personal consumption index, the Fed’s favorite inflation measure, is forecast to confirm the initial estimate. The Chicago Purchasing managers’ index and the final University of Michigan consumer sentiment for February are coming out. Pending home sales for January are expected to rise, a turnaround from the previous month. The decline in existing home sales on Monday suggest that pending home sales could miss expectations.
As for the speakers: Fed Vice Chairman Stanley Fischer, New York Fed President William Dudley, Cleveland Fed President Loretta Mester, ECB Vice President Vitor Constancio and Bank of Japan Deputy Governor Hiroshi Nakaso participate in the US Monetary Policy Forum.
The Market
EUR/USD plunges below 1.1260
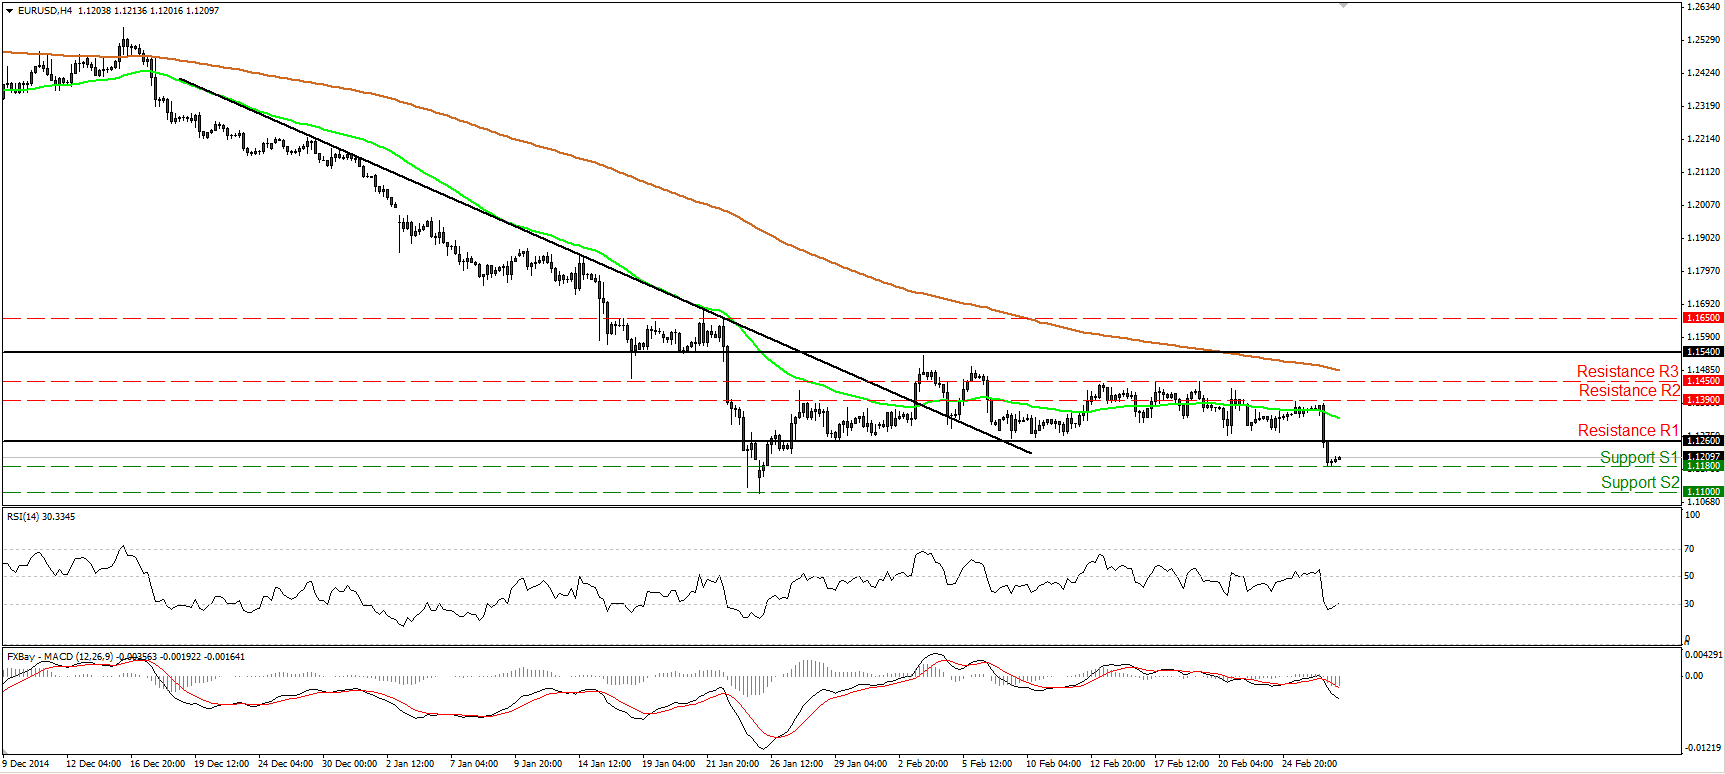
EUR/USD plunged on Thursday after the core CPI rose by more than anticipated in January, proving that the dip of the headline rate into negative territory is mainly due to lower oil prices. The rate fell below the key support line (turned to resistance) of 1.1260 (R1), which shifts the bias back to the downside in my view and could open the way for another test of 1.1100 (S2), defined by the low of the 26th of January. Nevertheless, in today’s agenda we have the 2nd estimate of the US GDP for Q4, which is expected to show a lower rate of economic expansion than the initial forecast. This could cause a minor bounce, perhaps for a test around 1.1260 (R1), as a resistance this time. The RSI gives me an extra reason to be careful about such a bounce. The indicator exited its oversold territory and is now pointing north. With regards to the broader trend I believe that the pair is still in a downtrend. EUR/USD is printing lower peaks and lower troughs below both the 50- and the 200-day moving averages. A break below the 1.1100 (S2) line in the future could challenge our next support at 1.1025 (S3), defined by the high of the 1st of September 2003.
• Support: 1.1180 (S1), 1.1100 (S2), 1.1025 (S3).
• Resistance: 1.1260 (R1), 1.1390 (R2), 1.1450 (R3).
AUD/USD tumbles after finding resistance around 0.7900
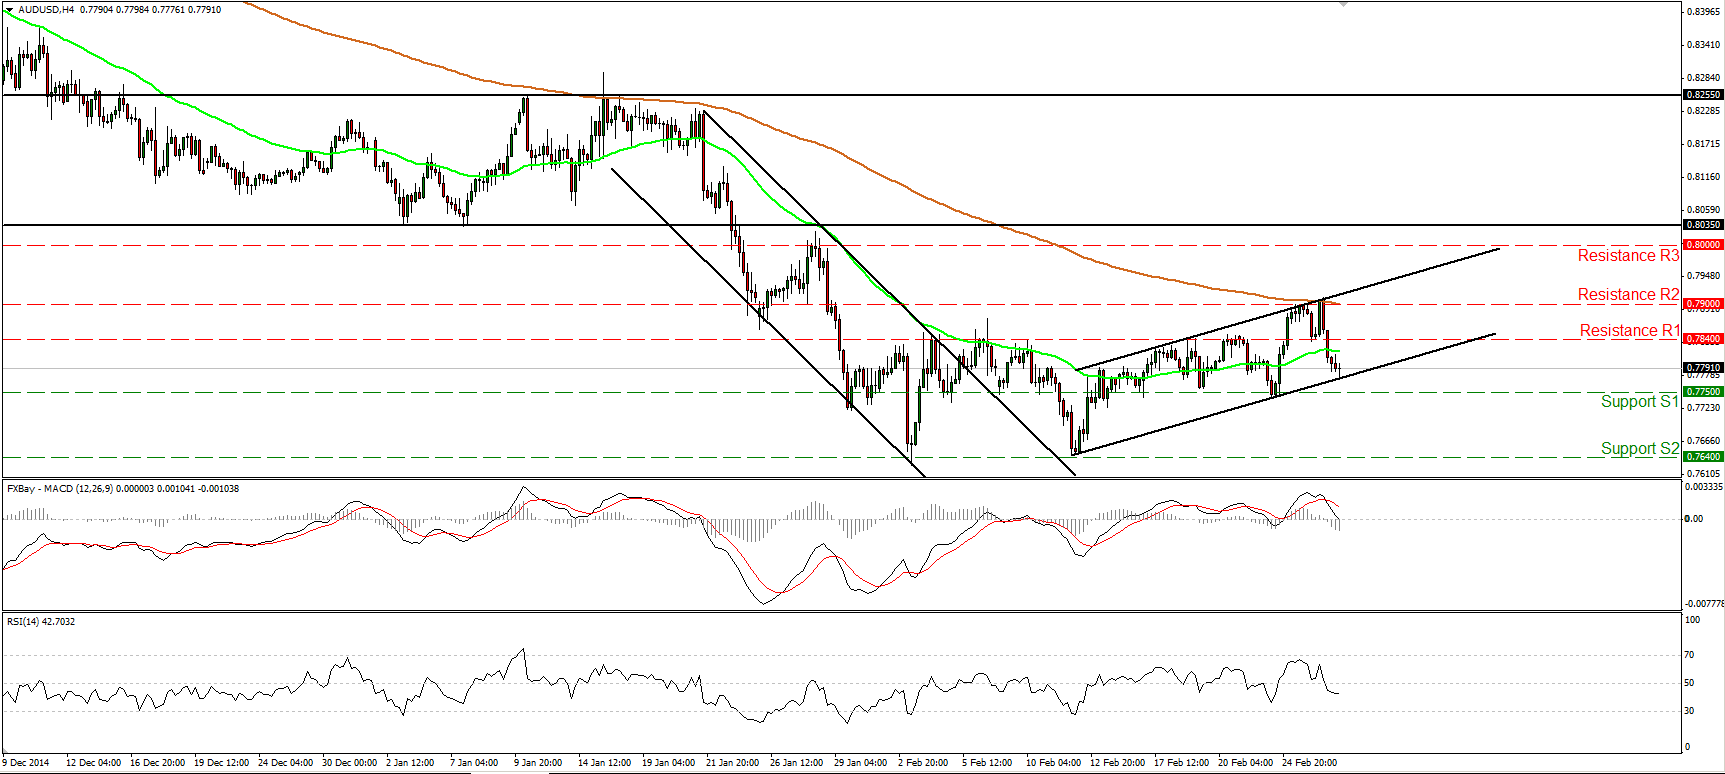
AUD/USD slid after hitting resistance fractionally above the 0.7900 (R2), but the decline was halted by the lower bound of the short-term black upside channel. Zooming to the 1-hour chart, I see that the 14-hour RSI edged higher after exiting its oversold field, while the hourly MACD has bottomed and appears ready to cross above its signal line soon. Taking these momentum signs into account, and given also our proximity to the lower bound of the channel, I would be careful that the forthcoming wave could be to the upside. However, considering the overall picture of the pair, I would not bet on that. On the daily chart, the break below the psychological round number of 0.8000 (R3) back on the 21st of January signalled the continuation of the longer-term downtrend. Therefore I would treat the recent recovery from 0.7640 (S2) as a corrective move and I would expect the bears to take the reins sooner or later. I still believe that we are going to see AUD/USD challenging the 0.7500 (S3) territory in the future.
• Support: 0.7750 (S1), 0.7640 (S2), 0.7500 (S3).
• Resistance: 0.7840 (R1), 0.7900 (R2), 0.8000 (R3).
EUR/JPY breaks below 133.80
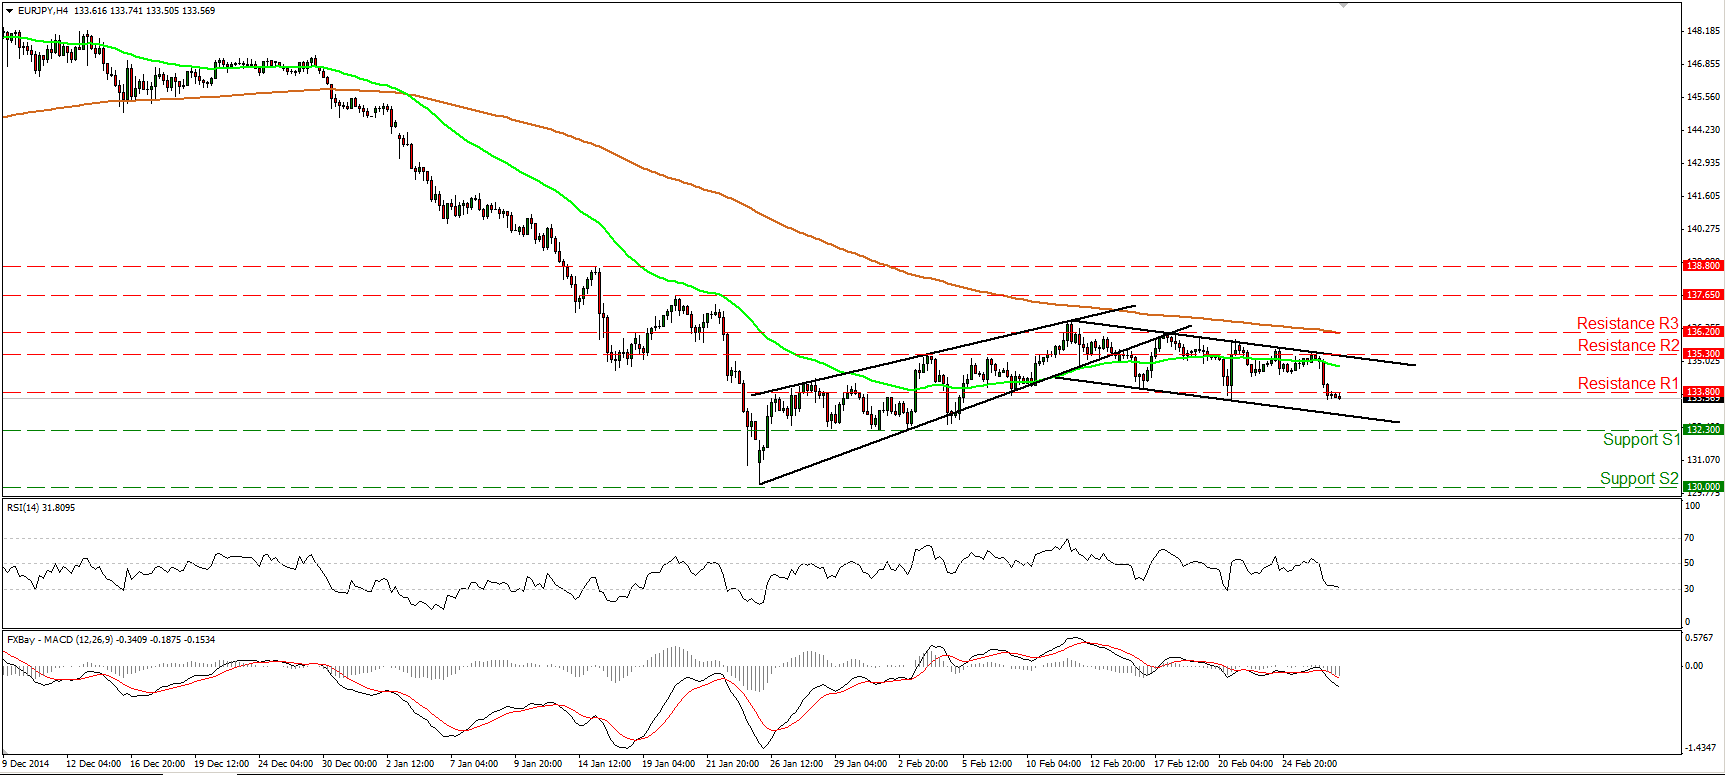
EUR/JPY slide yesterday, reaching and breaking below support turned into resistance obstacle of 133.80 (R1). I would now expect sellers to pull the trigger for the 132.30 (S1) support zone. Our short-term oscillators detect negative momentum and magnify the case for the continuation of the down wave. The RSI slid towards its 30 line and could move below it in the close future, while the MACD stands below both its zero and trigger lines, pointing south. On the daily chart, we see that the strong recovery from 130.00 (S2) remained limited near the 38.2% retracement level of the 29th of December – 26th of January plunge. The recent decline supports my view to treat the aforementioned recovery as a corrective phase of the larger downtrend.
• Support: 132.30 (S1), 130.00 (S2), 129.25 (S3).
• Resistance: 133.80 (R1), 135.30 (R2), 136.20 (R3).
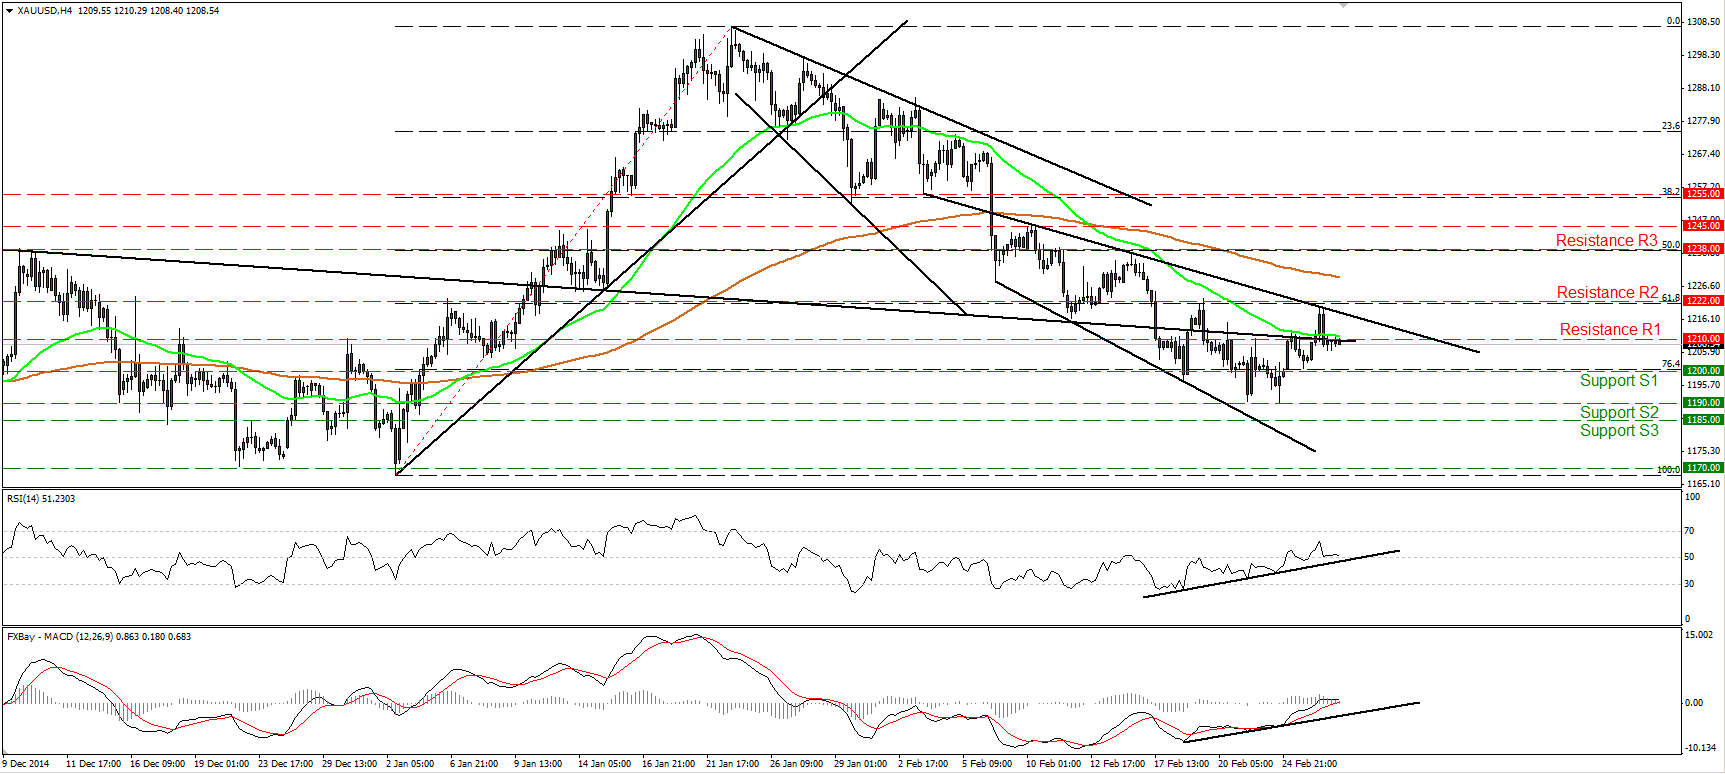
Gold hits resistance near 1222
Gold moved higher yesterday, but after hitting resistance at the upper bound of a broadening formation, fractionally below the 1222 (R2) hurdle, it tumbled to trade back below the 1210 (R1) line. The picture is still negative in my view and I would expect the bears to eventually pull the trigger for larger declines. But given that there is still positive divergence between both our short-term oscillators and the price action, I would prefer to wait for momentum and price action to confirm each other before getting again confident on the down path. On the daily chart, gold stays below the neckline of the inverted head and shoulders completed on the 12th of January. This supports the negative outlook and strengthens the likelihood for further declines in the not-too-distant future.
• Support: 1200 (S1), 1190 (S2), 1185 (S3).
• Resistance: 1210 (R1), 1222 (R2), 1238 (R3).
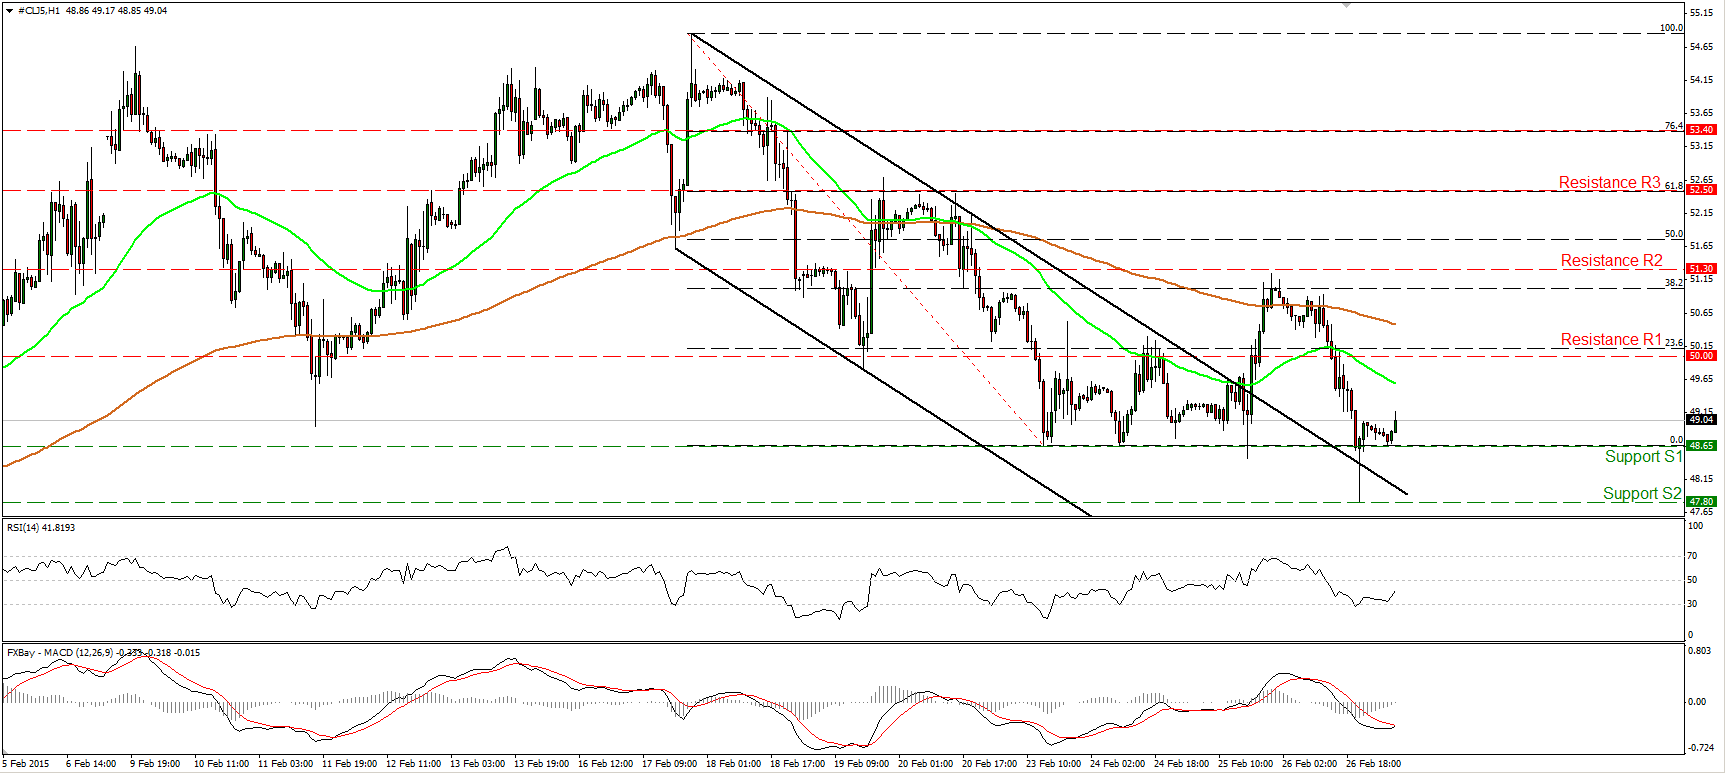
WTI erases Wednesday’s gains
WTI fell back below the round figure of 50.00 (R1) on Thursday. The price is now trading slightly above the key support barrier of 48.65 (S1) and looks ready to rebound. Our short-term oscillators corroborate that view. The RSI hit support near its 30 line and turned up, while the MACD has bottomed and appears ready to move above its trigger line any time soon. I would expect such a rebound to test once more the 50.00 (R1) zone. On the daily chart, WTI is still trading below both the 50- and the 200-day moving averages, keeping the longer-term downtrend intact. I would treat any possible near-term upside extensions as a corrective move before the bears pull the trigger again.
• Support: 48.65 (S1), 47.80 (S2), 46.65 (S3).
• Resistance: 50.00 (R1) 51.30 (R2), 52.50 (R3) .

