•Mixed NFP brings no further clarity Friday’s much-awaited nonfarm payrolls (NFP) were expected to settle the question of whether the Fed would hike in September, but in the event they were neither good enough to guarantee that the Fed would move nor bad enough to rule out a hike. The headline figure disappointed at only 173k (expected: 215k), but the unemployment rate fell further than expected (including the U6 measure, the Fed’s favorite measure of underemployment), average working week rose, and average hourly earnings continued to rise at the same annual pace as before. Net net, the Fed funds rate expectations were unchanged out to July 2016, meaning that the market thought the figures had little implication for near-term monetary policy. The confusion in the FX market can easily be seen by looking at a minute-by-minute chart: the high of the day for EUR/USD, 1.1189, was set at exactly 8:30 AM New York time, when the NFP headline hit the wires, while the low for the day, 1.1090, was set two minutes later at 8:32 after traders had had a chance to digest the rest of the numbers. EUR/USD bounced somewhat off the lows but stayed below the level prevalent before the figure came out.
• The figures create a dilemma for the Fed The new forecasts that will be presented at the September meeting are likely to revise growth up and revise unemployment down. That means the economy is doing better than they had expected back in June. In that case, what do they do with the dots? In particular, what do they do with the 2015 dot and the graph of the appropriate timing of policy firming, given that there will only be two more meetings in 2015? I would expect them to revise down their forecasts for interest rates further out, in 2016, 2017 and the long run, because lower oil and commodity prices will help keep inflation low. But keeping rates unchanged while the economy is now turning out even better than they expected would require some explanation.
• That explanation would have probably to do with market turmoil. Although stabilizing financial markets is not among the Fed’s mandate, the Committee does seem to take such factors into account. Looking back to 1990, the highest the VIX was at the time of a Fed rate hike was 25.4 , it’s now 27.8. The VXO index, a VIX-type index on the S&P 100, goes back to 1986; the highest that’s been when the Fed hiked was 28.8, while the index today is at 28.04. In other words, market volatility is also at the point where it may become a salient factor in the Committee’s thinking.
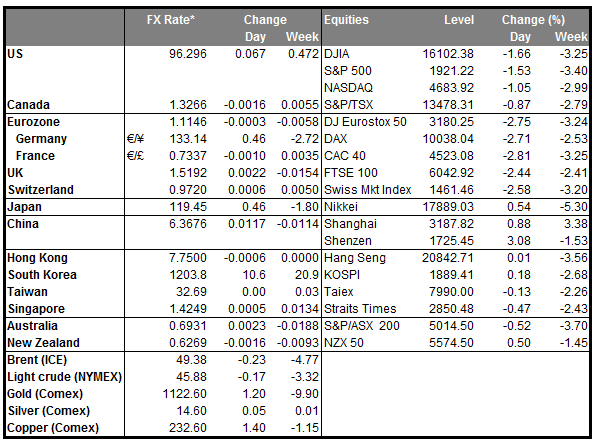
• Stocks and commodities were the big losers Friday, may recover today The biggest losers Friday were the stock market, which closed down about 1.5%, and commodity prices, with both copper and oil down sharply. This probably had less to do with the NFP than with just a general retreat from risk ahead of the long US weekend and with questions about how China would reopen today. That probably explains why the longer-dated Fed fund rate expectations declined. However, I would expect to see a reversal in risk appetite today as Chinese stocks are re-opening higher, following some reassuring words from Chinese officials at the G20 meeting about how China is committed to continuing structural reforms and to supporting economic growth. That could mean some recovery today for the AUD and NZD as well as commodity prices, while it would tend to be negative for the euro, which is used as a funding currency.
• On Monday, we have a very light calendar. Germany and Norway release their industrial production for July, but neither is usually a major market mover. US markets are closed for the Labor Day holiday.
• On Tuesday, we get China’s trade balance for July. The country’s trade surplus is expected to rise, but that’s only because imports are expected to fall at a faster pace than exports – still a negative factor for AUD, NZD and commodity-based EM currencies. Meanwhile, the fall in exports is another sign of the slowdown in global trade that’s hurting the other EM countries.
• Japan’s final estimate of Q2 GDP will also be released. It’s expected to be revised down to -1.8% qoq SAAR from the initial -1.6%. Having in mind China’s economic slowdown and its impact over the globe, I see little chance of a positive surprise here. The confirmation of the contraction in Q2 increases the chances that the BoJ will take further stimulus measures in order to meet its targets when it reviews its long-term projections in October. The nation’s current account balance for July is also coming out.
• During the European day, Eurozone’s final Q2 GDP is forecast to confirm the preliminary estimate and show that Euro-area’s economy expanded by only 0.3% qoq.
• In the US, we get the labor market conditions index for August. This is a monthly index that draws on a range of data to produce a single measure to gauge whether the labor market is on the whole improving. Although not major market mover, the LMCI index will show the broader US labor conditions following the US employment report to be released today.
• The NFIB small business optimism index for the same month is also due out. This indicator is worth watching because of the Fed’s emphasis on employment, as small businesses employ the majority of people in the US. With less than two weeks to go before the September FOMC meeting, I believe that these two indicators will attract more attention than usual as they could affect expectations of a September rate lift-off.
• On Wednesday, the main event will be the Bank of Canada rate decision. At its last meeting on July 15th, the Bank reduced its growth forecasts sharply and cut rates by 25bps. It also left the door open for further rate cuts as it said that the depressed outlook for Canada’s growth has increased the downside risks to inflation. Although Canada’s CPI accelerated in July, Canadian oil prices are 11% lower than where they were back then and lumber prices are down 19%. We don’t expect any action at this meeting, but we expect the Bank to reiterate its dovish stance and keep alive the scenario for further cuts in the foreseeable future. That could weaken CAD. Canada’s housing starts for August and building permits for July are also coming out.
• From the UK, we get industrial production for July. The manufacturing PMI increased somewhat in July, but both the construction and service-sector indices declined, driving the composite PMI lower. Industrial production was down 0.4% mom in June. Therefore, the PMI prints for July increase the likelihood for another slump. The UK trade balance for July is also coming out.
• In the US, the Job Opening and Labor Turnover Survey (JOLTS) report for July is due out. This survey will also bring the quit rate, a closely watched indicator of how strong the job market is.
• The 23rd of July was the second consecutive time the RBNZ cut its interest rates. They also said that “some further easing seems likely." Since then, business confidence has fallen, unemployment has risen, producer prices remain in deflation and the trade deficit has widened – although at the same time dairy prices rose and the terms of trade improved. Nonetheless, inflationary pressures remain weak, with the CPI rising only by 0.3% yoy in Q2, well below the Bank’s target range of 1%-3%. What is more, the country’s growth faces risks related to the fall in the prices of the key commodities it exports. Therefore, we expect another 25bps rate cut at this meeting on the back of muted inflation and policy makers’ preference for a weaker NZD.
• On the other hand, the Bank of England is once again expected to remain on hold, as it has been since March 2009. But now the minutes of the meeting are released at the same time as the meeting, which makes meeting days more exciting than before. The number of the dissenting votes is the key point. At the last meeting on the 6th of August, sterling suffered as only Ian McCafferty voted for a rate hike. This surprised the market as most observers were expecting the formerly hawkish Martin Weale to join him in voting to raise rates. Furthermore, the Inflation report said the Bank expects inflation to pick up a bit more slowly than previously thought, because of the recent slump in oil prices. Although BoE Governor Carney recently stated that China’s turmoil will not affect the Bank’s plans, we believe it’ll be hard for any other members to join McCafferty at this meeting. Personally, I wouldn’t be surprised even if he steps back. We could therefore see GBP weaken after the meeting.
• As for the indicators, China’s CPI and PPI data for August are coming out. The forecast is for the CPI rate to rise to +1.9% yoy from +1.6% yoy, while the PPI rate is expected to fall at a faster pace than the previous month. The recent Chinese chaos and the plunge in the globe’s equity markets reflects investors’ concerns over the country’s growth prospects. As the country’s growth continues to slow and the demand for commodities decline, Australia and New Zealand, whose economies heavily depend on exports to China, could see their currencies weaken further. Australia’s unemployment rate for August is also to be released.
The Market
EUR/USD fell following the strong US jobs report
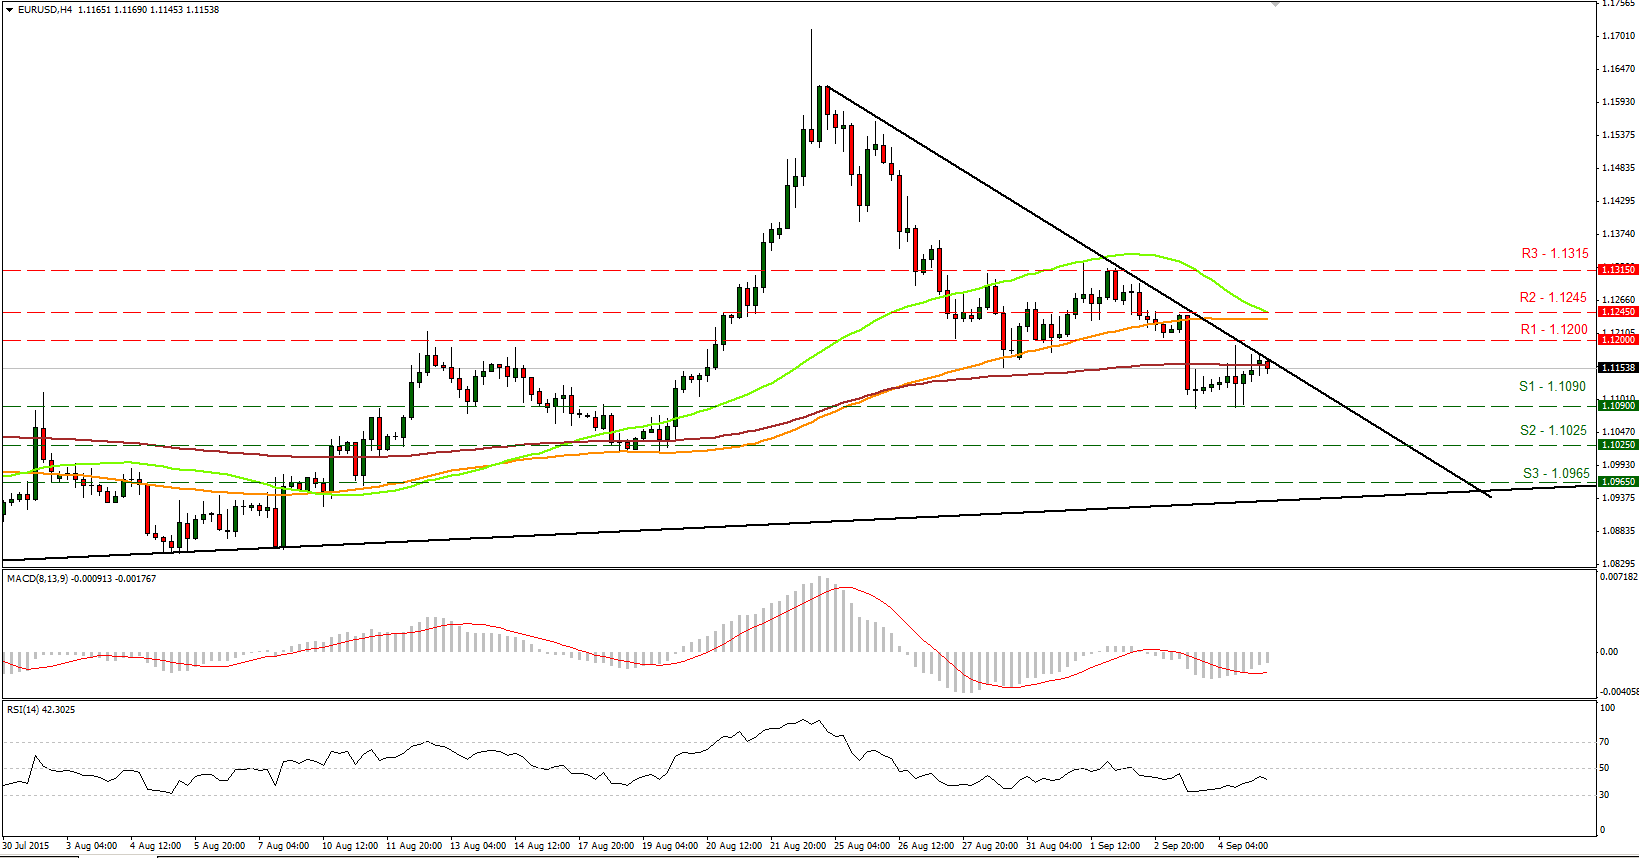
• EUR/USD plunged on Friday following the strong US jobs report, to find support near 1.1090 (S1). The pair moved somewhat higher during the early European morning Monday, but is still trading below the black downtrend line. As such, I would still see a negative short-term picture. I believe that a break below 1.1090 (S1) would extend the near-term downtrend and perhaps open the way for the 1.1025 (S2) zone. Looking at our short-term oscillators, however, we may see the rate trading higher for a while, but I would treat any possible near-term advances as a corrective move. The MACD has crossed above its trigger line and is pointing up, while the RSI rebounded from slightly above its 30 line, raising concerns that a minor corrective bounce could be looming before the next negative leg.
• As for the broader trend, given that on the 26th of August EUR/USD fell back below 1.1500, I would hold my neutral stance. The move below that psychological hurdle confirmed that the surge on the 24th of the month was a false break out. Therefore, I would like to see another move above 1.1500 before assuming that the overall outlook is back positive. On the downside, a break below the 1.0800 hurdle is the move that could shift the picture to negative.
• Support: 1.1090 (S1), 1.1025 (S2), 1.0965 (S3)
• Resistance: 1.1200 (R1), 1.1245 (R2), 1.1315 (R3)
USD/JPY stays below 119.65
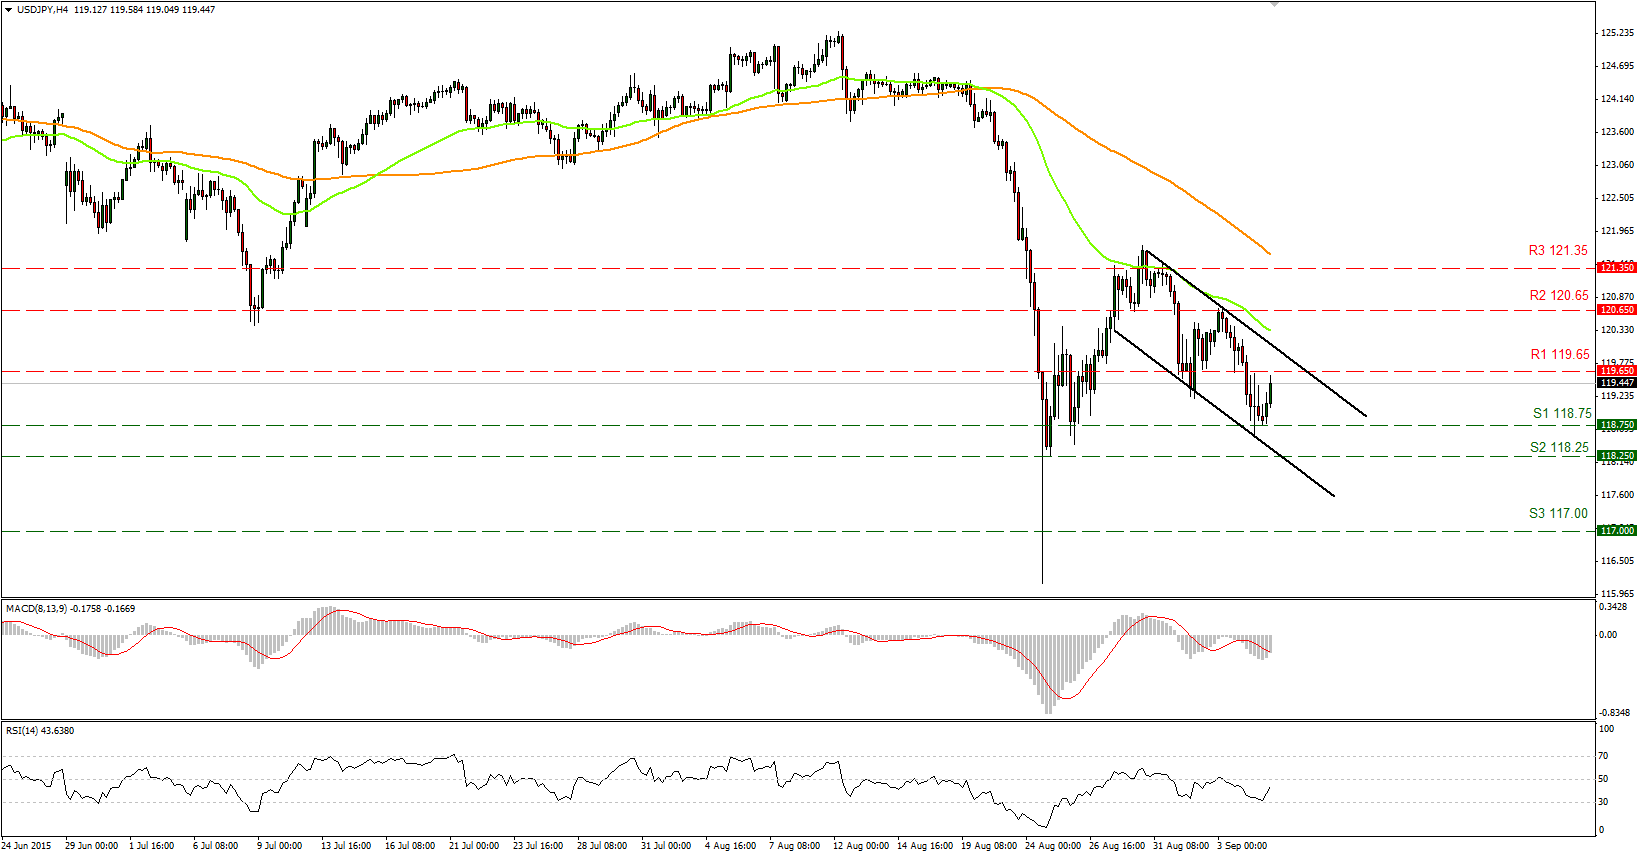
• USD/JPY stayed below our 119.65 (R1) resistance line despite the strong US employment report on Friday. As long as the rate is trading within the downside channel that has been containing the price action since the 28th of August, I would consider the short-term trend to be negative. I would expect the failure to move above 119.65 (R1) to aim once again for the 118.75 (S1) support line. A break below that line could see scope for extensions towards 118.25 (S2). As for the broader trend, the plunge on the 24th of August signaled the completion of a possible double top formation, which probably shifted the medium-term picture negative.
• Support: 118.75 (S1), 118.25 (S2), 117.00 (S3)
• Resistance: 119.65 (R1), 120.65 (R2), 121.35 (R3)
GBP/USD found some buy orders near 1.5165
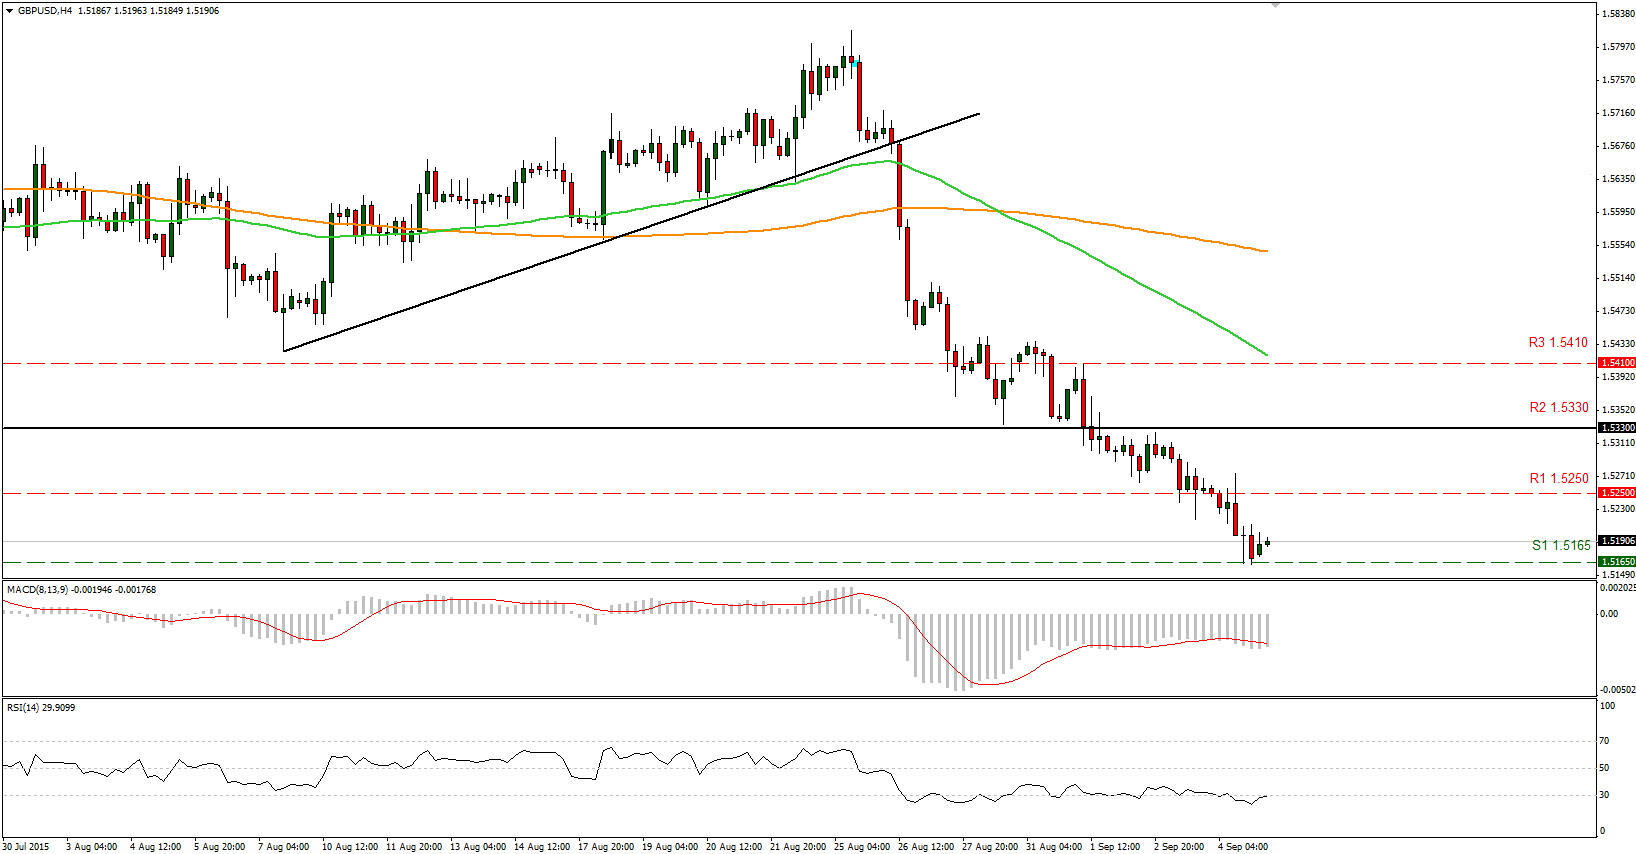
• GBP/USD continued to tumble but the pair found some buy orders near the 1.5165 (S1) support line. The price structure on the 4-hour chart still suggests a downtrend, therefore I would expect the negative move to continue and perhaps challenge the 1.5090 (S2) support zone. Our short-term momentum indicators support the notion as well. The RSI found resistance at its 30 line, while the MACD, already negative, looks ready to move below its signal line again.
• As for the bigger picture, the collapse on the 26th of August brought the rate back below the 80-day exponential moving average. What is more, the move below 1.5330 confirmed a forthcoming lower low on the daily chart, which shifts the overall outlook cautiously to the downside, in my view.
• Support: 1.5165 (S1), 1.5090 (S2), 1.5000 (S3)
• Resistance: 1.5250 (R1), 1.5330 (R2), 1.5410 (R3)
WTI found support at the uptrend line
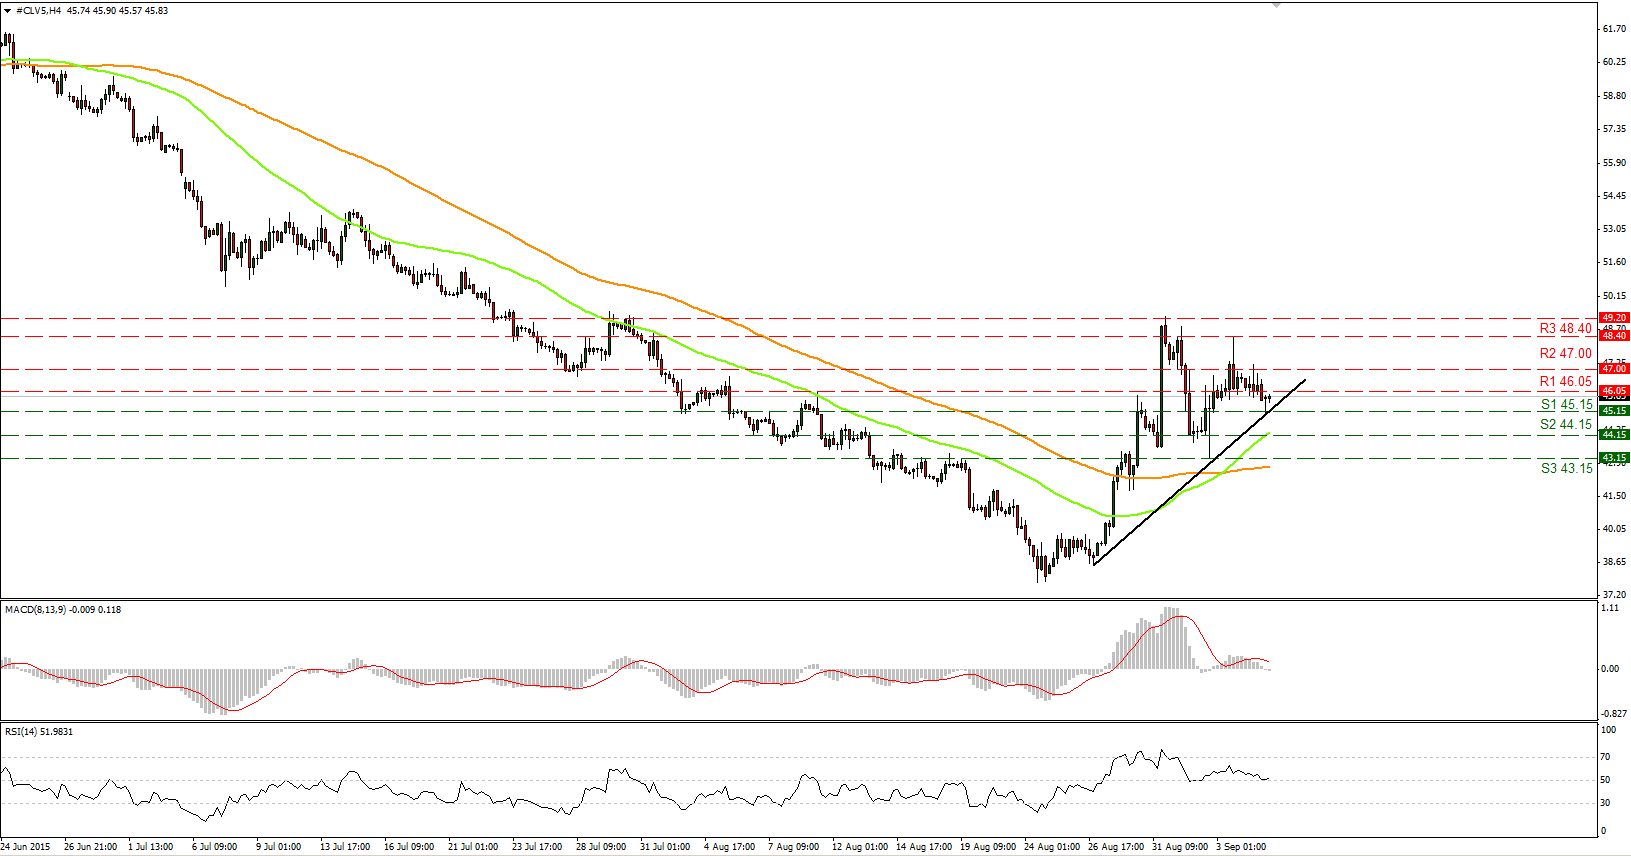
• WTI traded lower on Friday, but found support at the crossroad of the 45.15 (S1) support line and the uptrend line taken from the low of the 26th of August. Since the price is still above that line, I would see a cautiously positive short-term picture. A break above the 46.05 (R1) resistance zone is needed to extend the advance, perhaps towards the 47.00 (R2) level. Our short-term momentum studies show a neutral bias with both indicators near their equilibrium levels pointing sideways. Therefore, I would prefer the momentum studies to support the move in the price structure in order to trust further advances. On the daily chart, I still see a longer-term downtrend. As a result, I would treat the 26th – 31st of August advance as a corrective move of that major downside path.
• Support: 45.15 (S1), 44.15 (S2), 43.15 (S3)
• Resistance: 46.05 (R1) 47.00 (R2), 48.40 (R3)
Gold locked in a consolidation mode
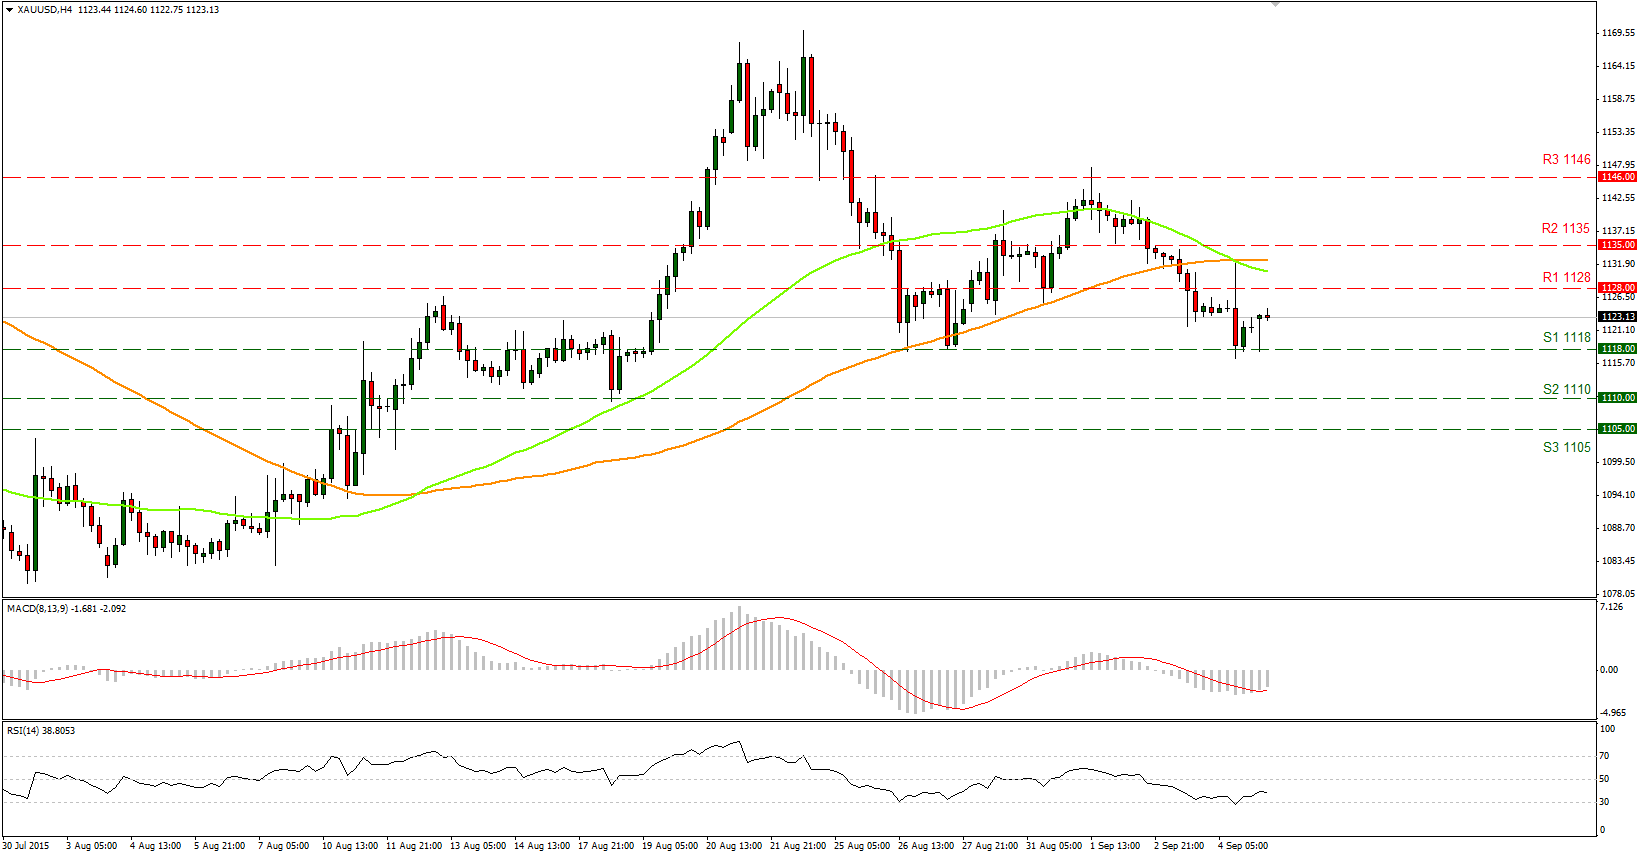
• Gold remained locked in a consolidation mode, within a tight range between the 1128 (R1) resistance line and the 1118 (S1) support level. I believe that a break in either direction is likely to determine the forthcoming near-term bias. Looking at our short-term oscillators, I believe that the next wave is most likely to be lower. The RSI found resistance slightly below the 50 level and turned down, while the MACD, already below its zero line seems ready to cross below its trigger line. These momentums support my view that the next move could be to the downside. As for the bigger picture, with no clear trending structure on the daily chart, I would hold my neutral stance as far as the overall outlook is concerned.
• Support: 1118 (S1), 1110 (S2), 1105 (S3)
• Resistance: 1128 (R1), 1135 (R2), 1146 (R3)

