The list of asset prices that have completely reversed their post-election gains continues to expand. Last week, iron ore officially joined that list…and the sell-off continues apace. On Tuesday night, April 18th, Business Insider reported:
“According to Metal Bulletin, the spot price for benchmark 62% fines fell 4.6% to $63.20 a dry tonne, extending its losses from the multi-year high of $94.86 a tonne struck on February 21 to 33.4%.
It now sits at the lowest level since October 27 last year.”
It was exactly in late October when iron ore broke out to a fresh multi-month high that led to a (very choppy) rally that did not end until February’s multi-year peak. The drop in April alone has been dramatic…
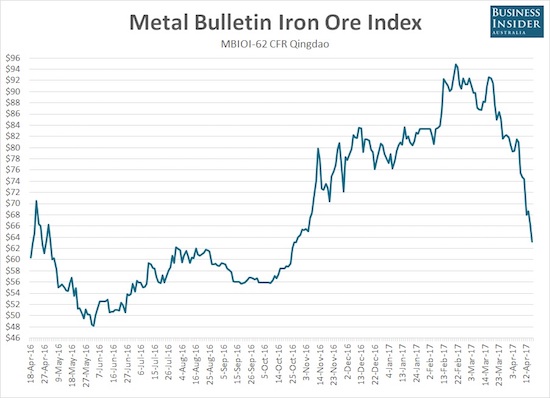
The on-going plunge in iron ore is about as steep as it can get.
Last week Nev Powers, CEO of Fortescue Metals Group, predicted that iron ore prices would settle between $60 and $65 as higher prices were “unsustainable.” Goldman Sachs also reiterated a $60 price target last week. The chart above shows that prices were in a hurry to drop toward these bearish predictions. The main question now of course is whether price will stop here. Typically sell-offs in commodities significantly overshoot presumed levels of support.
The usual suspects have lined up for blame for the price collapse: there is a huge supply issue exacerbated by weakening demand dynamics. From the Telegraph:
“Global oversupply has been blamed for the latest move in prices, while a slowdown in the Chinese car sector has hit steel prices in the country. This has resulted in steel mills opting to buy cheaper iron ore that is stockpiled in ports, rather than the higher-grade, seaborne metal supplied by the likes of BHP and Rio.”
Clyde Russell from Reuters pointed to the massive supply of inventory in March – ironically a month that also saw record Chinese steel output:
“Much of the focus on why the price gains were unsustainable has been on the rapid build-up of iron ore inventories at Chinese ports, with industry consultants SteelHome saying stockpiles at 46 ports reached a record 132.5 million tonnes in the week to March 31.
This is some 65 percent higher than the 80.5 million tonnes recorded in October 2015, just prior to the start of the strong rally in prices.
While an overhang of inventories was always likely to eventually cause prices to stumble, it also means that imports may be subdued in the coming months as traders and steel mills work through some of the stockpiles.”
Russell was also on top of the iron ore dynamics in January of this year as he declared iron ore was back in bubble territory:
“The strong rally in iron ore is perhaps harder to justify, given the market remains well supplied, and if anything will see more cargoes available in 2017.
China’s iron ore imports reached a record above 1 billion tonnes in 2016, jumping 7.5 percent from the prior year, according to customs data.
This was because of the stronger-than-expected steel production as well as lower domestic iron ore output, which was down 3.6 percent in the year to November, according to official data.”
The Financial Review also pointed out a vicious cycle:
“Sellers are keen to sell and buyers, anticipating further price drops, are reluctant to buy, contributing in part to the volatility. Steel mills in China are still in the midst of tapping their substantial iron ore stockpiles, which means they are unlikely to rush to buy any seaborne cargoes, market sources told Metal Bulletin.”
Demand dynamics have soured:
“‘While April is usually the peak period for consumption, steel demand is far weaker than expected,’ Maike analysts Ren Jiaojiao and Dang Man wrote in a note on Tuesday. ‘In the ferrous markets, iron ore probably faces the weakest outlook in the second half…’
China’s crude steel output reached a record 72 million tonnes in March as mills ramped up output in anticipation of a pickup in demand that has remained slow, government data released on Monday showed.”
Strong Chinese output of steel is not getting a bullish interpretation. Instead, analysts are fearing future monetary tightening from China and the potential for a big air pocket in production once steel finally cools off.
The current sell-off will likely not be as troublesome or traumatic for iron ore miners as the extended swoon from 2011 to 2015. Toward the end of this period, the supply chain quickly rationalized with miners shutting down high-priced supply, drove greater production efficiencies, and slashed debt levels. Marginal costs dropped ever lower. Now miners are lean and mean and will likely weather the current storm very well. Indeed while iron ore miners are locked into downtrends off their 2017 peaks, they are well above the 2016 trough and in some cases still locked into strong uptrends. from that trough.
BHP Billiton Ltd (NYSE:BHP) is down 14.7% from its late January peak and still maintains a healthy uptrend as defined by its 200-day moving average (DMA). BHP just tested this trendline as support.
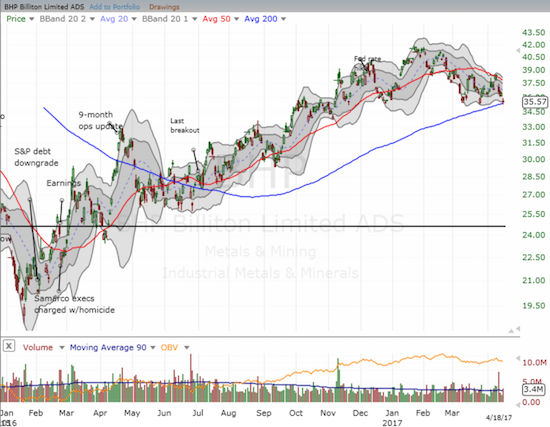
BHP Billiton Ltd (BHP) faces a critical test of 200DMA support.
Rio Tinto DRC (NYSE:RIO) is down 17.2% from its February multi-year peak.
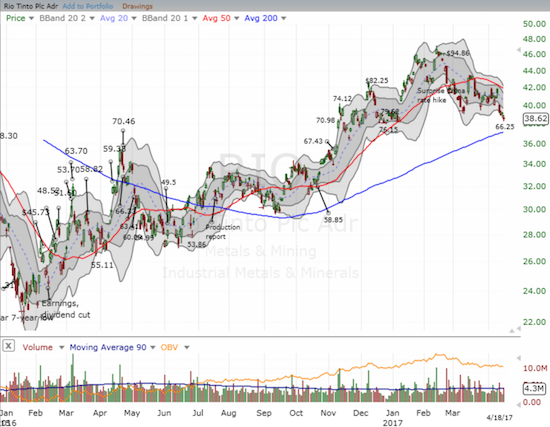
Rio Tinto (RIO) is approaching a critical test of its 200DMA uptrend.
VALE SA (NYSE:VALE) is down 25.6% from its February peak. VALE is much more dependent on iron ore than either BHP or RIO. The extremely strong rally off the 2016 trough means VALE still trades well above its 200DMA uptrend line.
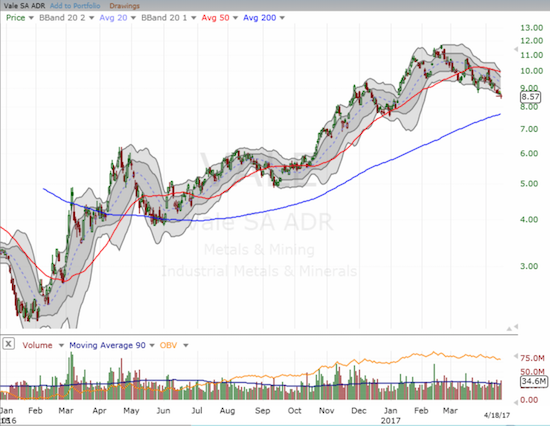
Vale (VALE) has descended a 2-month downtrend from its recent high but is still up a whopping 271% from the 2016 trough.
Cliffs Natural Resources Inc (NYSE:CLF) is faring the worst of the bunch. Not only is CLF down 43.0% from its February high, but also its 200DMA breakdown has led to a near complete reversal of its post-election gains.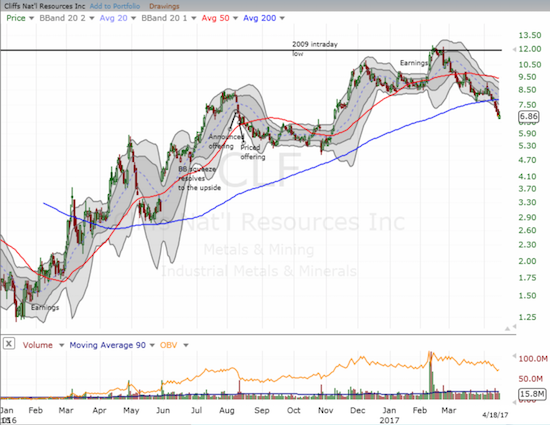
Cliffs Natural Resources (CLF) made a very bearish 200DMA breakdown. Yet, the stock is still up an incredible 444% from the 2016 trough.
Whenever iron ore finally stabilizes, the rebounds in these stocks could be substantial. A good way to play the potential for a rebound is through a pairs trade. Exactly one year ago, I described a pairs trade between (long) RIO and (short) BHP. Shifting that to VALE and CLF makes a lot of sense – short VALE since it technically has more downside potential and long CLF since it technically has more upside potential.
Strangely through iron ore’s woes, speculators in the Australian dollar (NYSE:FXA) have stayed bullish. Net long contracts have grew substantially into the February peak for iron ore. Yet, these contracts are still at lofty levels despite the steep sell-off in iron ore.
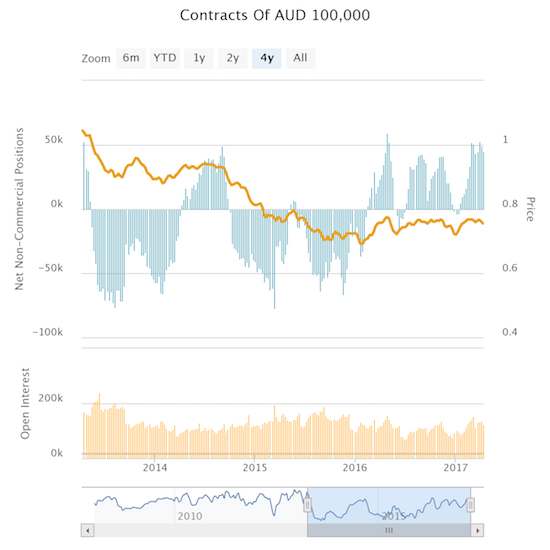
Speculators have ignored weakening iron ore prices as they have accumulated net long contracts in the Australian dollar.
I argued earlier that the economic backdrop alongside plunging iron prices suggests that the Australian dollar has topped out. An unwind of speculative positions could exacerbate the current sell-off in the Australian dollar.
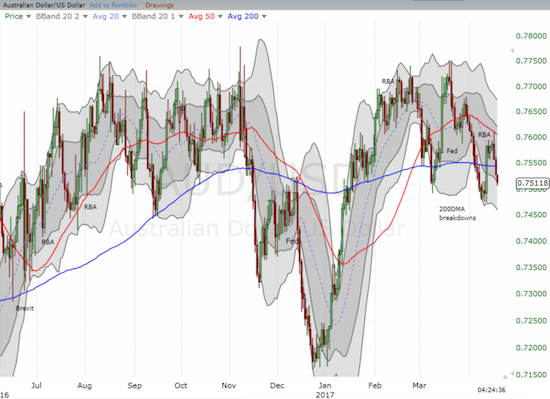
AUD/USD is oh so slowly topping out. I think a retest of the December, 2016 low will come in due time.
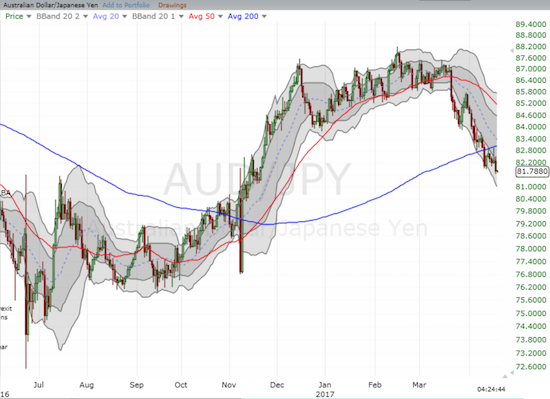
AUD/JPY confirmed a very bearish 200DMA breakdown with follow-through selling.
On balance, I still prefer to fade rallies in the Australian dollar.
The fast-moving dynamics in the iron ore market mean that related trades will be an on-going source of substantial price moves. I plan to report more frequently on these events alongside trade ideas.
Be careful out there!
Full disclosure: short BHP, short AUD/USD
