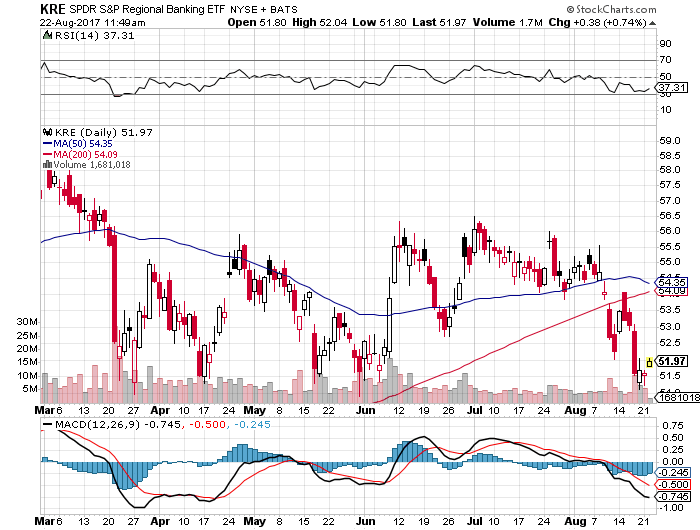
There have been some mild outflows in recent sessions in the largest Regional Banking ETF, SPDR S&P Regional Banking (MX:KRE) (NYSE:KRE) (Expense Ratio 0.35%, $3 billion in AUM), with approximately $275 million exiting the fund via redemption pressure.
This may be tied to the over $340 million that has vacated the largest U.S. Financial Equity ETF, Financial Select Sector SPDR (NYSE:XLF) (Expense Ratio 0.14%), during this same timeframe, as it appears that portfolio managers are trimming exposure to the space — especially since XLF recently clipped and failed to hold its 50 day MA.
KRE remains the largest “Regional Banking” focused ETF in the landscape in spite of the recent outflows, and with its north of $3 billion in AUM it is nearly three times the size of its next largest rival in the segment, iShares US Regional Banks (NYSE:IAT) (Expense Ratio 0.44%, $658 million in AUM), and the third largest fund in this camp has only $151 million in assets under management, KBWR (PowerShares KBW Regional Banking Portfolio, Expense Ratio 0.35%).
Recent volatility in this space amid the outflows does bring into consideration the trading oriented “Bear” products that track the Regional Banks, the lesser known Direxion Daily Regional Banks Bear 3X Shares (NYSE:WDRW) (Expense Ratio 1.10%, $5 million in AUM) and ProShares Short KBW Regional Banking (NYSE:KRS) (Expense Ratio 0.95%, $1.7 million in AUM).
When breaking down the underlying portfolio in KRE, we see that there are one hundred four individual holdings, and the fund follows a modified equal-weighting scheme that is familiar to several other SPDR niche sector funds. Because of this, no individual holding takes up too much of the portfolio from a weighting standpoint unlike a market-capitalization weighted ETF such as say XLF, where the two largest names are BRKb (11.26%) and JPM (10.71%).
Also, when we see flows into or out of KRE we typically think of them as a sector bet more so than anything company specific nor earning related, when on the other hand traders and portfolio managers will often use XLF and XLF options around the earnings reports of the major money center banks that populate the underlying index. The largest KRE holdings are as follows: 1) FITB (2.50%), 2) BBT (2.49%), 3) PNC (2.46%), 4) ZION (2.46%), 5) STI (2.36%).

The SPDR S&P Regional Banking ETF was trading at $51.89 per share on Tuesday morning, up $0.3 (+0.58%). Year-to-date, KRE has declined -6.00%, versus a 10.49% rise in the benchmark S&P 500 index during the same period.
KRE currently has an ETF Daily News SMART Grade of B (Buy), and is ranked #23 of 38 ETFs in the Financial Equities ETFs category.
