The USD remains firm through Asia, and whether this is down to month-end rebalancing flows, or just because the US remains an island alone, we are seeing the greenback supported.
There are three key factors that have the potential to derail 'king USD'. These being, overloved conditions, the US Midterms and CNH moves. Of course, we can add in weakness in this week's US ISM and NFPs too.
Here, we see a general love affair with the USD, where sentiment is euphoric and positioning stretched. As detailed yesterday, while markets try as efficiently as possible to discount all known news, there is still the potential for traders to reduce USD exposures into the election, even if a split Congress has been debated for months, as the prospect of negative legislative news flow in the weeks ahead will ramp up. We can also look at future USD/CNH and USD/CNY flows, as a stronger yuan should resonate and translate through to broad USD weakness.
It was only yesterday Chinese press talked up the notion of defending the 7-handle in USD/CNH. That is now playing out with the PBoC announcing they will offer CNY10b in three-month and CNY10b in one-year bills in HK on 7 November. With a greater degree of options for local investors we should see, that is in theory, funds removed from the banking system, and the lower liquidity environment pushing CNH forward rates higher, in turn, increasing the costs to be short CNH.
While we are not talking incredible sums of money and the bill issuance isn’t until 7 November, this is a message to the market and one would expect speculators to start reducing their USD/CNH longs, but that isn’t happening at this stage. So, one to watch, and perhaps, should we see a surprise with a Republican-controlled House and Senate at next week’s US Midterms, then the market will push the pair through 7.00. However, for now, the PBoC is supporting the CNY/CNH (yuan) through liquidity measures and traders will be watching CNH 12-month forward rates as their guide. Should we see forward rates move materially higher then USD/CNH will head lower and the broad USD will sell off in appreciation.
AUD/USD is a good play on USD/CNH weakness, with the six-month correlation coefficient between the two pairs sitting at -0.77 - so, this is a meaningful inverse correlation. AUD/USD has not really reacted to this news, and AUD traders have been looking at domestic markets where the headline and trimmed mean inflation increased by 0.44% and 0.35% (both qoq) respectively. Both prints were marginally below expectations and remain outside the RBAs target of 2-3%.
The one-off amendment to child-care negatively impacted the quarterly read by some 15bp, but it not a surprise to see Aussie two-year bond yields ticking a touch lower, while the interbank rates market is now pricing in just 1.5bp of hikes through May 2019. These factors have pushed AUD/USD into a session low of 0.7072, and while we sit a touch off these lows, those looking to buy AUD’s would have also been treated to a below-consensus China October manufacturing PMI print at 50.2 (vs 50.6) and non-manufacturing PMI of 53.9 (54.6). I remain a buyer of AUD/USD, but only on a daily close above 0.7160, and as detailed yesterday, this would need a more positive trend in the Hang Seng, and with this index up 0.6% today we are not getting a sufficient tailwind here.
GBP/AUD shorts have worked well of late, with traders focusing overnight on rating agency S&P, who detailed their concerns to a ‘no deal’ Brexit, joining Fitch who spoke out about this in the prior session. We’ve seen some covering of short positions here today, but it will be interesting to see if traders sell this modest bounce with price currently oscillating around into the 21 September low, as well as the 100- and 200-day moving averages - seen between 1.7932/35.
It takes a brave soul to trade the GBP, and we see 1- and 3-month GBP volatility elevated, but tactically it feels as though GBPAUD could go lower in the short-term. Although there are significant risks should we see any good news around the progress on Brexit.
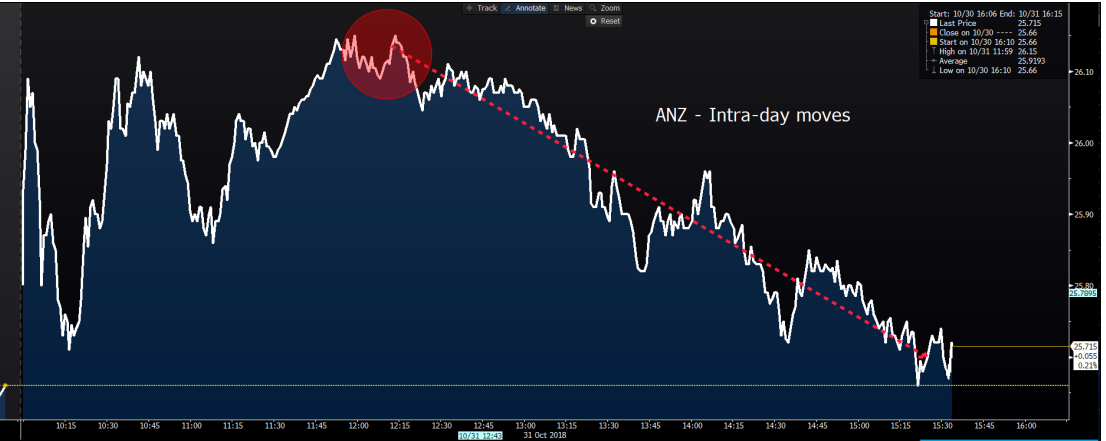
As a macro-watcher, it was interesting to go through ANZ’s earnings, as we can get a sense of the Aussie property market, and how the key players are positioned should we see a genuine downturn. Clearly, the numbers were good, at least relative to expectations, with the stock pushing into $26.15 (+1.9%), although sellers have weighed in as the day rolled on.
We see a bank which is well capitalised, and where bad and doubtful debts have hit a record low against gross loans and advances (GLA). Where the overall quality of underlying assets improves, with gross impaired assets sitting at a low 33bp and non-performing loans to GLA’s sit at 0.9%. We’ve seen the bank go above and beyond APRA requirements in its quest to shift its loan book away from interest-only (IO) loans (IO loans make just 22% of the portfolio) and towards P&I loans. So, in effect, we have a business that is in good shape, and ready to tackle the challenges set in the Australian economy, which as we know are simmering away. If the economy is going to struggle as a result of a potential downturn in the property market then ANZ are positioning themselves accordingly and will weather any storm fairly well, although this will naturally impact profitability.

The focus turns to NAB (tomorrow), but more so Westpac (5th November), who are more leveraged to the Sydney property market and that is key going forward.
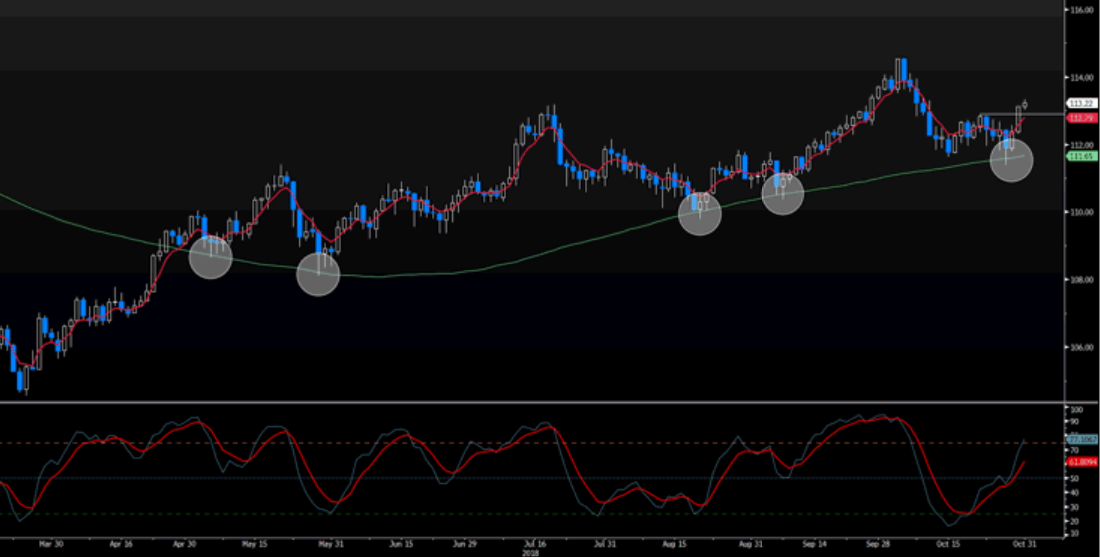
Back on the FX theme and USD/JPY has been well traded, with buyers getting the upper hand ahead of month-end. The technicals and price action on the four-hour and daily chart favour longs, although, as mentioned, I have an eye on USD/CNH and whether traders start to fade the USD after Friday’s non-farm payrolls and into the US Midterms. Today’s BoJ meeting didn’t give us much reason to act and while we saw some downside tweaks to core CPI in all three years out, while providing a view that economic risks and prices are skewed to the downside, although this was largely expected. On the day, I would be selling into moves into 113.65/70 area, which is in line with the top Bollinger band (on the daily chart) and the implied move on the day from USD/JPY volatility.

