
The S&P 500 is stalling at its 2800 resistance. Meanwhile, there is interesting price action in other markets besides the U.S. stock market.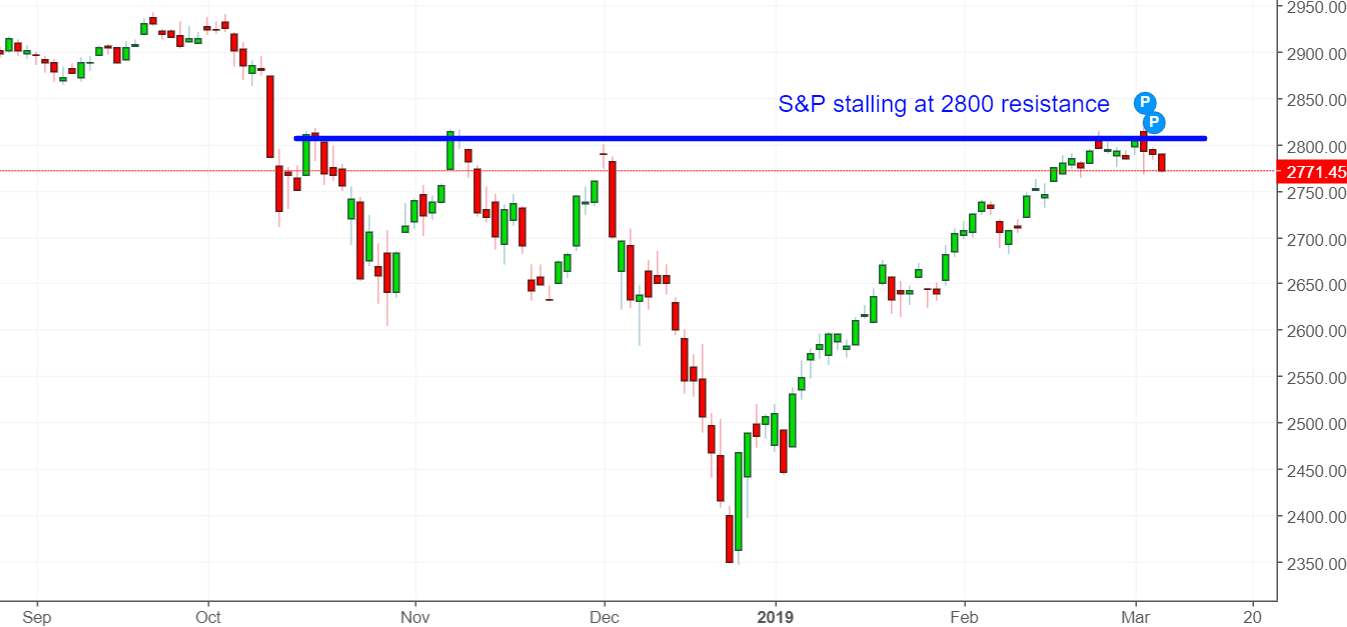
Let’s determine the stock market’s most probable medium term direction by objectively quantifying technical analysis. For reference, here’s the random probability of the U.S. stock market going up on any given day.

*Probability ≠ certainty. Past performance ≠ future performance. But if you don’t use the past as a guide, you are blindly “guessing” the future.
VIX’s RSI is turning around
After falling significantly over the past few months, VIX is starting to bottom.
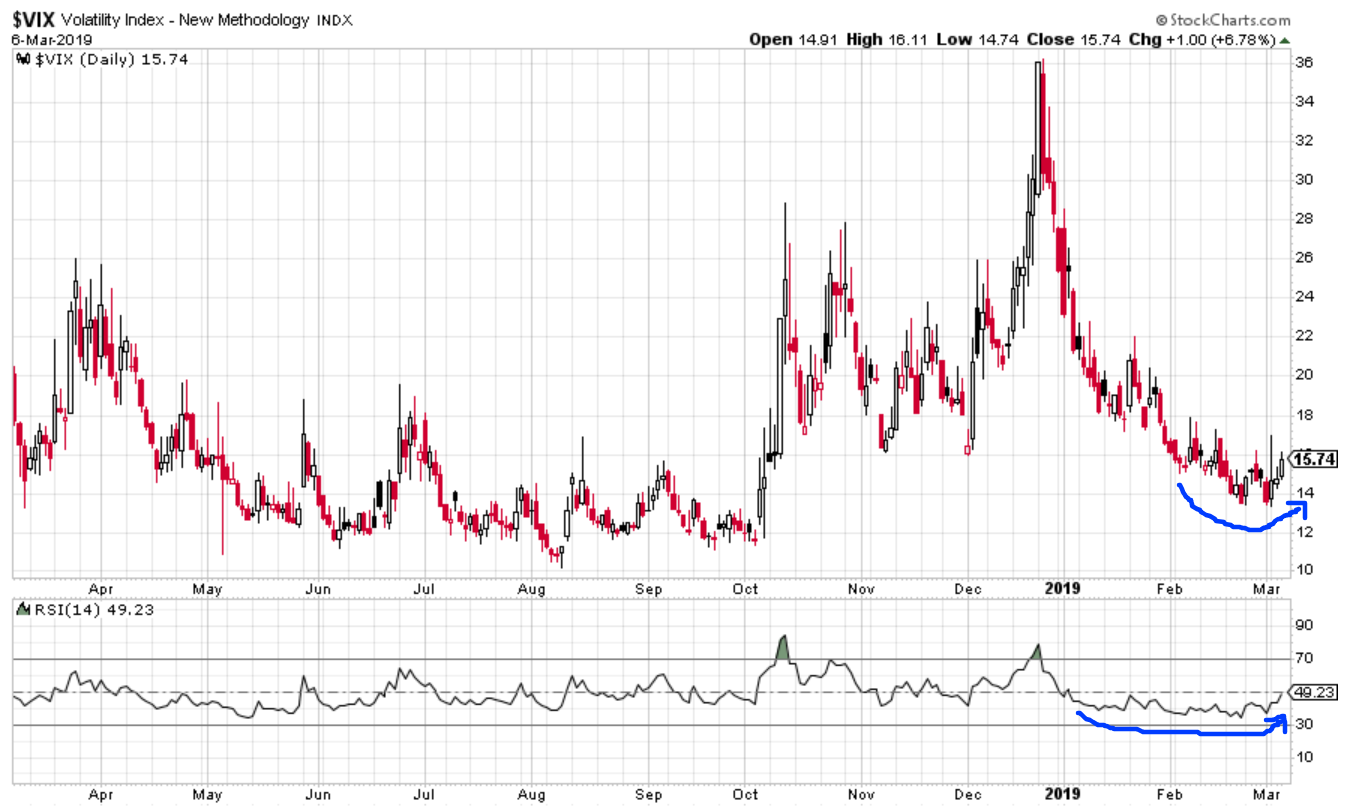
VIX’s 9 day RSI has now exceeded 50 for the first time in 2 months. 50 is an important threshold for momentum:
- When RSI is above 50, the market is in an uptrend.
- When RSI is below 50, the market is in a downtrend.
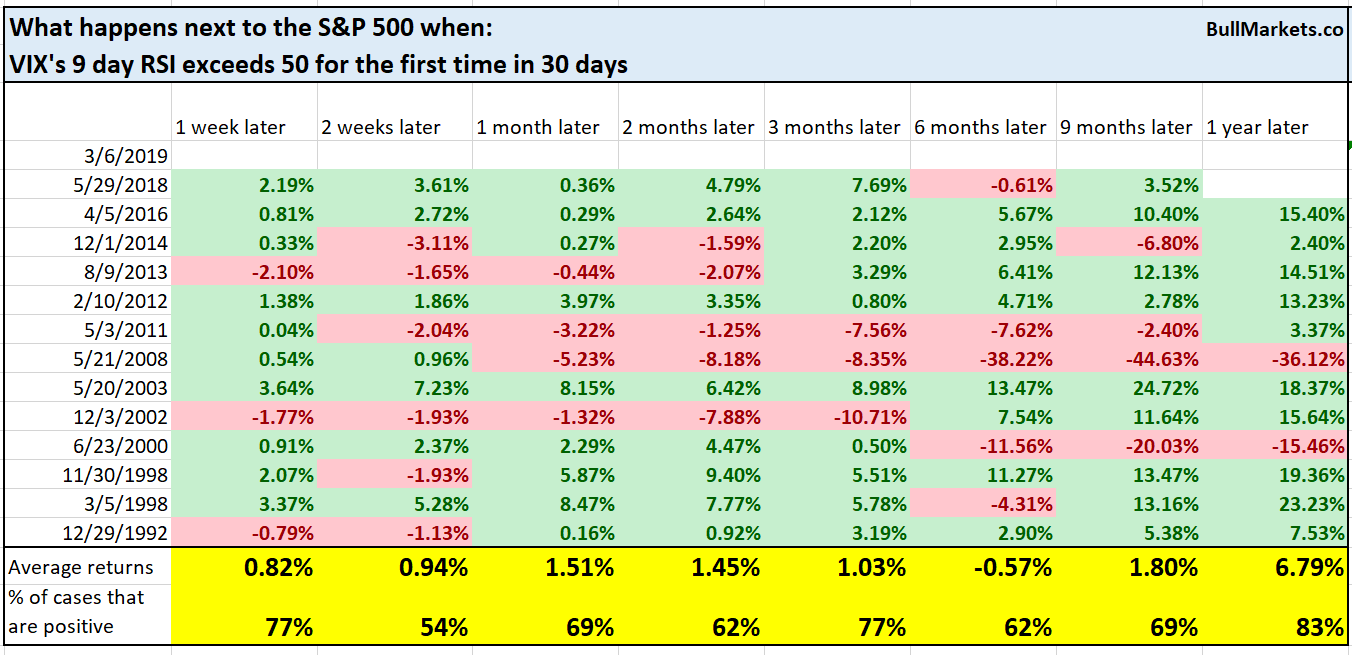
Here’s what happens next to the S&P when VIX’s 9 day RSI exceeds 50 for the first time in 30 days.
Here’s what happens next to VIX when VIX’s 9 day RSI exceeds 50 for the first time in 30 days.
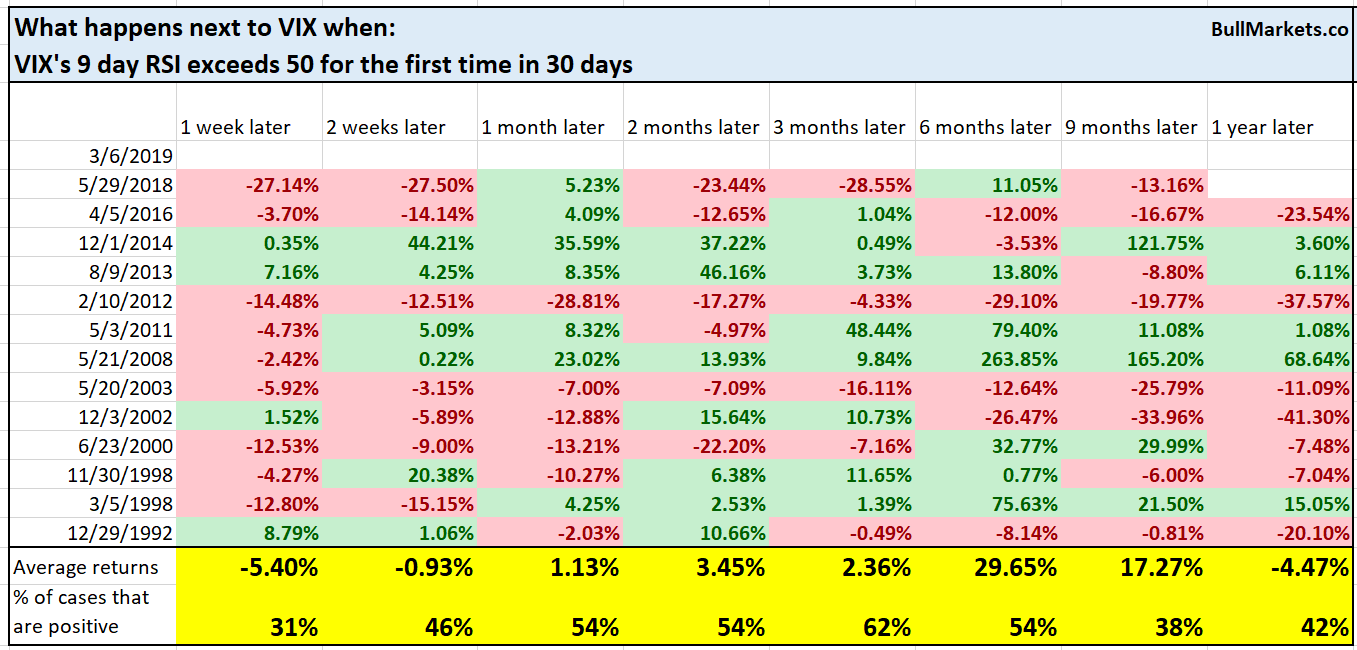
Interestingly enough, VIX tends to fall 1 week going forward. Yes, VIX is compressed right now. Yes, volatility could surge soon. But this doesn’t always happen. For example, the stock market’s volatility was consistently compressed in 2017, yet volatility never spiked that year.
This is why we don’t go long volatility, even though doing so is tempting.
Bitcoin
Bitcoin went up in February for the first time since July 2018. Is the Bitcoin bear market coming to an end?
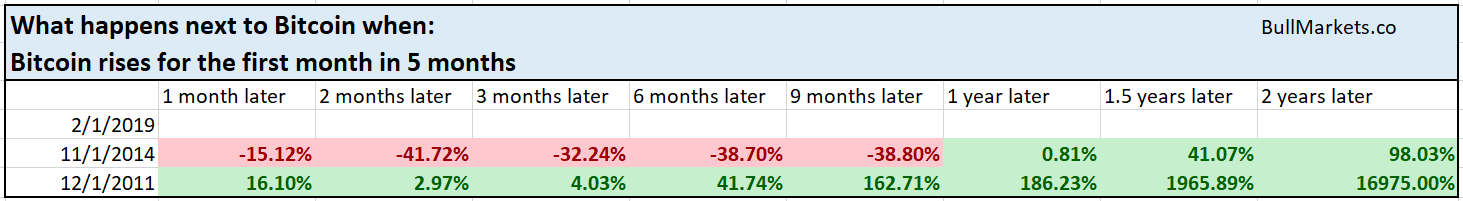
In Bitcoin’s short history, there have only been 2 other historical cases in which it went up for the first time in 5 months (i.e. ending a long loss streak).
Both of those cases came close to marking a bottom in Bitcoin.
*Take this study with a grain of salt because Bitcoin’s history is extremely limited.
Dow Jones Transportation Average
The Dow Jones Transportation Average has now fallen 9 days in a row. This is the longest loss streak since February 2009.
As a whole, these loss streaks aren’t very indicative of the Transportation Average’s future returns.
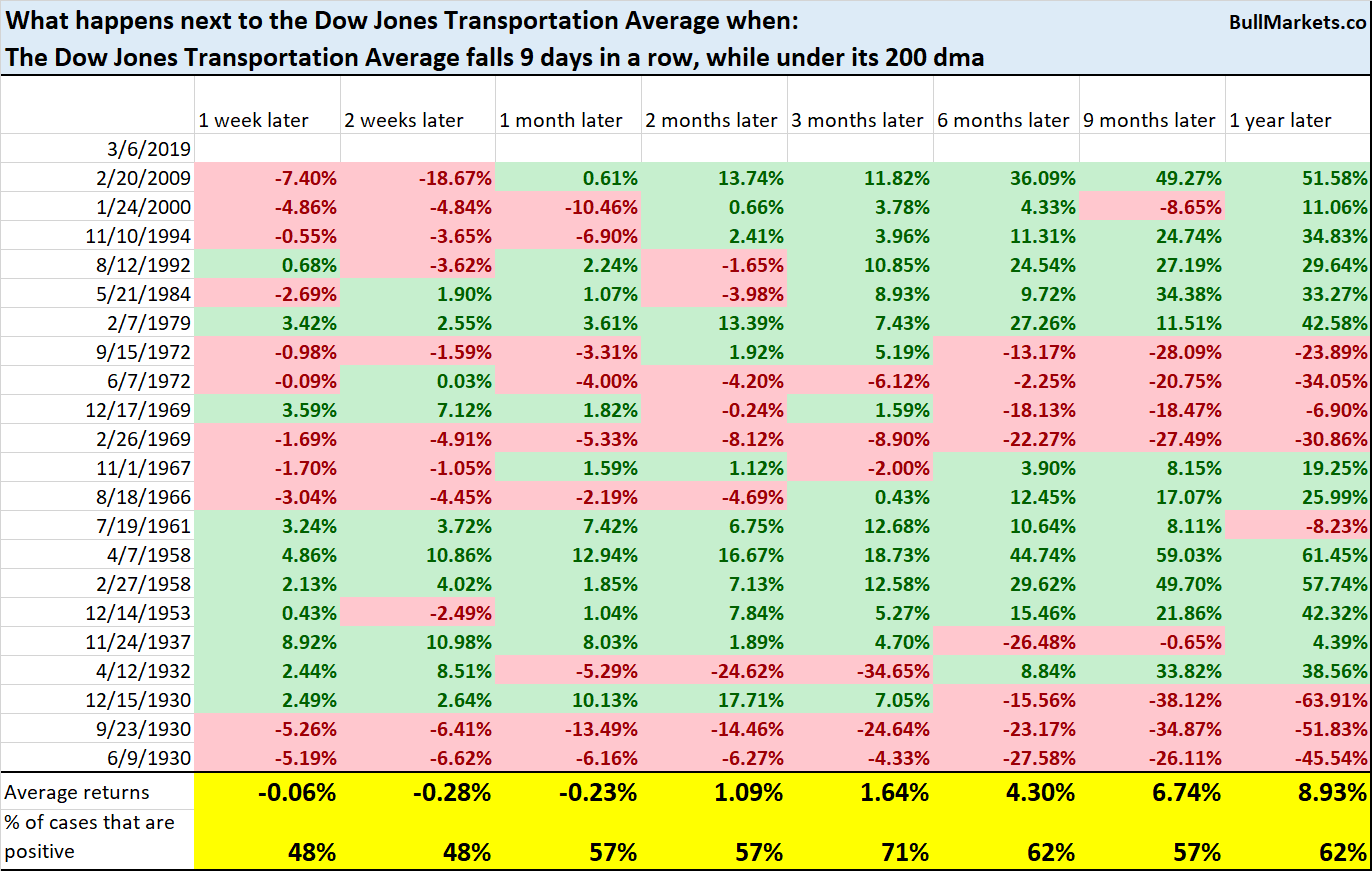
Future returns are mostly random.
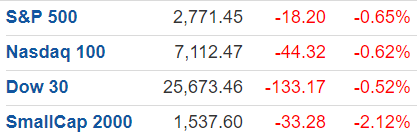
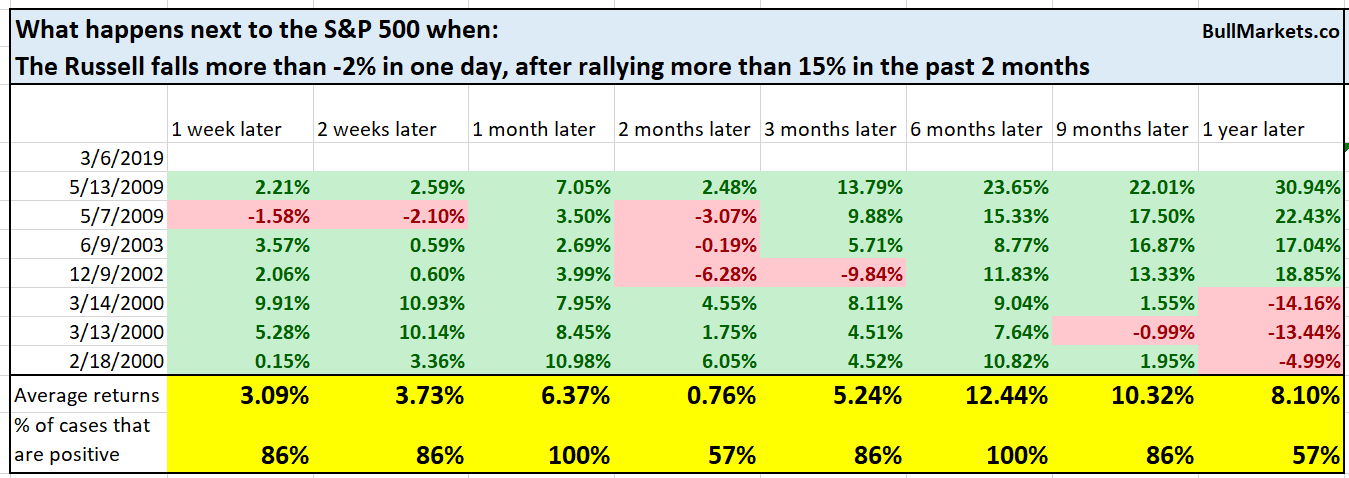
Russell’s first big drop
Small cap stocks significantly underperformed their large cap brethren today.
Is this the start of a sizable pullback/retest for small cap stocks?
Here’s what happens next to the S&P when the Russell 2000 falls more than -2% in one day, after rallying more than 15% in the past 2 months.
*Data from 1987 – present
Here’s what happens next to the Russell.
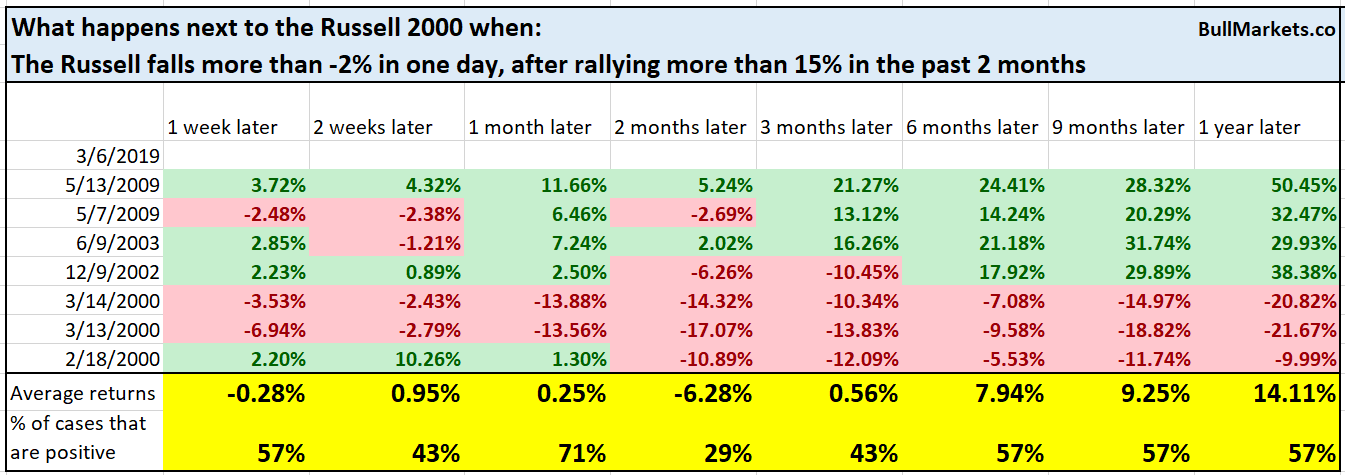
As you can see, this is quite rare. It’s more bearish for the Russell than S&P, which suggests that small caps will continue to underperform large caps in the next few months.
Emerging markets vs. China
Chinese stocks have surged recently thanks to fresh stimulus. However, it’s interesting to note that emerging market stocks have done poorly in the face of Chinese equity market strength.
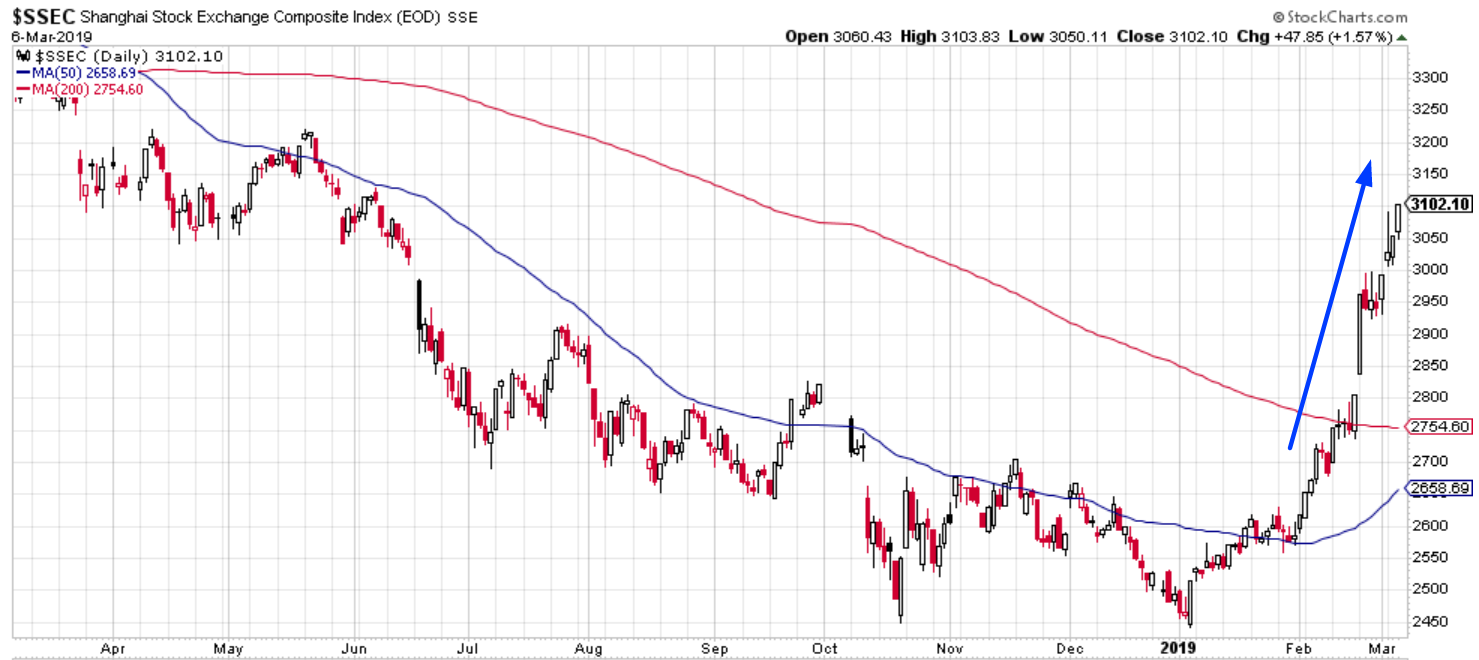
This is abnormal because emerging markets should be closely connected to China. Many emerging markets are tied to the Chinese economy – just think about how much of an impact China has on the whole Asian economy.
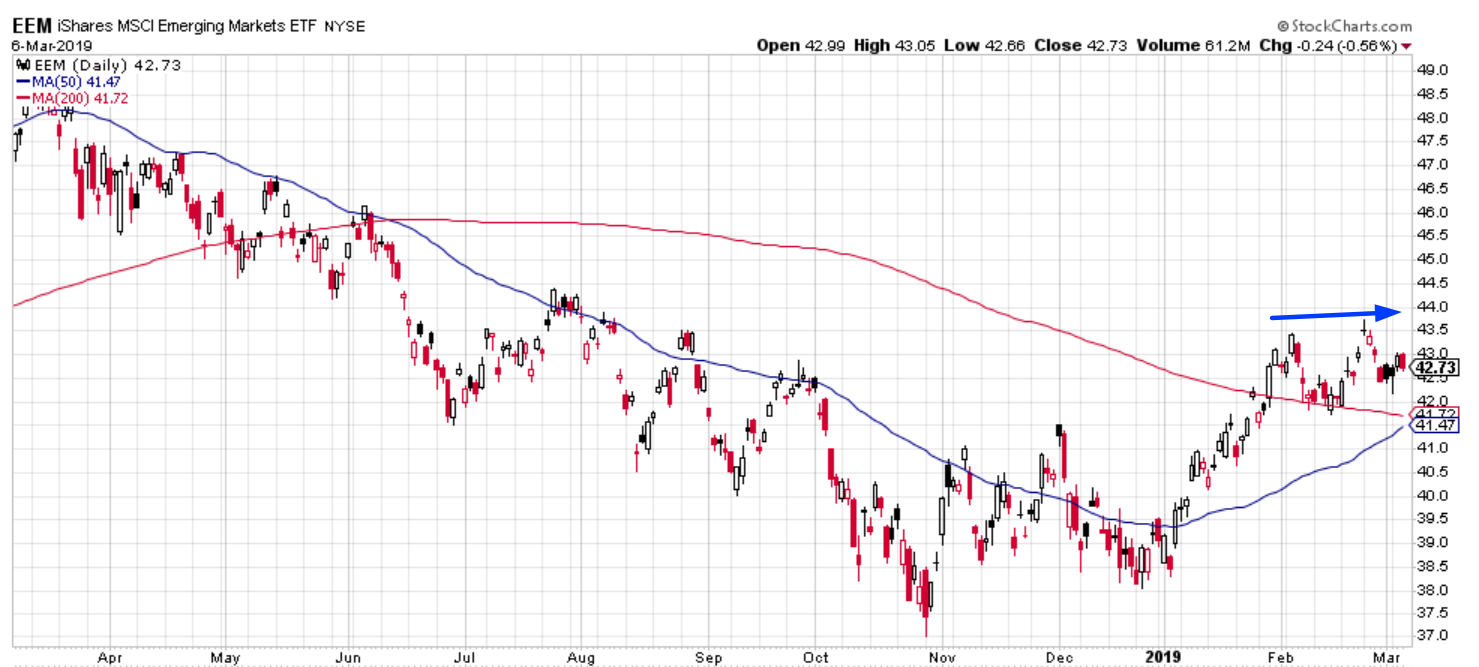
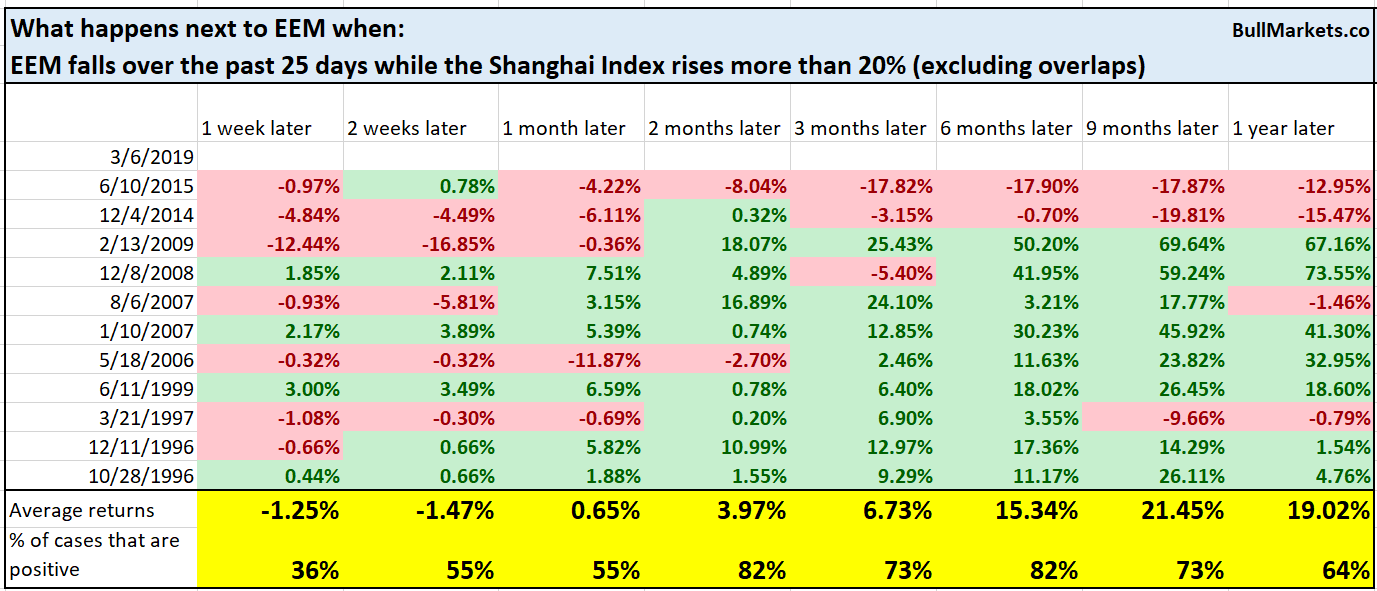
Here’s what happens next to EEM (emerging markets ETF) when it falls over the past 25 days while the Shanghai Index rises more than 20%.
Here’s what happens next to the Shanghai Index
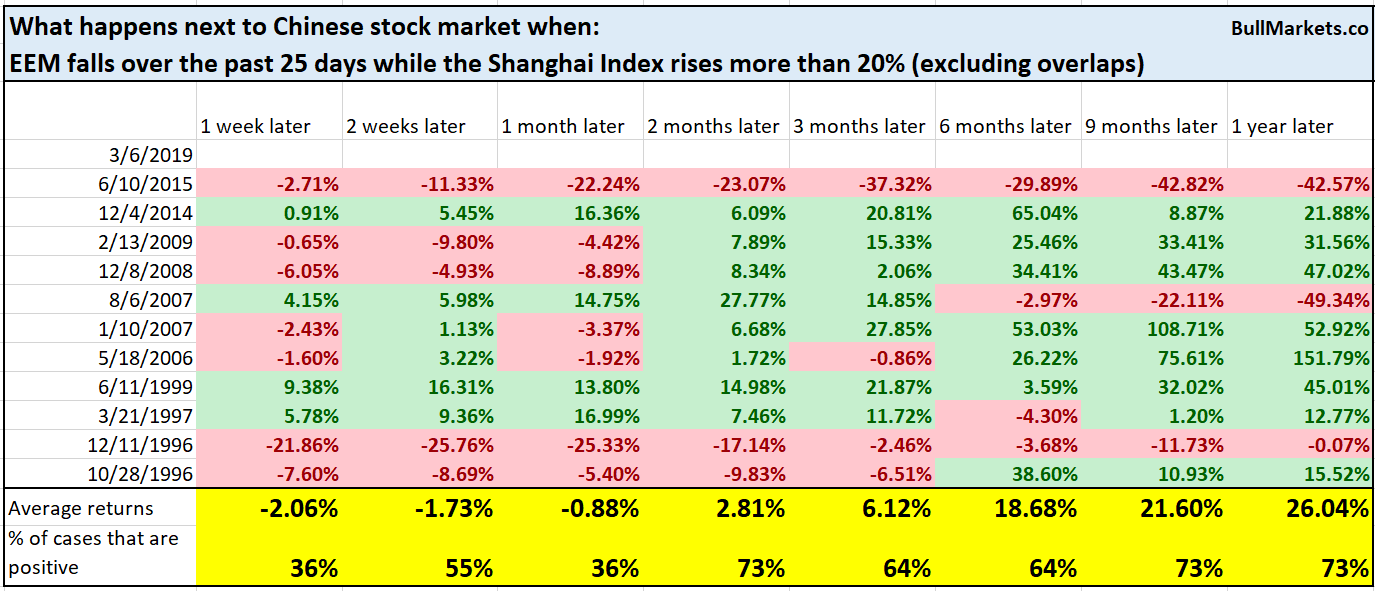
This is a short term bearish factor for both EEM and the Shanghai Index. Moreover, this suggests that EEM will catchup to the Shanghai Index over the next year.
USD Index
While the U.S. stock market has been on a rollercoaster ride since October 2018, the currency markets have been rather tranquil. In fact, the USD Index’s 20 weekly standard deviation is now a mere 0.52
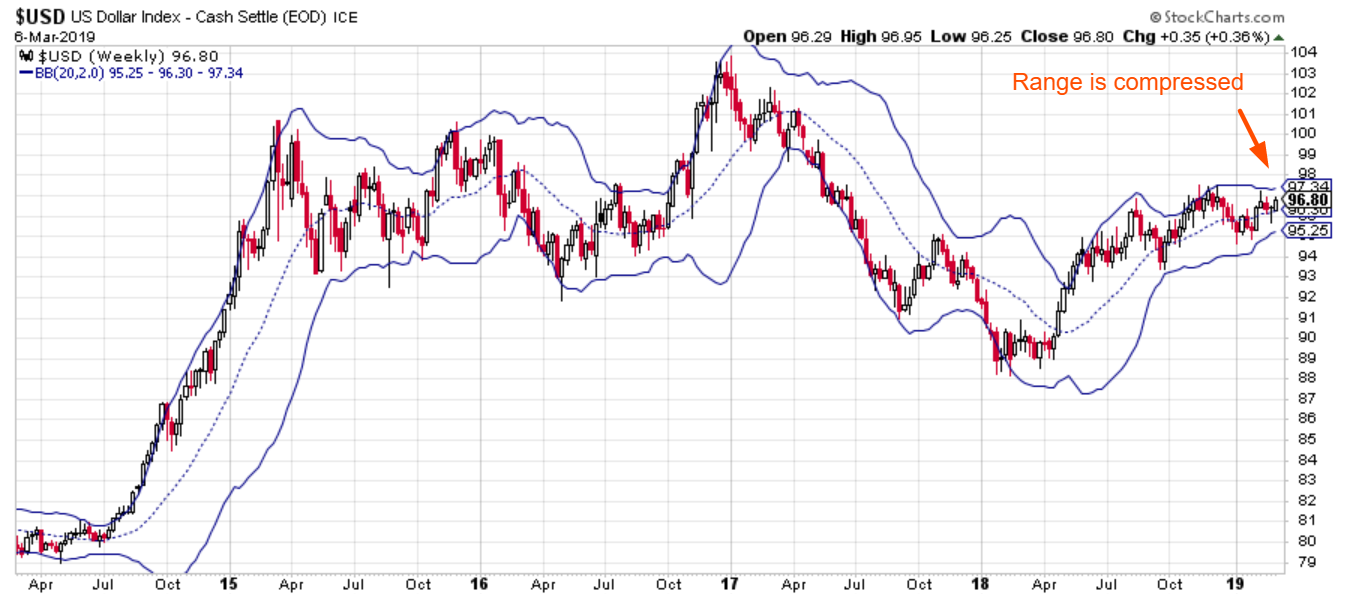
Similar historical cases were mostly bullish for the USD Index over the next year.

Conclusion
Here is our discretionary market outlook:
- The U.S. stock market’s long term risk:reward is no longer bullish. In a most optimistic scenario, the bull market probably has 1 year left. Long term risk:reward is more important than trying to predict exact tops and bottoms.
- The medium term direction (e.g. next 6-9 months) is more bullish than bearish.
- The stock market’s short term has a bearish lean due to the large probability of a pullback/retest. Focus on the medium-long term (and especially the long term) because the short term is extremely hard to predict.
Goldman Sachs’ Bull/Bear Indicator demonstrates that while the bull market’s top isn’t necessarily in, risk:reward does favor long term bears.