The level of volatility in the market is borderline insane. The pip ranges have expanded massively as the perfect storm hits the currency market. This volatility is unlike anything seen for many years and fair to say we can start drawing parallels with the dislocation and distortion in FX swings reminiscence of the Global Financial Crisis from back in 2008/2009
Quick Take
Monday, March 9th, will go down as one of those catastrophic days in history books. The Forex volatility traders are having to navigate through is unlike anything seen for many years and fair to say we can start drawing parallels with the dislocation and distortion in FX swings reminiscence of the Global Financial Crisis from back in 2008/2009. The incredible volatility implies pip ranges and spreads are much wider due to poorer market liquidity. To understand this perfect storm in FX, it just so happens that the market is freaking out at the prospects of a global recession amid the rapid international spread of Covid-19, at a time when an Oil price war just broke out. Risk-off moves were intense, disorderly, and unrelenting, circuit breakers in the S&P 500 or bond yields had to kick in only hours after the Asian markets opened. Central Banks are undoubtedly the next key focus as further rate cuts are baked in the cake while the market is once again bullying the Fed by forecasting another 75bp of rate cuts on March 18th. QE anyone?
Many higher yielding EM currencies were absolutely destroyed, with a clear example of the calamitous movements suffered by perma long carry traders seen in MXNJPY, down more than 10% at some point. The AUD/JPY wasn’t far behind, even if the rebound was impressive too. The CAD and NOK were taken to the cleaners, unsurprisingly, as the oil exporters most vulnerable to the historical 30%+ collapse in the price of Oil. The Forex darling continues to be the Yen as safe havens draw disproportionate demand, while the Swiss franc and the Euro, continue to also outperform in times of huge uncertainty. The USD, hit by the prospects of Fed QE and the unwind of carry trades, kept falling and has shaved in two short weeks the gains it managed to register during the first two months of the year. Lastly, the Pound is a relative sideshow compared with some of the moves seen so far, in what I see as a fiat useful to tap into for diversification purposes amid the fall out of high-yielding currencies.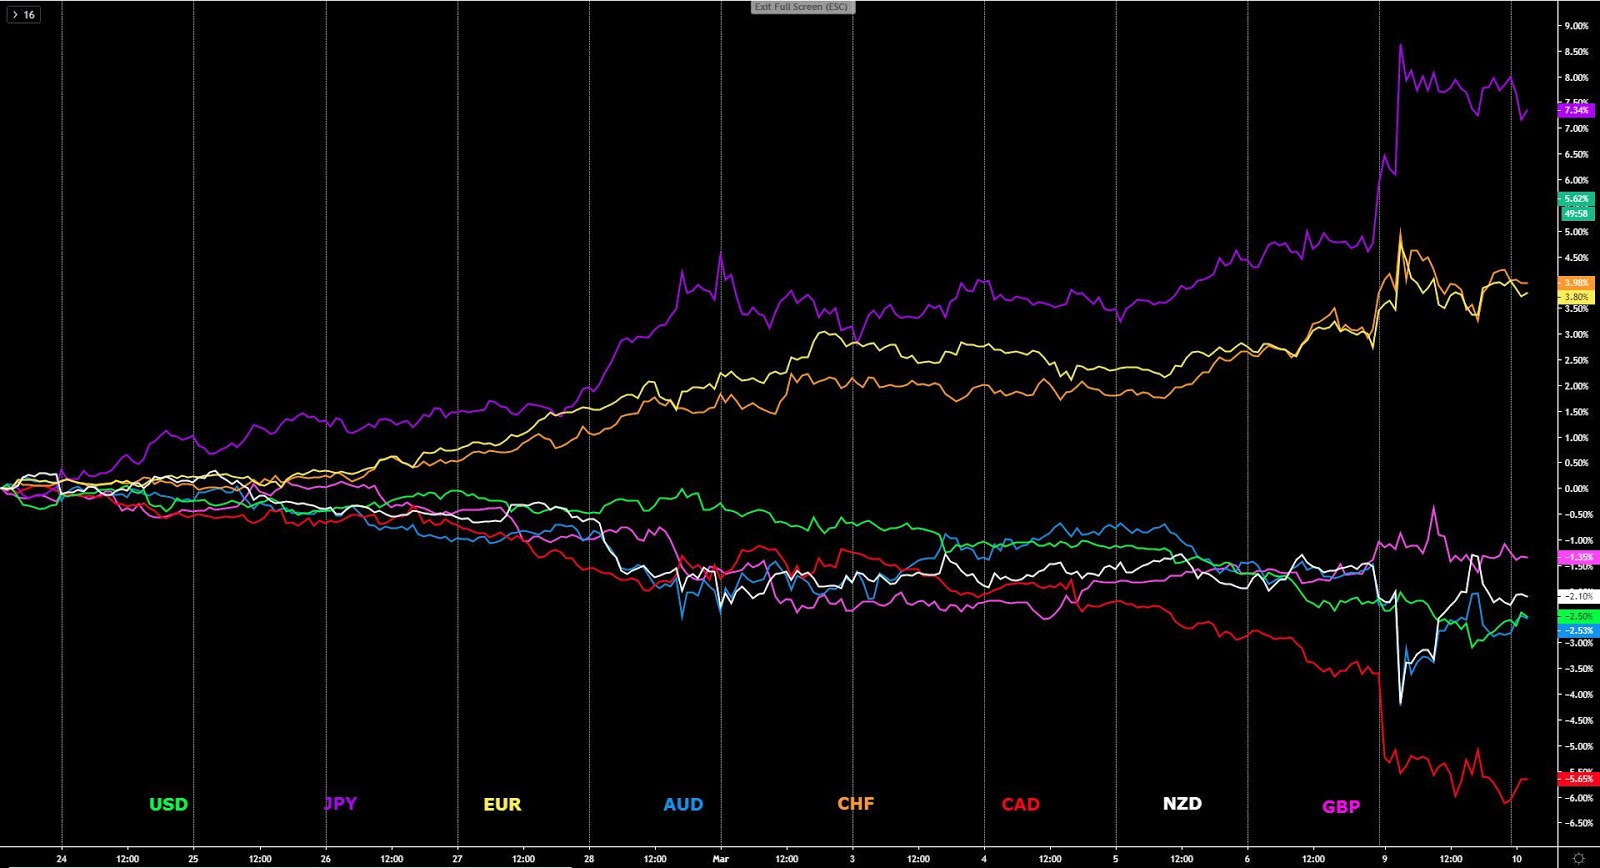
Narratives In Financial Markets
* The Information is gathered after scanning top publications including the FT, WSJ, Reuters, Bloomberg, ForexLive, Twitter, Institutional Bank Research reports.
FX vol as not seen for years: In FX, we’ve seen the kind of market volatility and dislocation not witnessed since the 2008-09 Global Financial Crisis. This is no joke and it has a huge impact on how we should be all approaching the markets as traders. The incredible volatility implies pip ranges are too wide and nothing compared to where we were weeks ago. It also means wider spreads due to poor market liquidity. A higher than normal spread generally indicates one of two things, high volatility in the market or low liquidity due to out-of-hours trading, although in the current circumstances, due to the perfect FX storm as the next paragraph explains.
The perfect storm for FX markets: The team at ING touches on why this is the perfect storm in the Forex market. In their note to clients, they include as main culprits "(i) Covid-19 spread going global and investors fearful of a spike in US cases this week as US authorities play catch-up with testing, (ii) a collapse in the OPEC+ agreement, which now triggers a market share grab between the Saudis and Russia (oil linked currencies smashed) and (iii) a report in the FT that Citibank is pulling out of two-thirds of its vendor trading platforms raising some (perhaps ill-founded) concerns over FX market liquidity."
CAD, NOK taken to the cleaners: By assessing the damage caused by the Oil bust, unsurprisingly, the oil exporters (NOK and CAD) were the most vulnerable currencies right from the get-go on Monday. The NOK was particularly fragile given the context of the low liquidity of the currency. NOK’s meltdown vs the appeal towards the EUR as a funding currency embodies this danger. On the contrary, the market’s favorite safe havens (Swiss franc and Japanese yen) were the outperformers.
Context of Oil bust unprecedented: The total collapse in the price of Oil after Saudi Arabia declared a price war is unprecedented, according to IEA (International Energy Agency) Executive Director Fatih Birol. “The situation we are witnessing today seems to have no equal in oil market history. A combination of a massive supply overhang and a significant demand shock at the same time.” To be reminded why Saudi Arabia has launched a price war in Oil prices, read the following article.
Market fast pricing return of QE by the Fed: After the insane volatility seen in what’s referred to as the ‘new Black Monday’, the market has adjusted the chances that the Fed will cut to zero rates again by March 18 meeting. A 75 bps rate cut is now priced in for this meeting. If that’s true, the Fed will reach a low rate-setting band of 0.25-0.50% range and we all know what followed on the aftermath of the GFC. A final cut to 0.00-0.25% range followed by QE. Other considerations could be lowering charges for swap lines or cash lending to smaller banks.
Central Banks forced to act: The fact that equity indices in the US are hitting circuit breakers and falling to the tune of 7% to 10% is not going to appease the Fed, which is rapidly being cornered to act. But the same can be said about the ECB, BOJ, pushed further into unknown territory to react via unorthodox policies given the exhaustion of conventional policies. In the case of the BOC, RBA, RBNZ or BOE, there is still some small ammunition left but that’s the room for maneuver is too limited.
Deflation feared: The chaotic fall in the price of Oil could not have come at a worse timing. The largest one-day percentage fall since 1991 - gulf war - will create further deflationary pressures around the globe. When combined with the prospects of an economic recession felt worldwide, it will force Central Banks to carry a massive burden by acting in ways still unknown. Collaboration with fiscal authorities, cash handouts, intervening in the yield curves, buying stocks, etc.
Stats for the history books: At its lows today, the S&P 500 saw the biggest down day since 1987 (by the close the biggest since Oct 2018)! This is the only day in the history of S&P 500 futures that they gapped down more than -5% and didn't close above the open. Besides, when looking at the total U.S. Trading volume, on a 10-day moving average basis, is now higher than during the meltdown in 2008. Volume is another whopper today, over 17 billion shares.
Trump in denial: Will Karma bite him back? In a tweet, he downplayed COVID-19 by noting its business as usual. “So last year 37,000 Americans died from the common Flu. It averages between 27,000 and 70,000 per year. Nothing is shut down, life & the economy go on. At this moment there are 546 confirmed cases of CoronaVirus, with 22 deaths. Think about that!” Not the slightest sign of encouraging a bit of social distancing from Mr. President! The state of denial about the scale of the problem, and an underwhelming fiscal response is not a good sign.
Italy’s lockdown expands nationwide: There is chaos in Italy as the Prime Minister Conte confirms the country is on lockdown with the quarantine now expanded throughout the country as coronavirus cases, deaths keep soaring. The restrictions will last for two weeks, and during that time, the movement will be restricted across Italy. All of Italy will be under same condition to limit public assembly. It follows a scary increase in cases to over 10,000 with the death rate increasing by 27% in 1 day.
WHO gives a positive spin: The World Health Organization gave its daily update to the press, noting that “even if we call it a pandemic, we can contain it”. The top representatives, WHO's Tendros/Ryan spoke about how the Italian health system is overrun, that the epidemic is still very much in the up cycle, with data showing 43 countries have less than 10 cases, while 79 countries have less than 100.
FX turnover soars: As Reuters reports, the unwind of leveraged bets and the carry trade saw trading volumes turnover soar across platforms. “Yen turnover was four times the usual volumes, euro volumes were 6.4 times the average and Aussie turnover was 3 times its 30-day average on Citibank’s platforms, one of the largest players in the forex market.
Insights Into Forex Flows
The EUR index keeps flying as the tightening of financial conditions go from bad to worse. Still, on the way up, after the flash spike, the index has settled below its next logical target - the 100% projection target - after a failed retest to re-take it. The bullish outlook is undeniable with the VIX at such an insanely elevated level, which is forging the unwind of carry trades as the trade of this short 2-month new century so far, with the Euro poised to be bought on dips as the structure suggests across all timeframes, including the 4-hour chart below.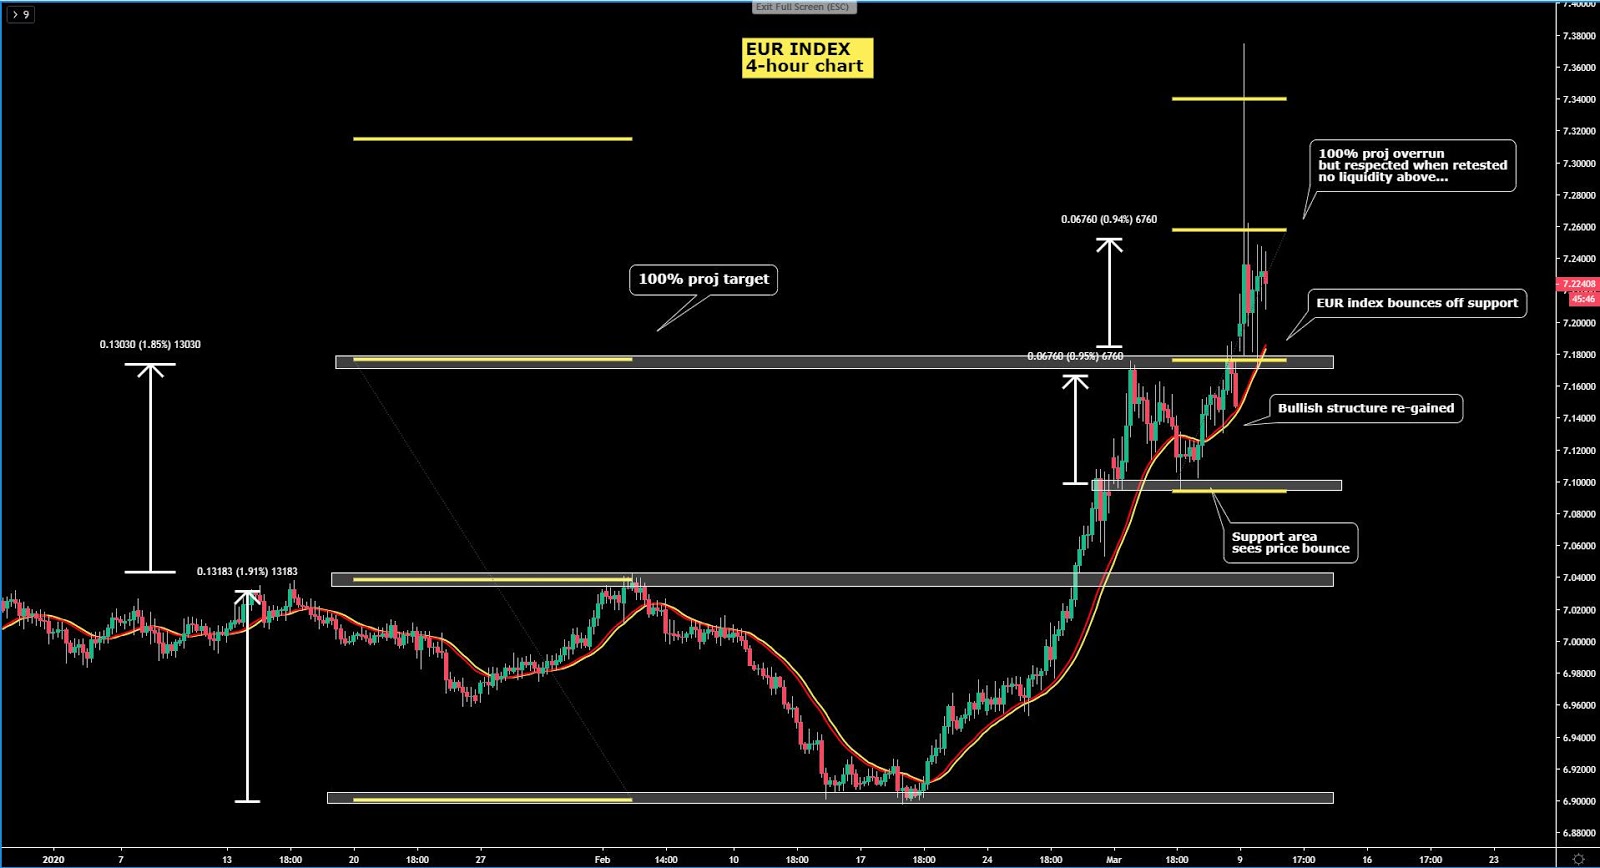
The GBP index is a relative sideshow compared with some of the moves seen so far, a fiat useful to tap into for diversification purposes amid the fall out of high-yielding currencies. The Pound has been stubbornly strong in line with the fortitude of other European currencies (EUR, CHF). The negative prospects towards half of the G8 FX space (USD, CAD, AUD, NZD) on the basis of ‘risk-off’, unwind of carry trade structures has so far benefited the Pound, as the market’s focus moves temporarily away from the UK/EU trade talks amid such treacherous conditions.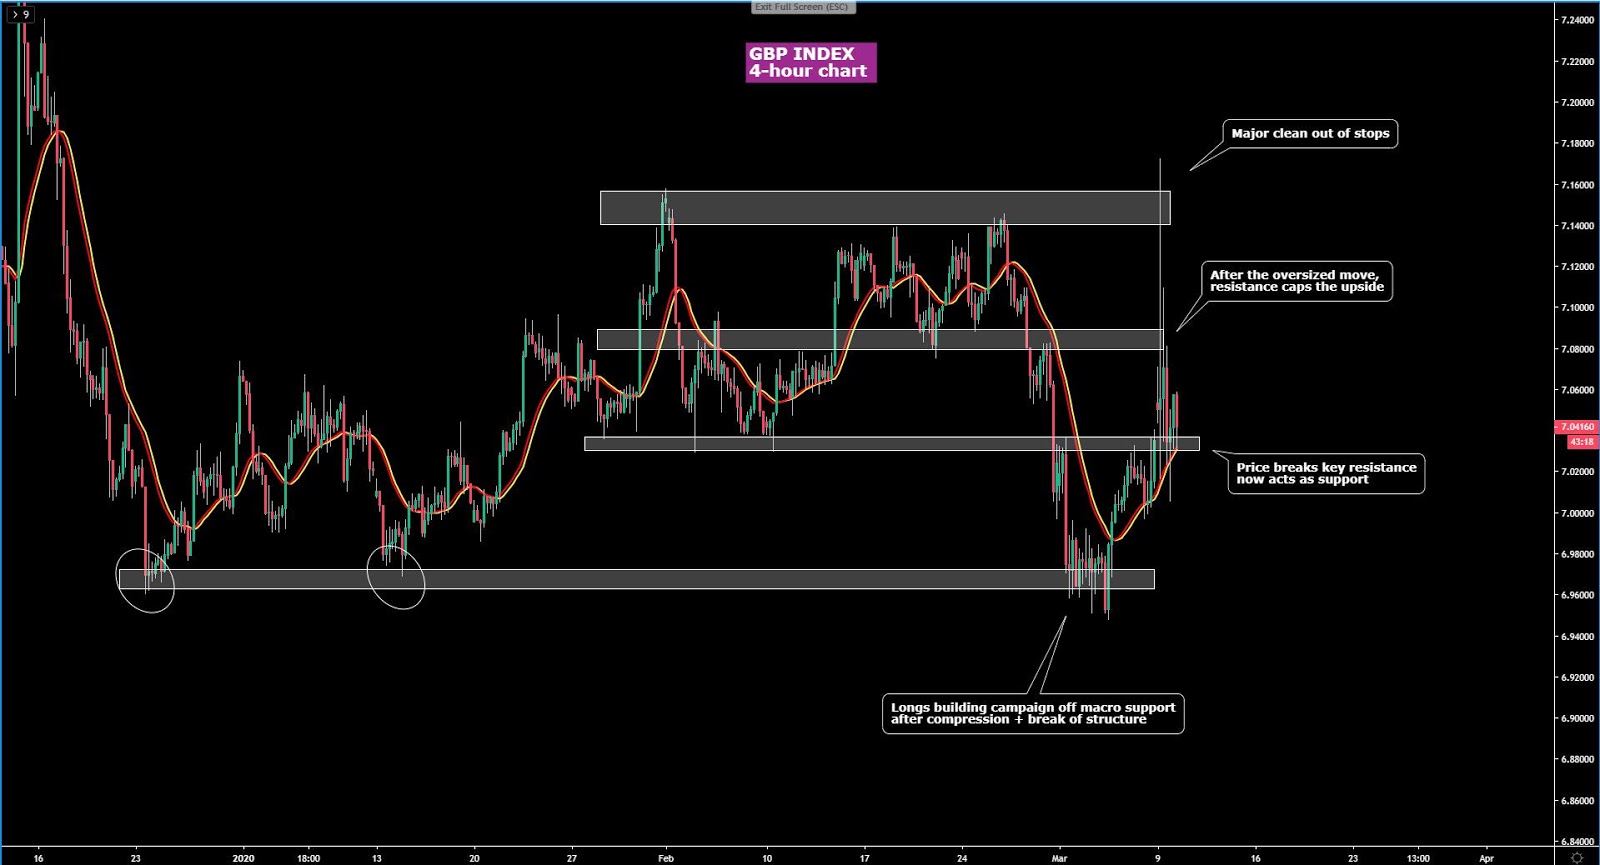
The USD index is quickly moving towards its worst levels of the year as the gains made through Jan and Feb get evaporated in a matter of weeks. The combination of a market fast pricing in the return of liquidity injections by the Fed via an outright balance sheet expansion reminiscent of the QE era, alongside the rapid decay of carry trades is weighing on the USD. Sooner or later, if the distorted market movements leading to ‘risk-off’ become the new norm, it’s expected that the USD will attract greater capital flows, although much will depend on the upcoming set of policy actions by the Fed to address the capitulations witnessed.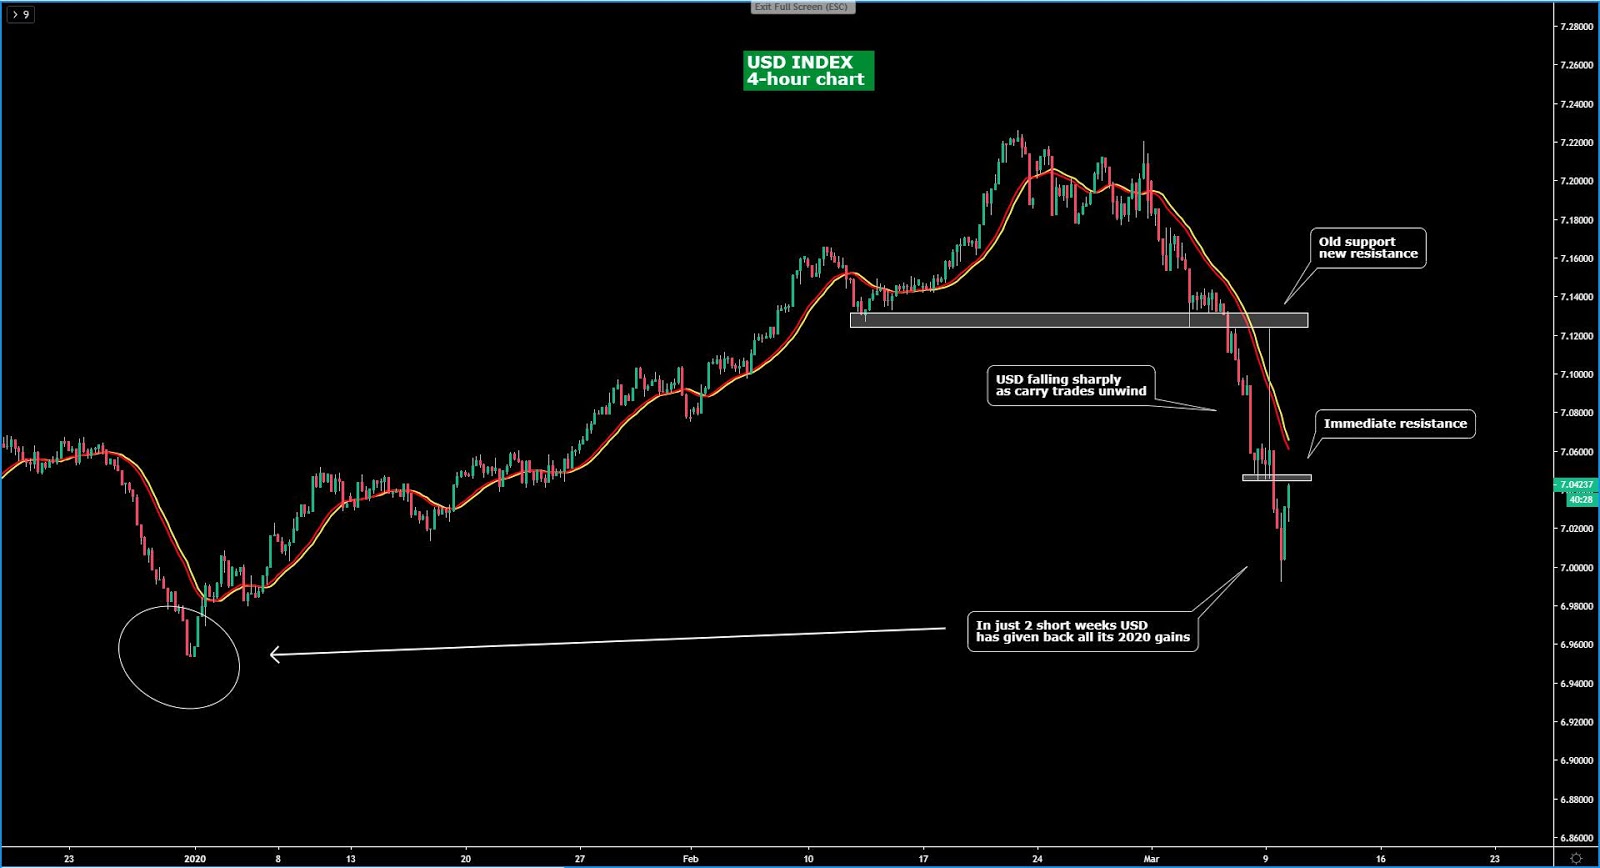
The CAD index can be best defined as having gone through a perfect bearish storm. The logic behind the debacle of the currency is three fold. (i) Huge unwind of carry trades, (ii) Expectations of further aggressive measures to ease by the BOC (iii) Most importantly, an all-out Oil price war thrown into the mix which saw Oil get busted in a historical move. As suggested, given the outsized vol, CAD shorts look out of whack unless you are looking to scalp this market.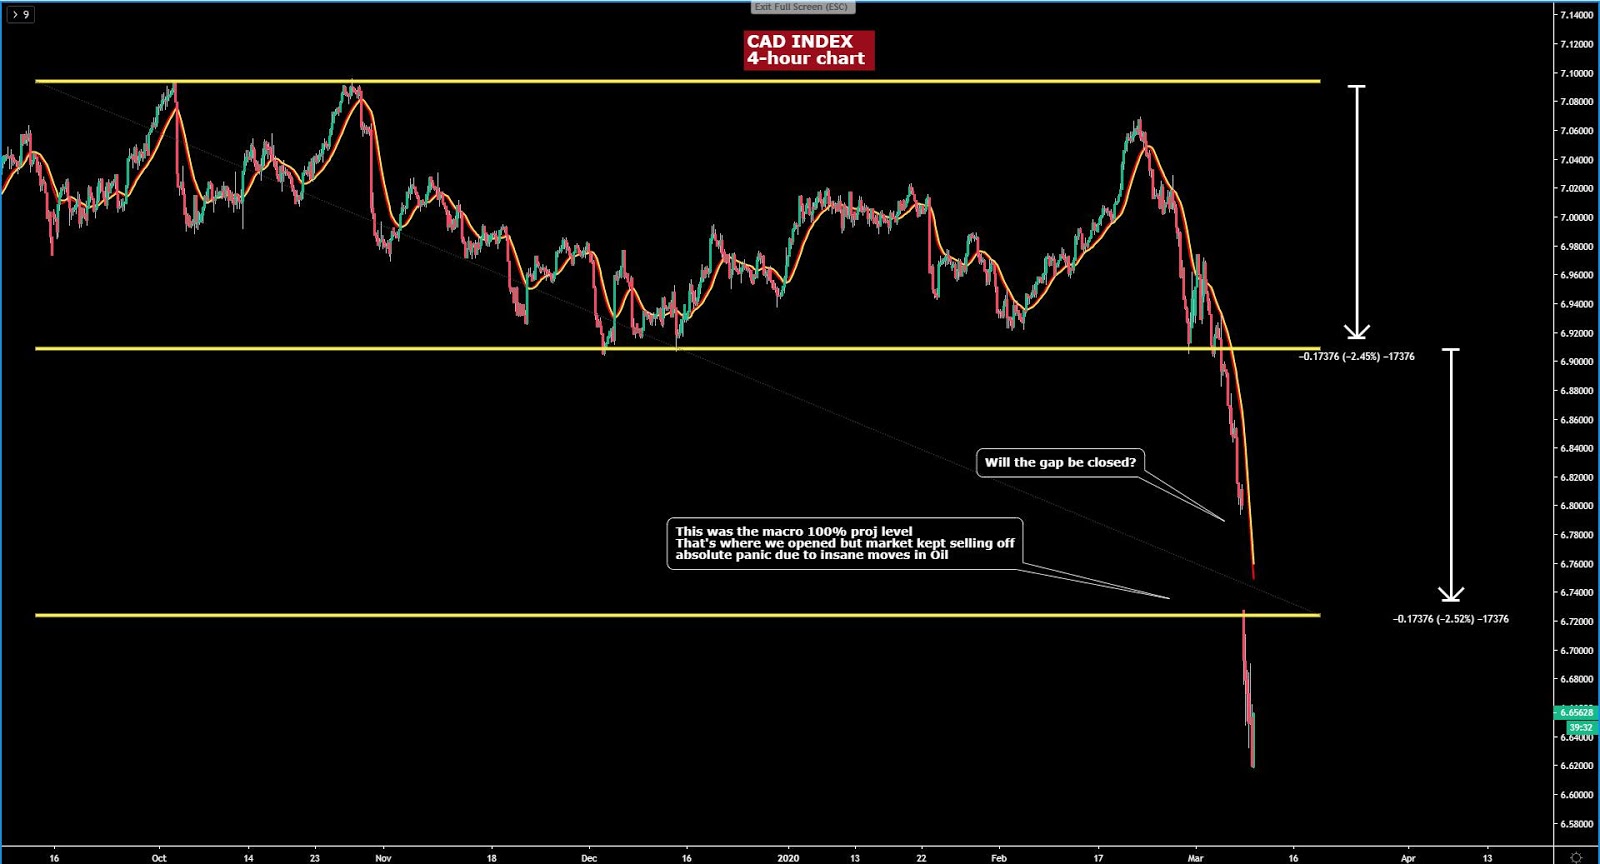
The JPY index is showing levels of volatility that have rivaled anything I have seen in the past several years. One will probably have to go back to 2008/2009 to draw parallels. Risk-off moves were out of control, with circuit breakers kicking in on equity and bond markets, which speaks volumes of the intense, disorderly, and unrelenting movements. The frantic amount of interest to join the JPY bid has caused all types of technical targets to be thrown out of the window as the market suffered from a worrying lack of liquidity in the last Asian session. The bias off the 4-hour chart remains very bullish, and despite technically unattractive to engage in longs, the dislocation in capital flows is definitely a big driver to keep seeing Yen strength.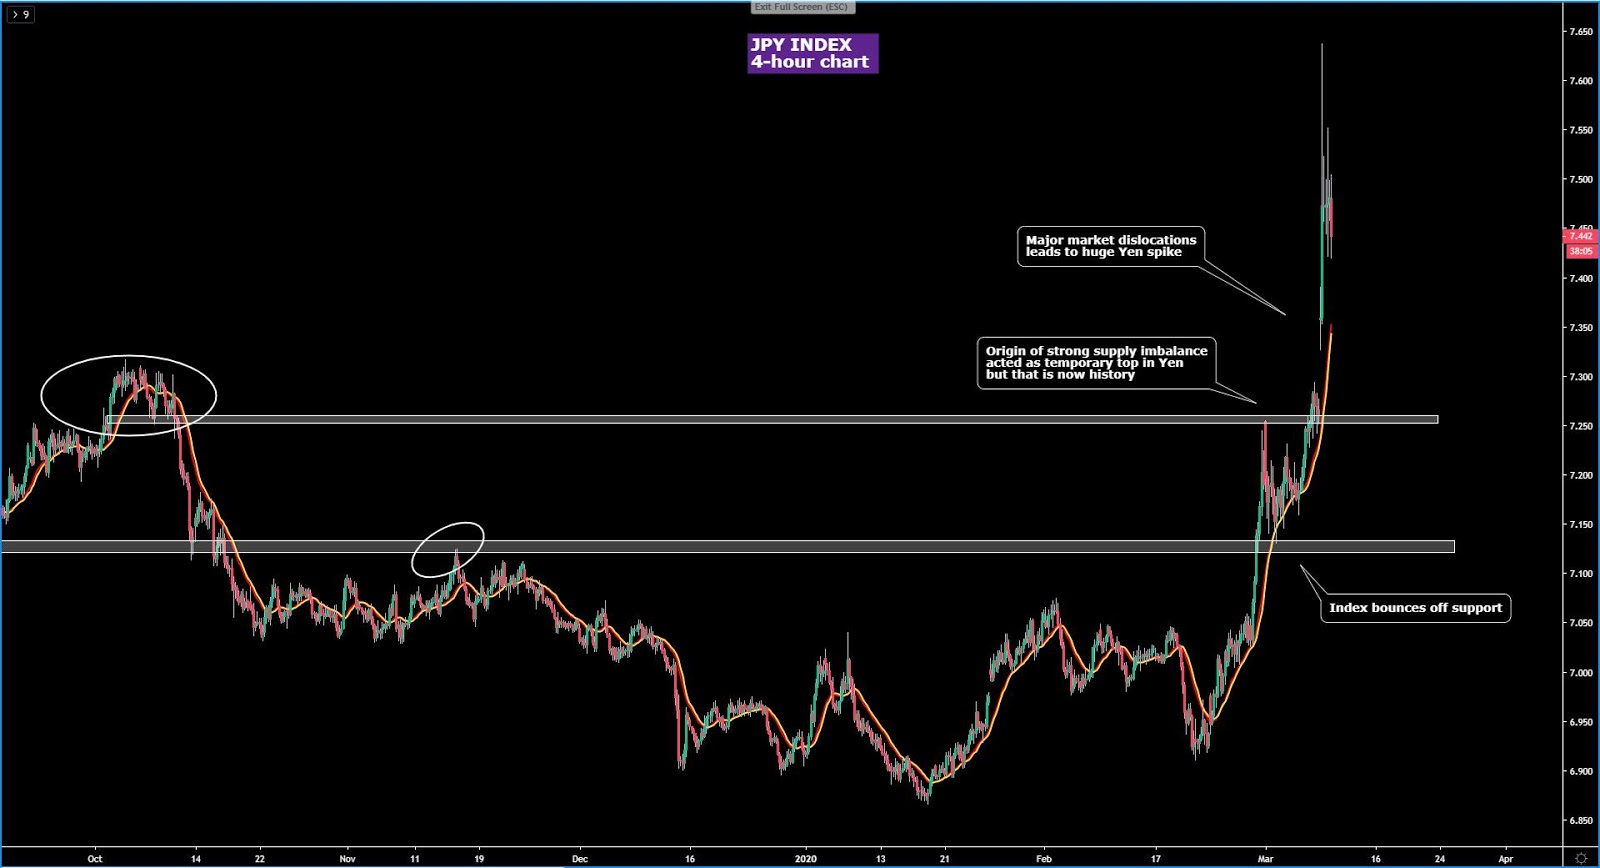
The AUD index, which is widely recognized in the trading floors as a growth-currency, meaning that it tends to perform best in times of economic bonanza globally, continues to take the toll of the calamitous market conditions witnessed. The action seen so far strengthens the bearish case, as bulls were once again taken to the cleaners as the previous low was taken out, even if the buy-side interest that existed ever since the flash crash has been impressive. All signs keep pointing at weaker levels in coming days and weeks as the COVID, Oil crisis plays out.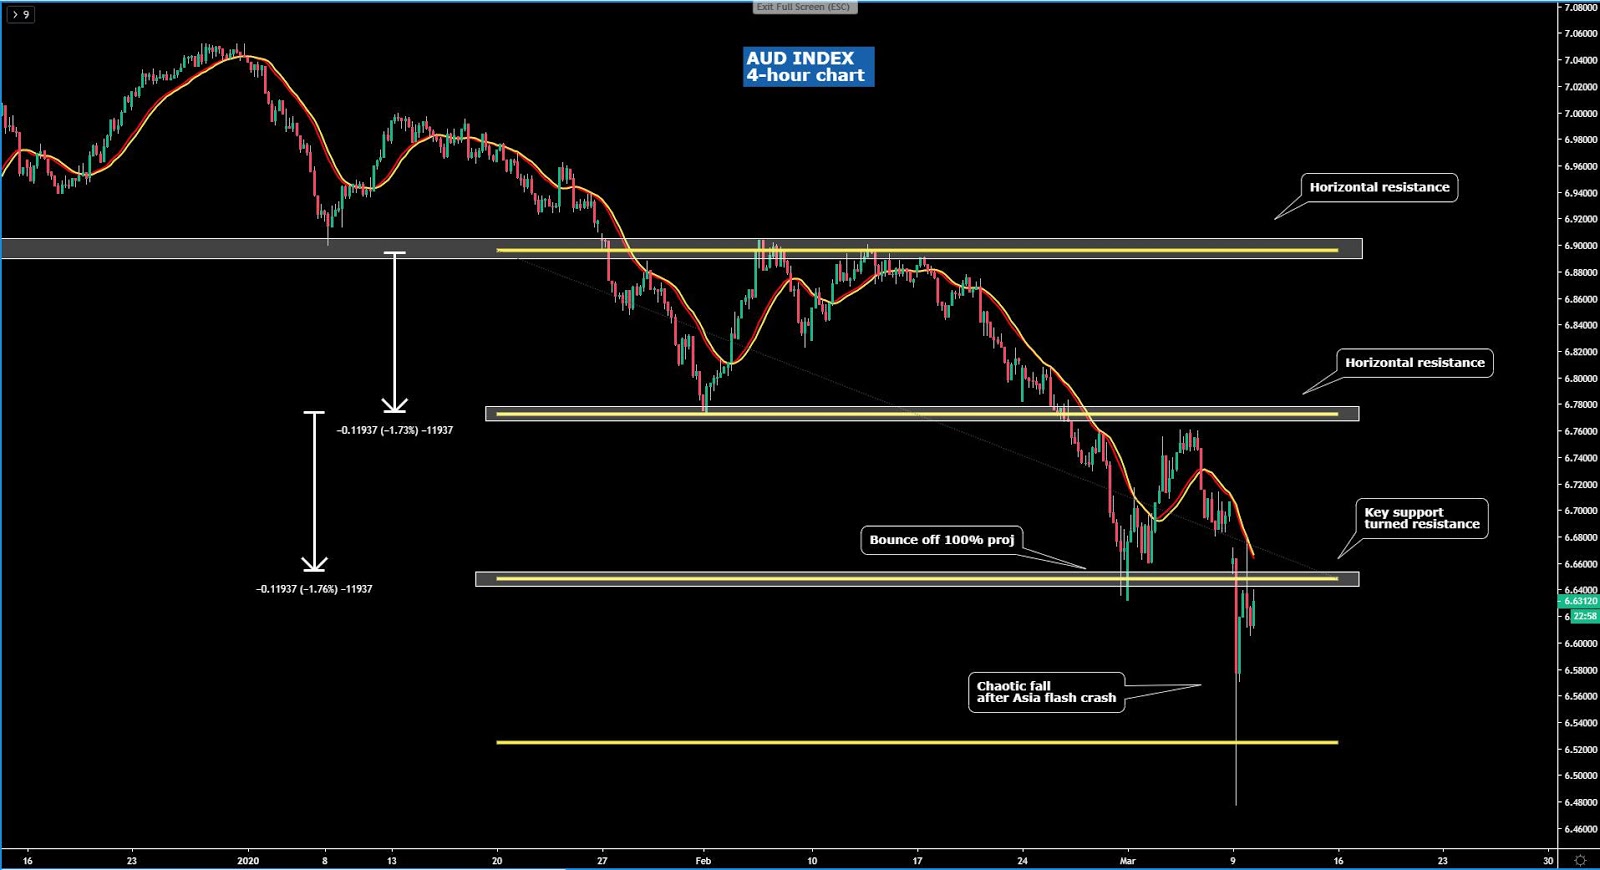
The NZD index had a round trip the likes of what I had not seen since the GFC more than 10 years ago. The sell-side pressure that came through the books in Asian was fully reversed, even if that V-shaped reversal was not sufficient to invalidate the bearish market structure off the 4-hour chart. The NZD has been the most vulnerable currency out of the G8 FX space during the COVID-19 crisis as a global recession has severe implications for the relatively small and exports-driven NZ economy. Yesterday, I argued that the unwind of carry longs has also hit the NZD as the currency offered relatively decent rates compared to funding fiats.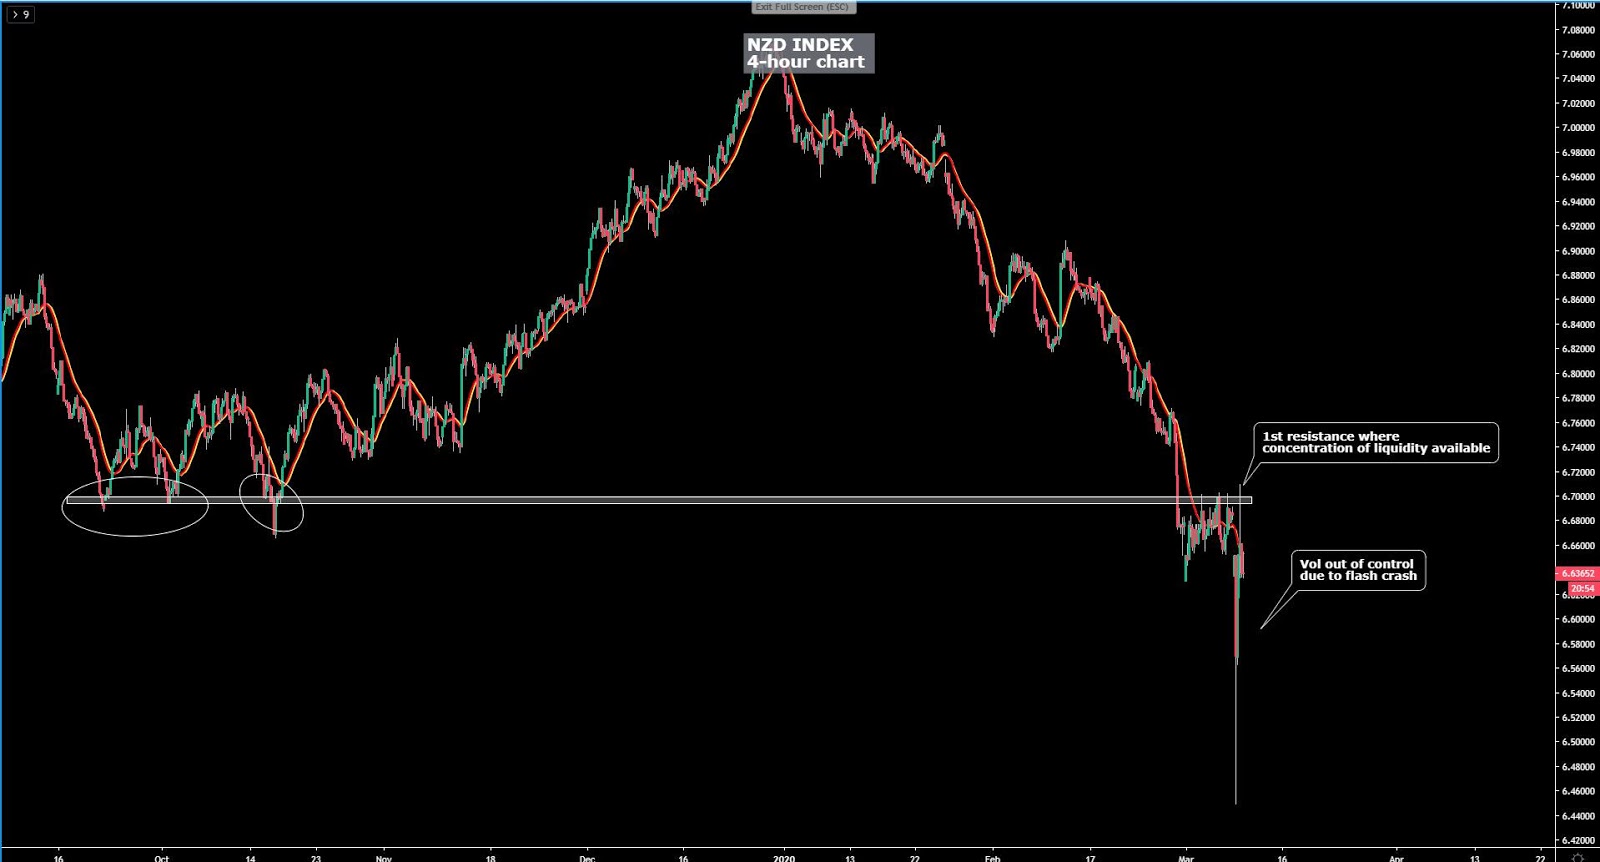
The CHF index appreciated violently. The epic unwind of carry trade positions and the disastrous risk-off dynamics are music to the ears of CHF long speculators. By assessing the chart below, it’s hard to ignore the power of symmetrical targets in Forex, with the CHF index the perfect case in point. Notice that off the original bracketed area outlined in a white rectangle, do you mind checking what are the levels acting as resistance on the way up? Each and every 100% proj sequence, without exception... Coincidence? Hopefully by now I've proven through enough examples how critical it is to have these areas marked. Buy dips remains the safest bet.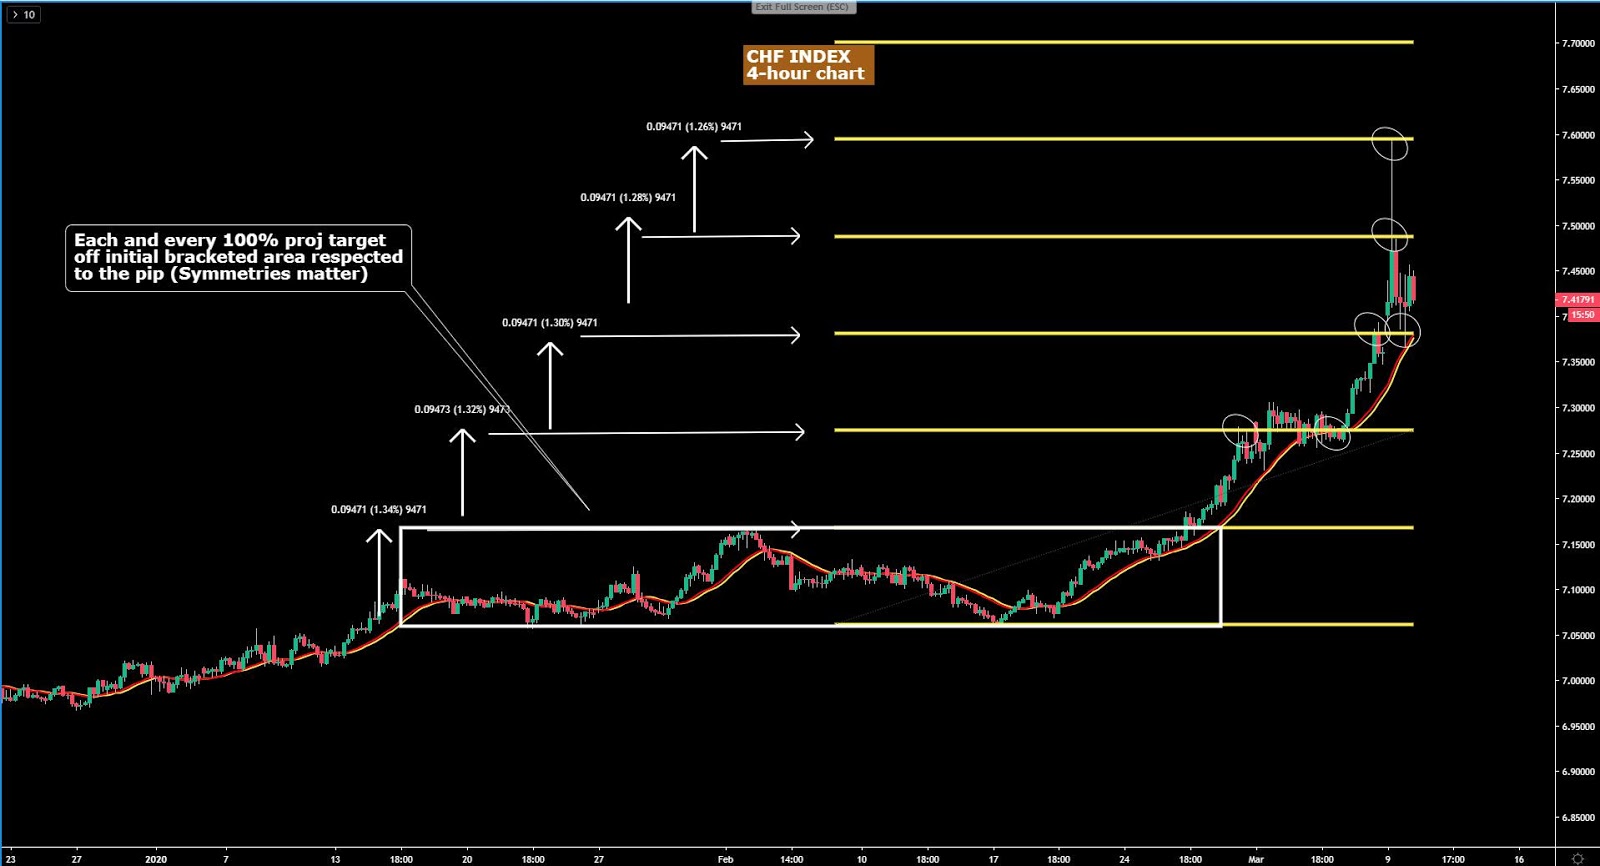
Important Footnotes
- Market structure: Markets evolve in cycles followed by a period of distribution and/or accumulation.
- Horizontal Support/Resistance: Unlike levels of dynamic support or resistance or more subjective measurements such as Fibonacci retracements, pivot points, trendlines, or other forms of reactive areas, the horizontal lines of support and resistance are universal concepts used by the majority of market participants. It, therefore, makes the areas the most widely followed and relevant to monitor.
- Fundamentals: It’s important to highlight that the daily market outlook provided in this report is subject to the impact of the fundamental news. Any unexpected news may cause the price to behave erratically in the short term.
- Projection Targets: The usefulness of the 100% projection resides in the symmetry and harmonic relationships of market cycles. By drawing a 100% projection, you can anticipate the area in the chart where some type of pause and potential reversals in price is likely to occur, due to 1. The side in control of the cycle takes profits 2. Counter-trend positions are added by contrarian players 3. These are price points where limit orders are set by market-makers.
