Inflation I, the Good:
In our Roaring 2020s scenario, a productivity growth boom boosts real GDP growth, keeps a lid on inflation, drives up real labor compensation, and widens profit margins. Last week’s Productivity and Costs report compiled by the Bureau of Labor Statistics (BLS) mostly included revised data for Q3-2024, which mostly supported this upbeat outlook.
The most significant revision was in unit labor costs (ULC), which determines the underlying inflation rate in the labor market. It is calculated by BLS as hourly compensation divided by productivity. Q3’s ULC in the nonfarm business sector was revised down 1.1 percentage points to an increase of 0.8% (saar), reflecting an equivalent downward revision in hourly compensation to an increase of 3.1%. ULC increased 2.2% y/y, down from the 3.4% prior preliminary estimate.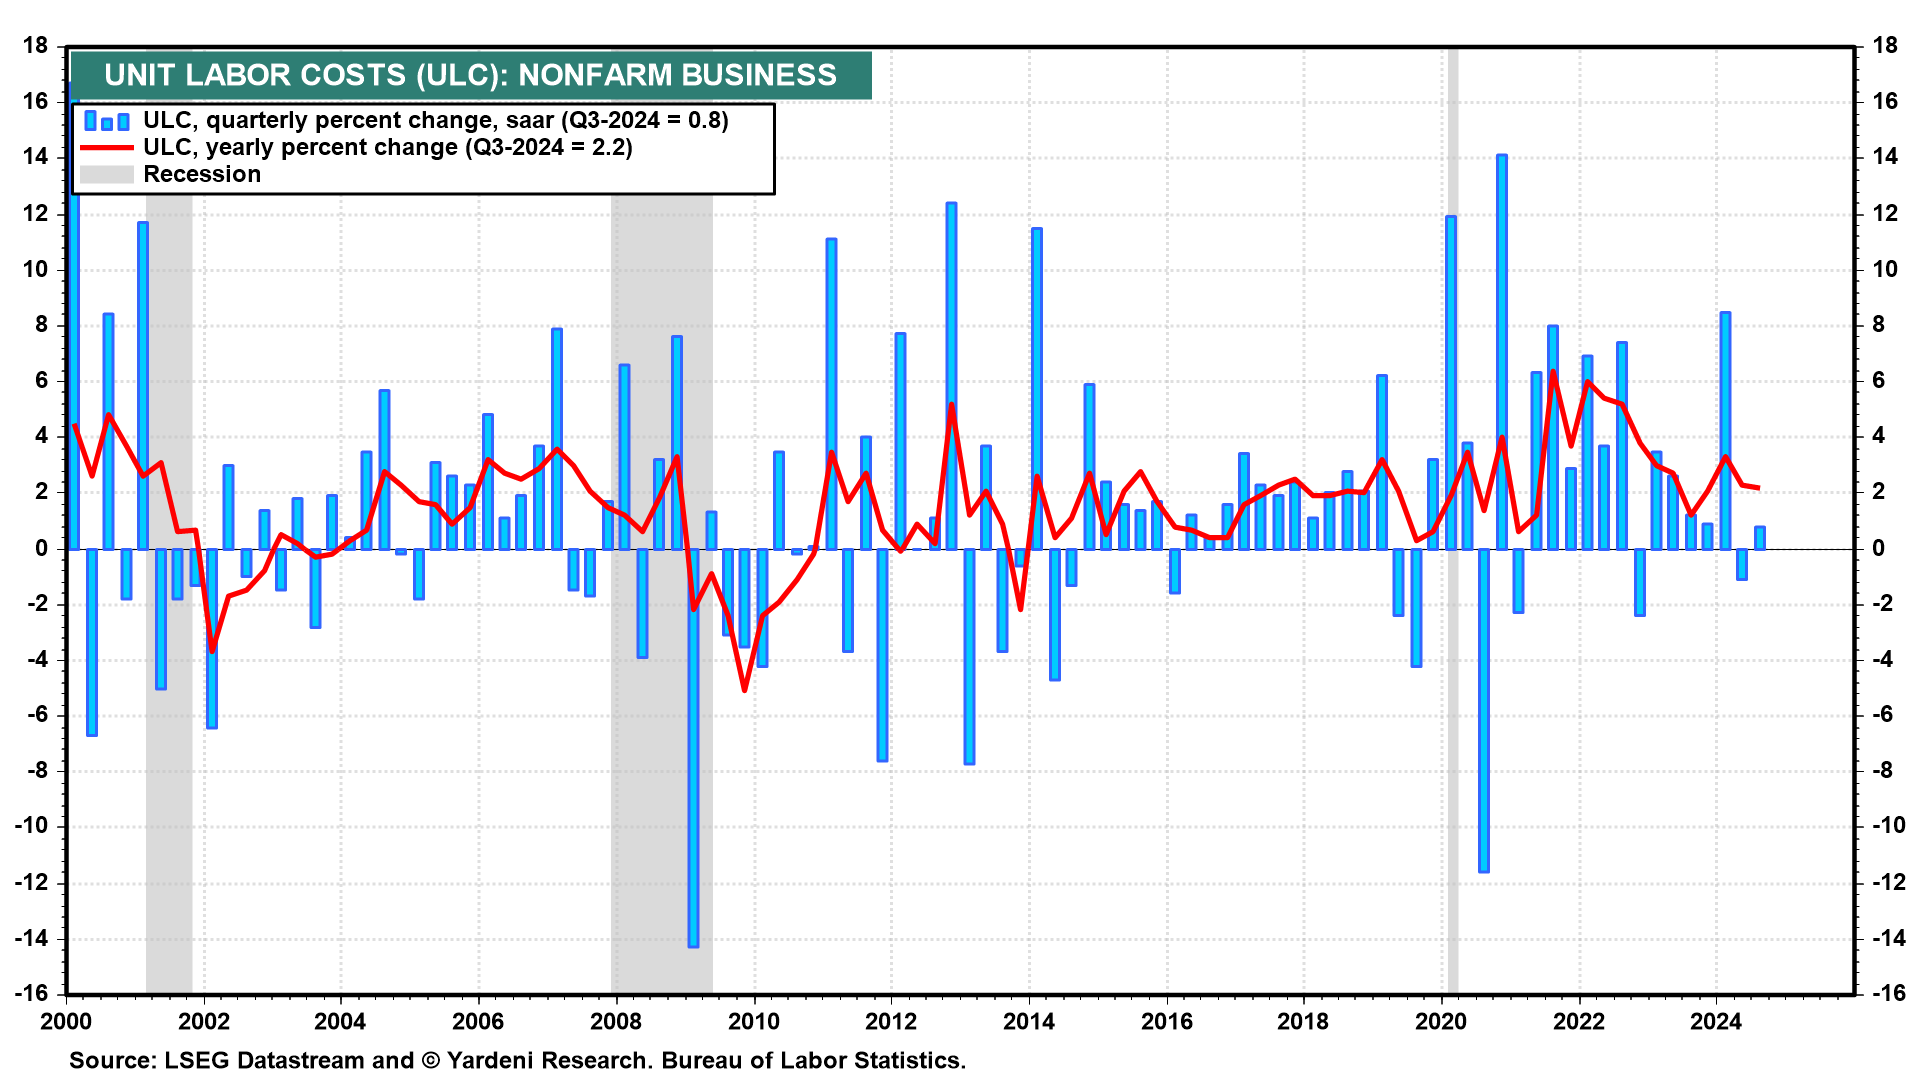
The y/y headline PCED inflation rate closely tracks the y/y ULC inflation rate. The former was up just 2.3% through October, while the latter rose 2.2%. Both are down from over 6.0% in 2022. In other words, the decline in the ULC inflation rate was the major reason that consumer price inflation has moderated since its summer 2022 peak.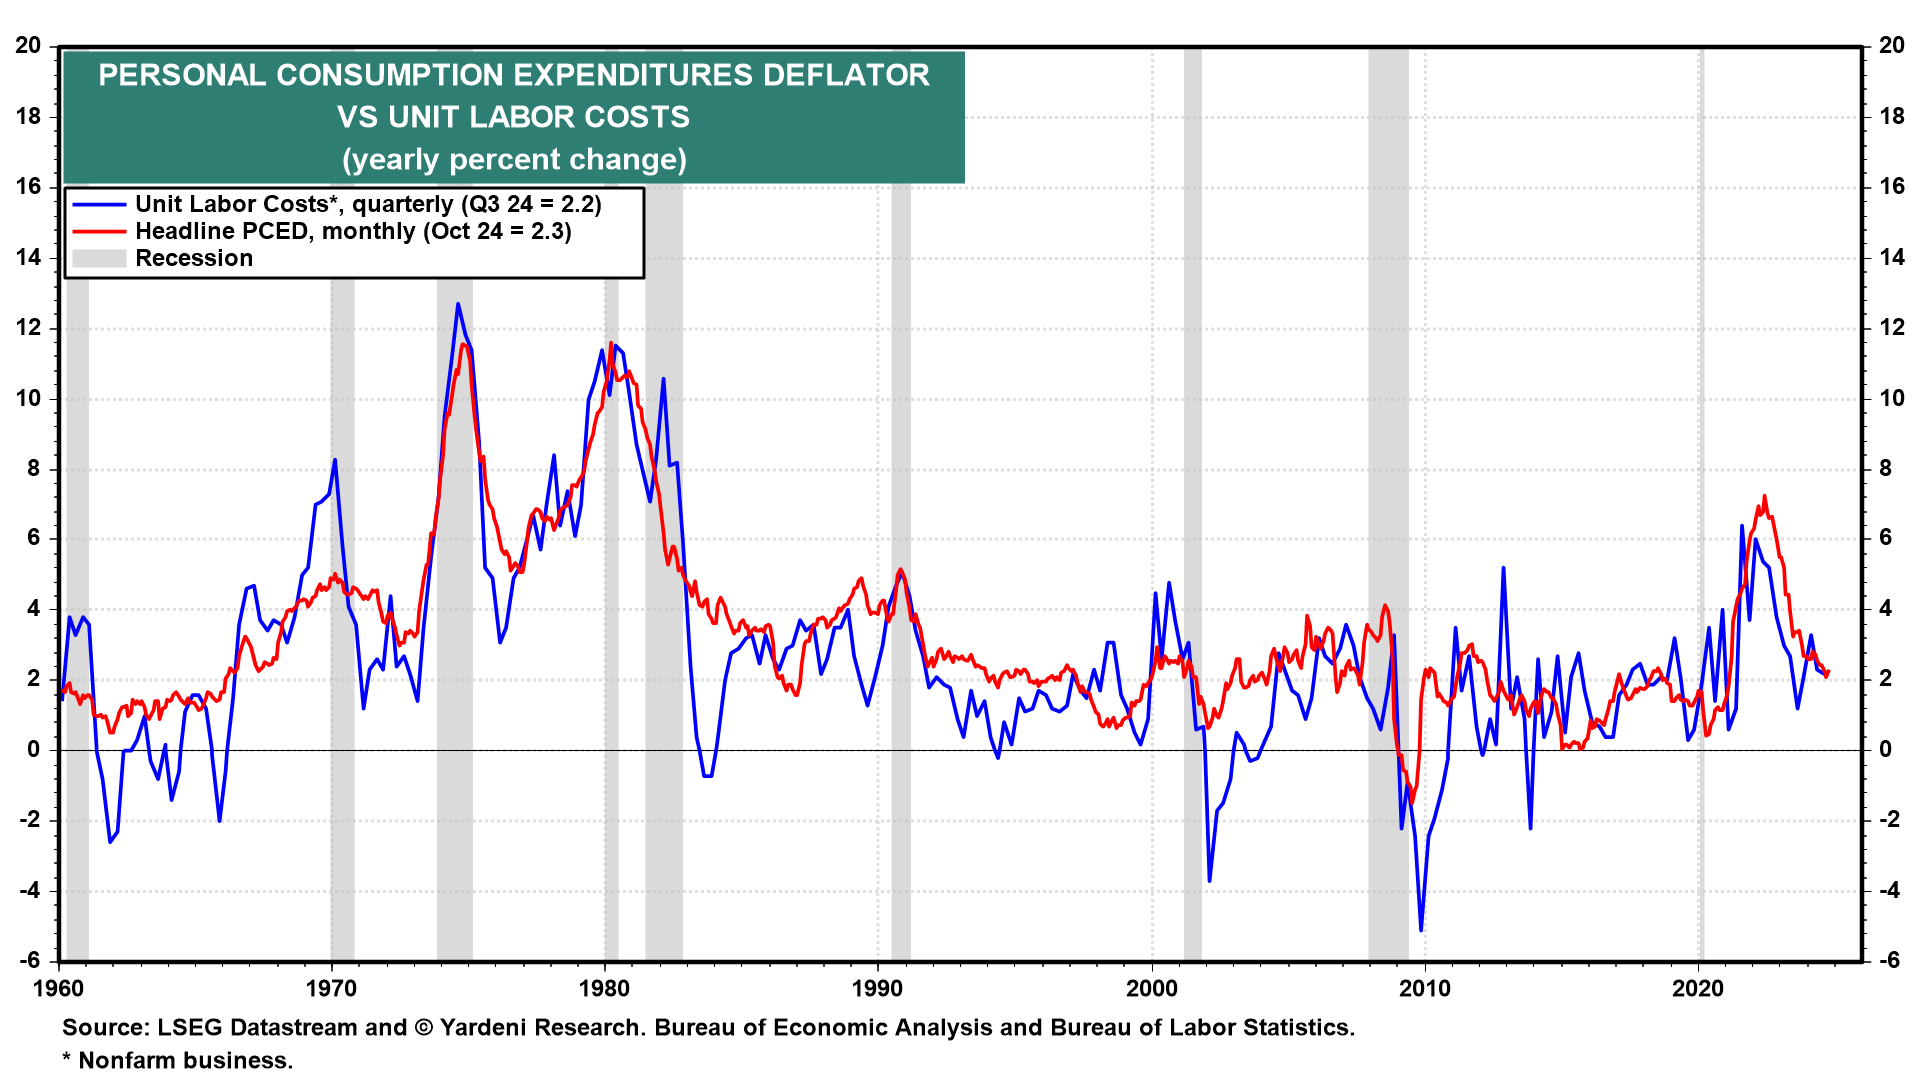
During the summer of 2022, Debbie and I predicted this moderation in the PCED inflation rate. We expect it will remain in the current 2.0%-3.0% range through the end of 2025 and probably through the end of the decade. However, we have some concerns that the Fed’s current monetary easing campaign might revive inflationary pressures in the coming months by boosting demand for goods and services at the same time as fiscal policy remains very stimulative.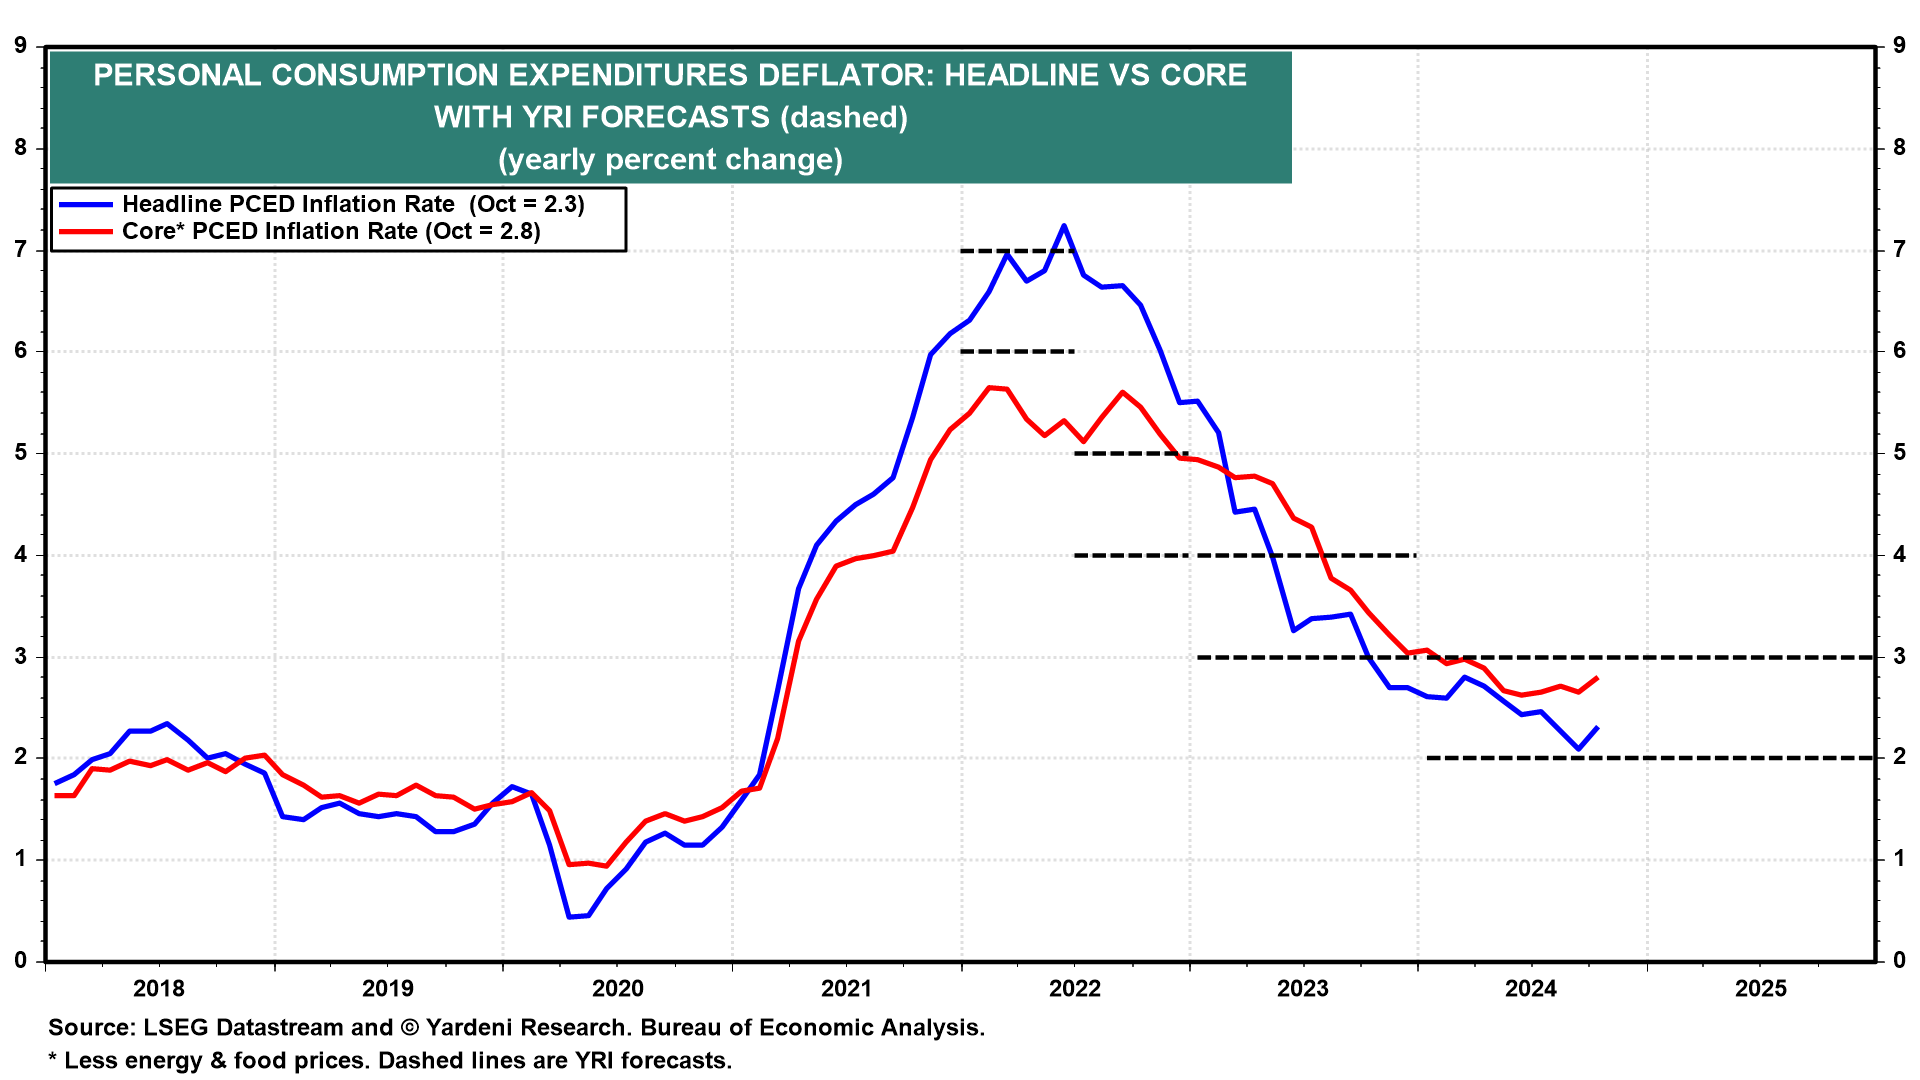
Regarding fiscal policy, Trump 2.0’s impact on inflation is a “known unknown.” Tax cuts would also boost demand for goods and services. Tariffs would likely cause a one-time increase in the inflation rate unless they are offset by a stronger dollar.
Deregulation should be mostly disinflationary. Reductions in federal government spending would also be disinflationary, but they aren’t likely to be significant enough to affect inflation much either way. More energy production could help hold down not only energy prices but prices broadly.
All these crosscurrents could make for a confusing and volatile inflation story next year. However, we are betting that productivity gains will keep a lid on ULC inflation and therefore overall inflation in 2025, and through the end of the decade, and possibly through the 2030s. Now let’s focus on the latest productivity and ULC data in the context of our Roaring 2020s scenario:
Booming productivity growth
Productivity growth is very volatile on a quarterly basis.
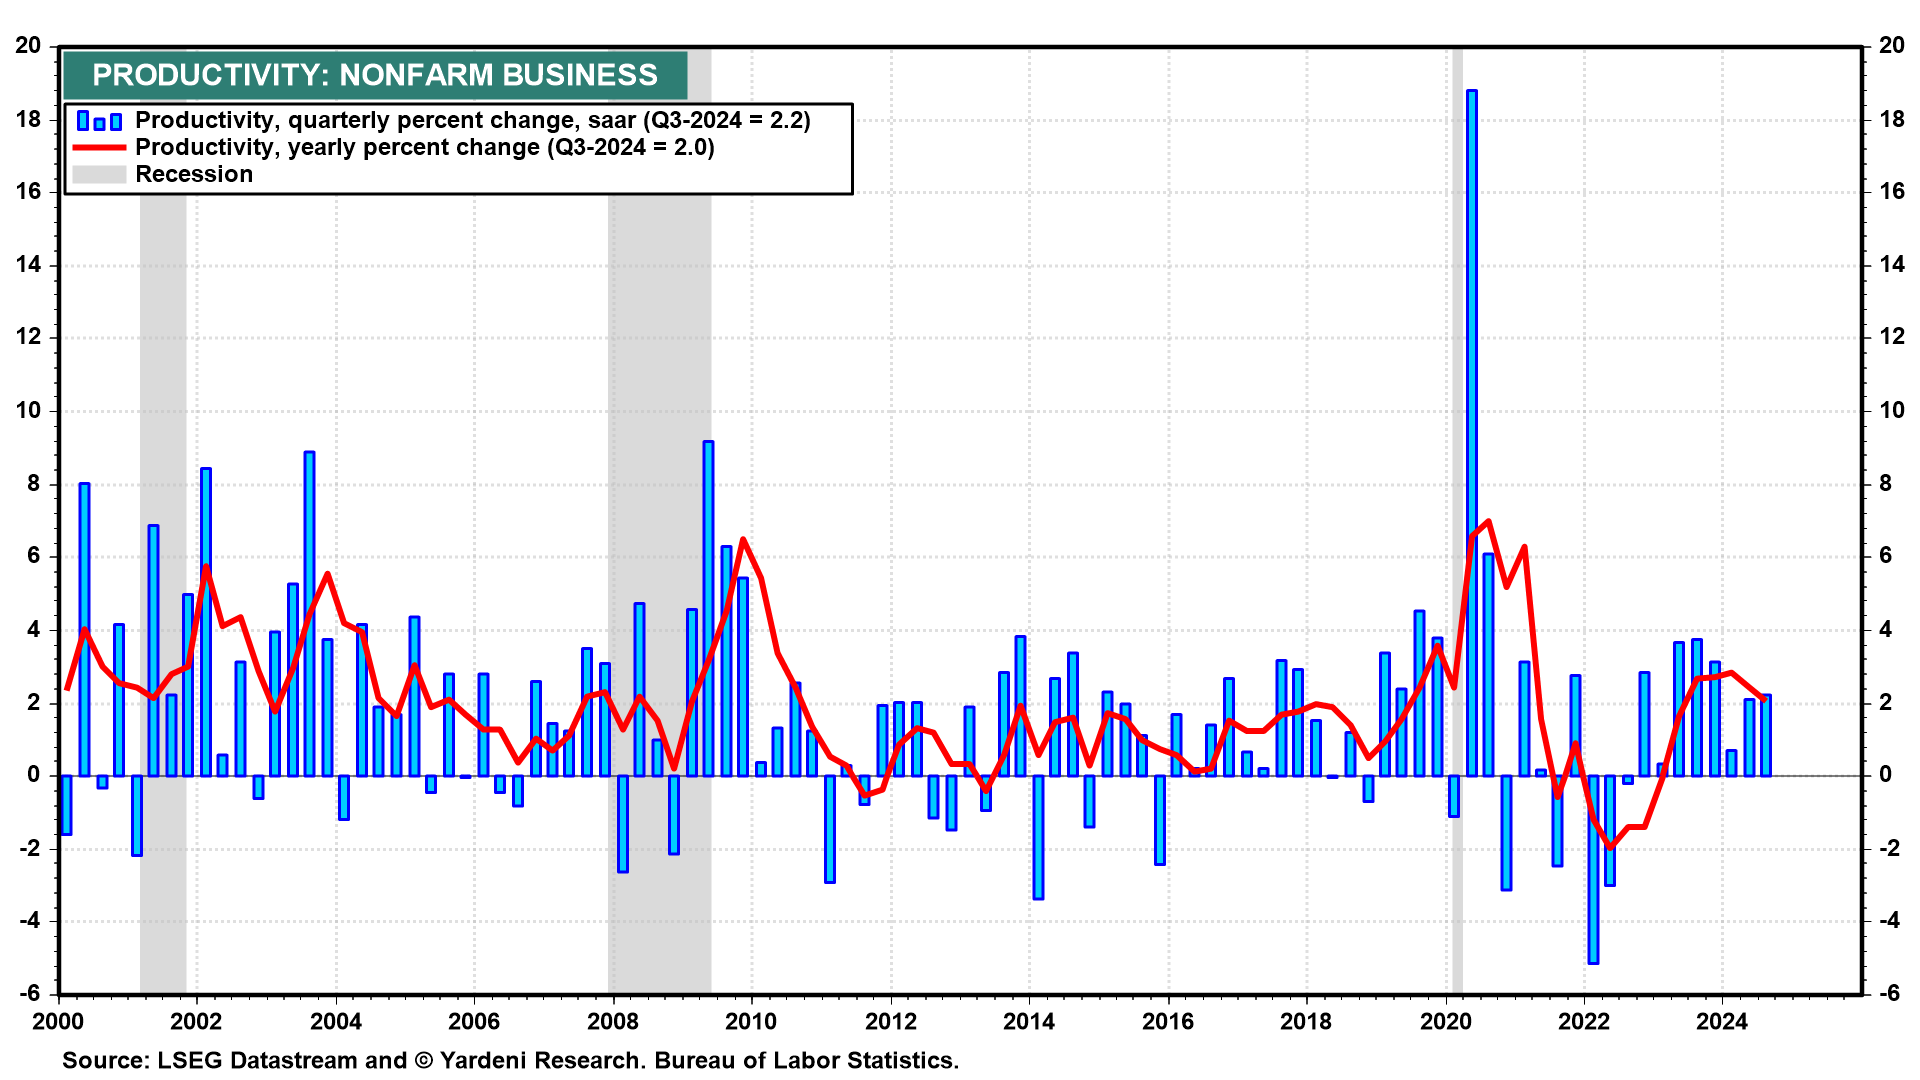
It is less so on a y/y basis. However, it is easier to see productivity’s major growth cycles by focusing on its 20-quarter percent change at an annual rate in the series provided by the BLS for the nonfarm business sector.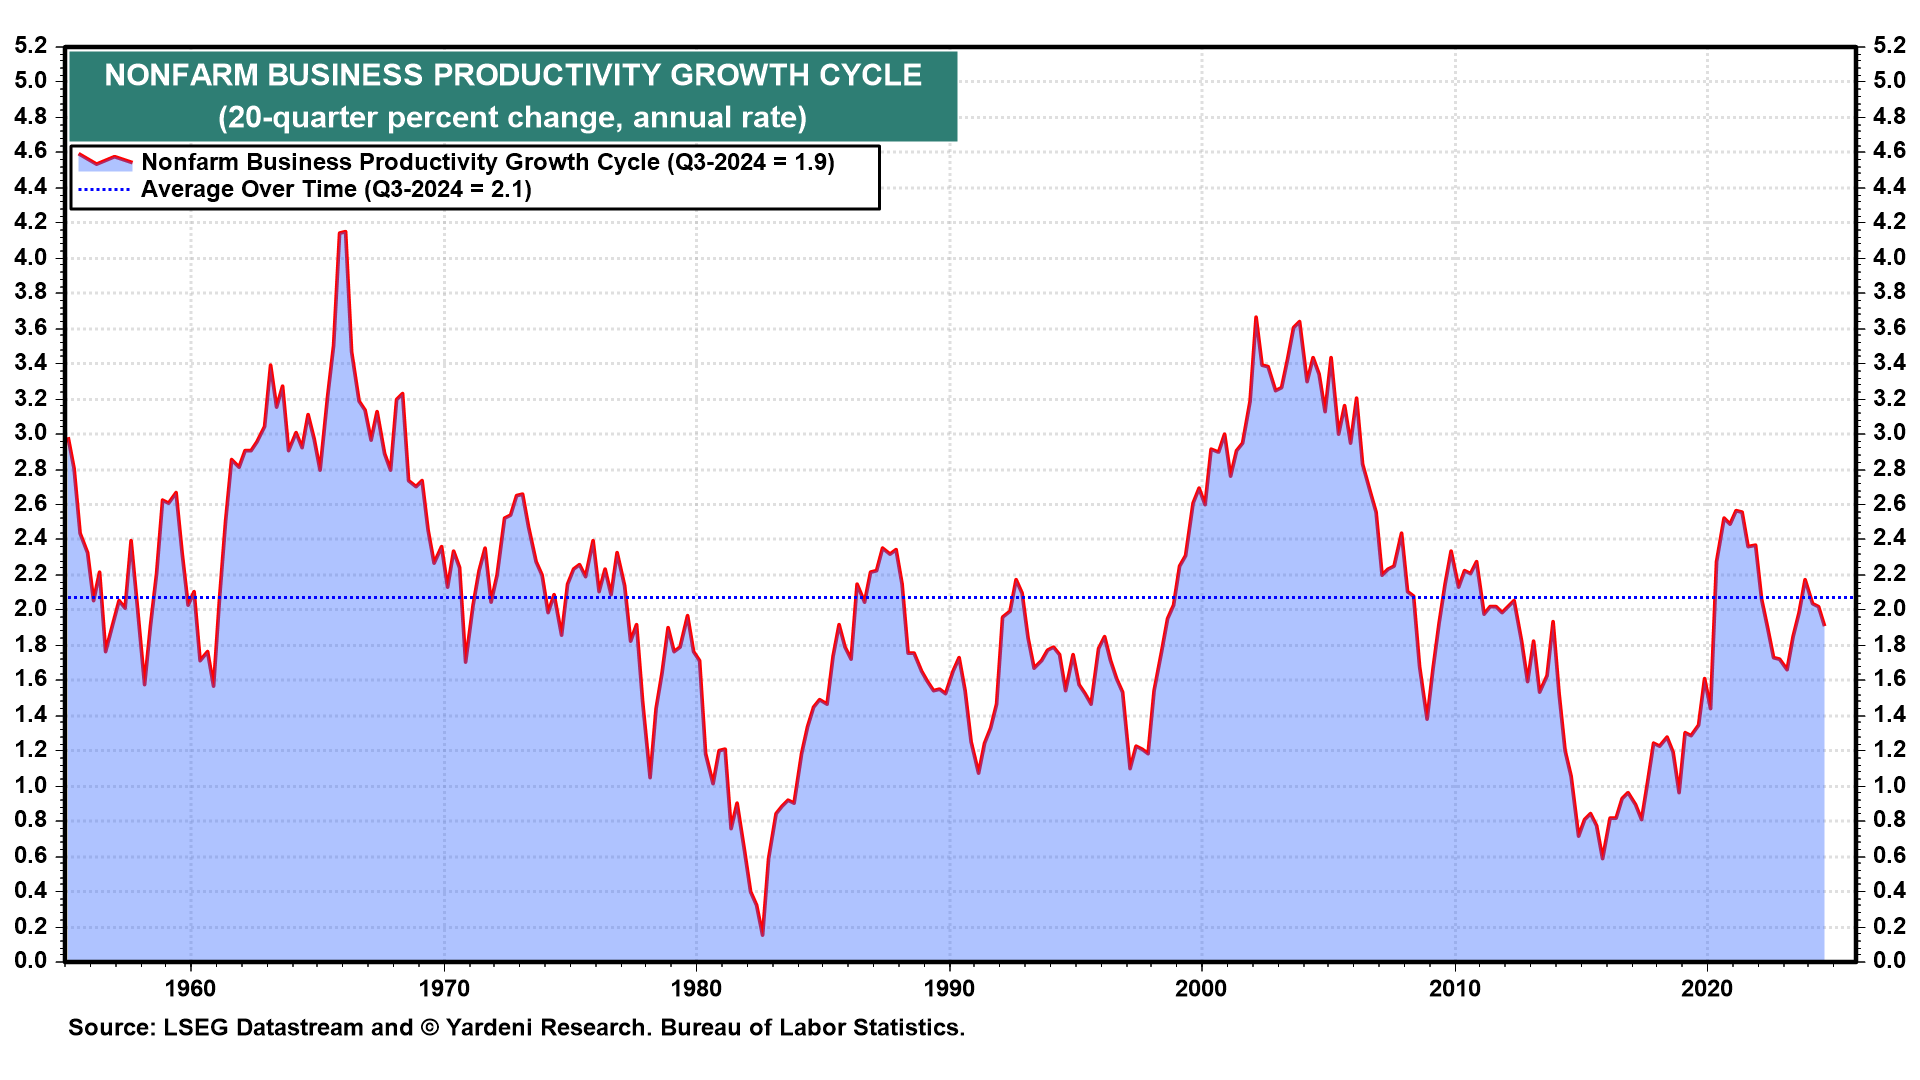
Based on the available data, there have been two major productivity growth busts—during the Great Inflation of the 1970s and during the first half of the 2010s after the Great Financial Crisis. There have been three distinct productivity growth booms including one in the late 1950s, another during most of the 1960s, and one during the second half of the 1990s. We think that a fourth one started during Q4-2015 when the trailing growth rate was just 0.6%. It rose to 1.9% by Q3-2024.
That’s almost a four-fold increase. However, at 1.9%, the rate is only back to slightly below its historical average of 2.1%—so far. As we’ve previously explained, we expect the current phase of the Digital Revolution to boost the trailing average of productivity growth we use to 3.5%, plus or minus 0.5%, by the end of the decade. This forecast might seem delusional, but it is consistent with the previous booms.
Productivity and real GDP
Productivity is defined as real nonfarm business output divided by hours worked in the nonfarm business sector. The growth rate of this measure of output closely tracks the growth rate of real GDP, both on a y/y basis. During Q3-2024, they were up 2.8% and 2.7%, respectively.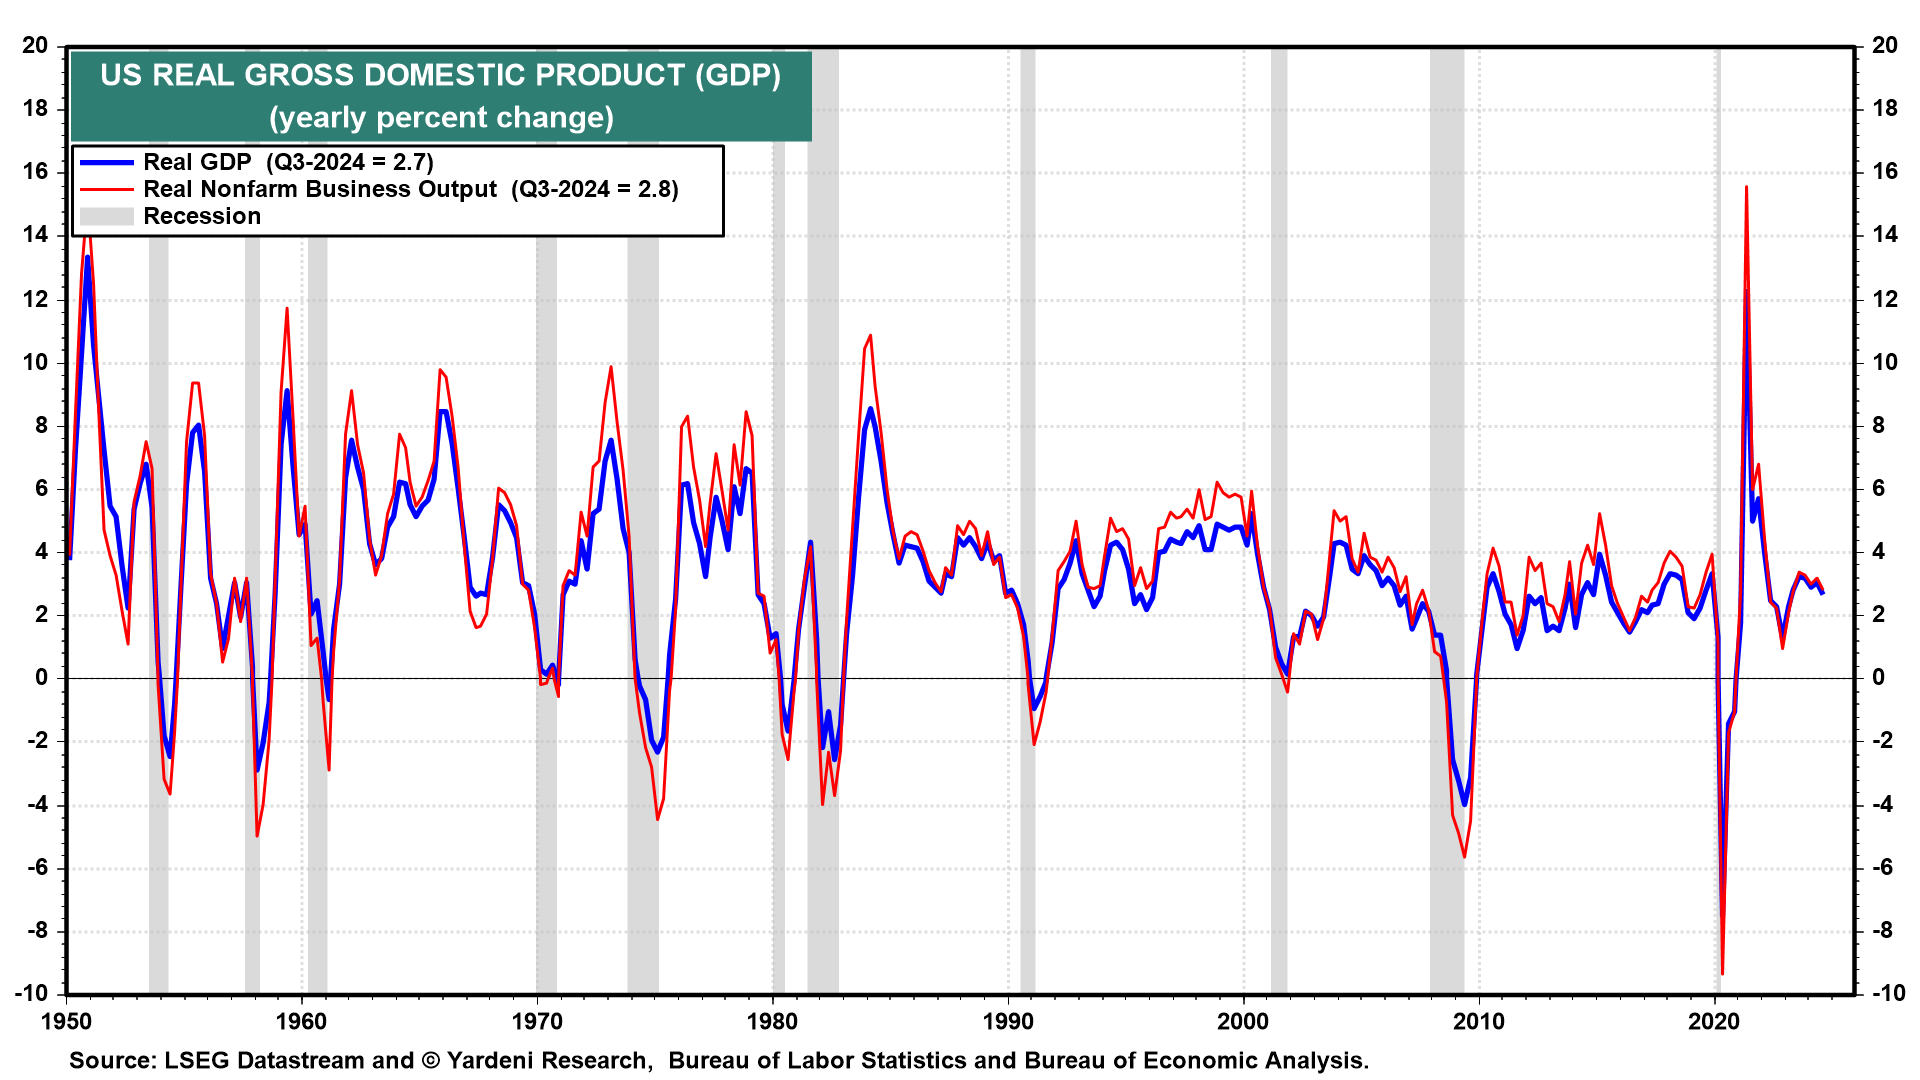
The arithmetic of real GDP is very simple: Its growth rate is the sum of the growth rates of productivity and hours worked. On average, since the start of the data in 1948, output is up 3.4%, while productivity is up 2.1% and hours worked is up only 1.3%.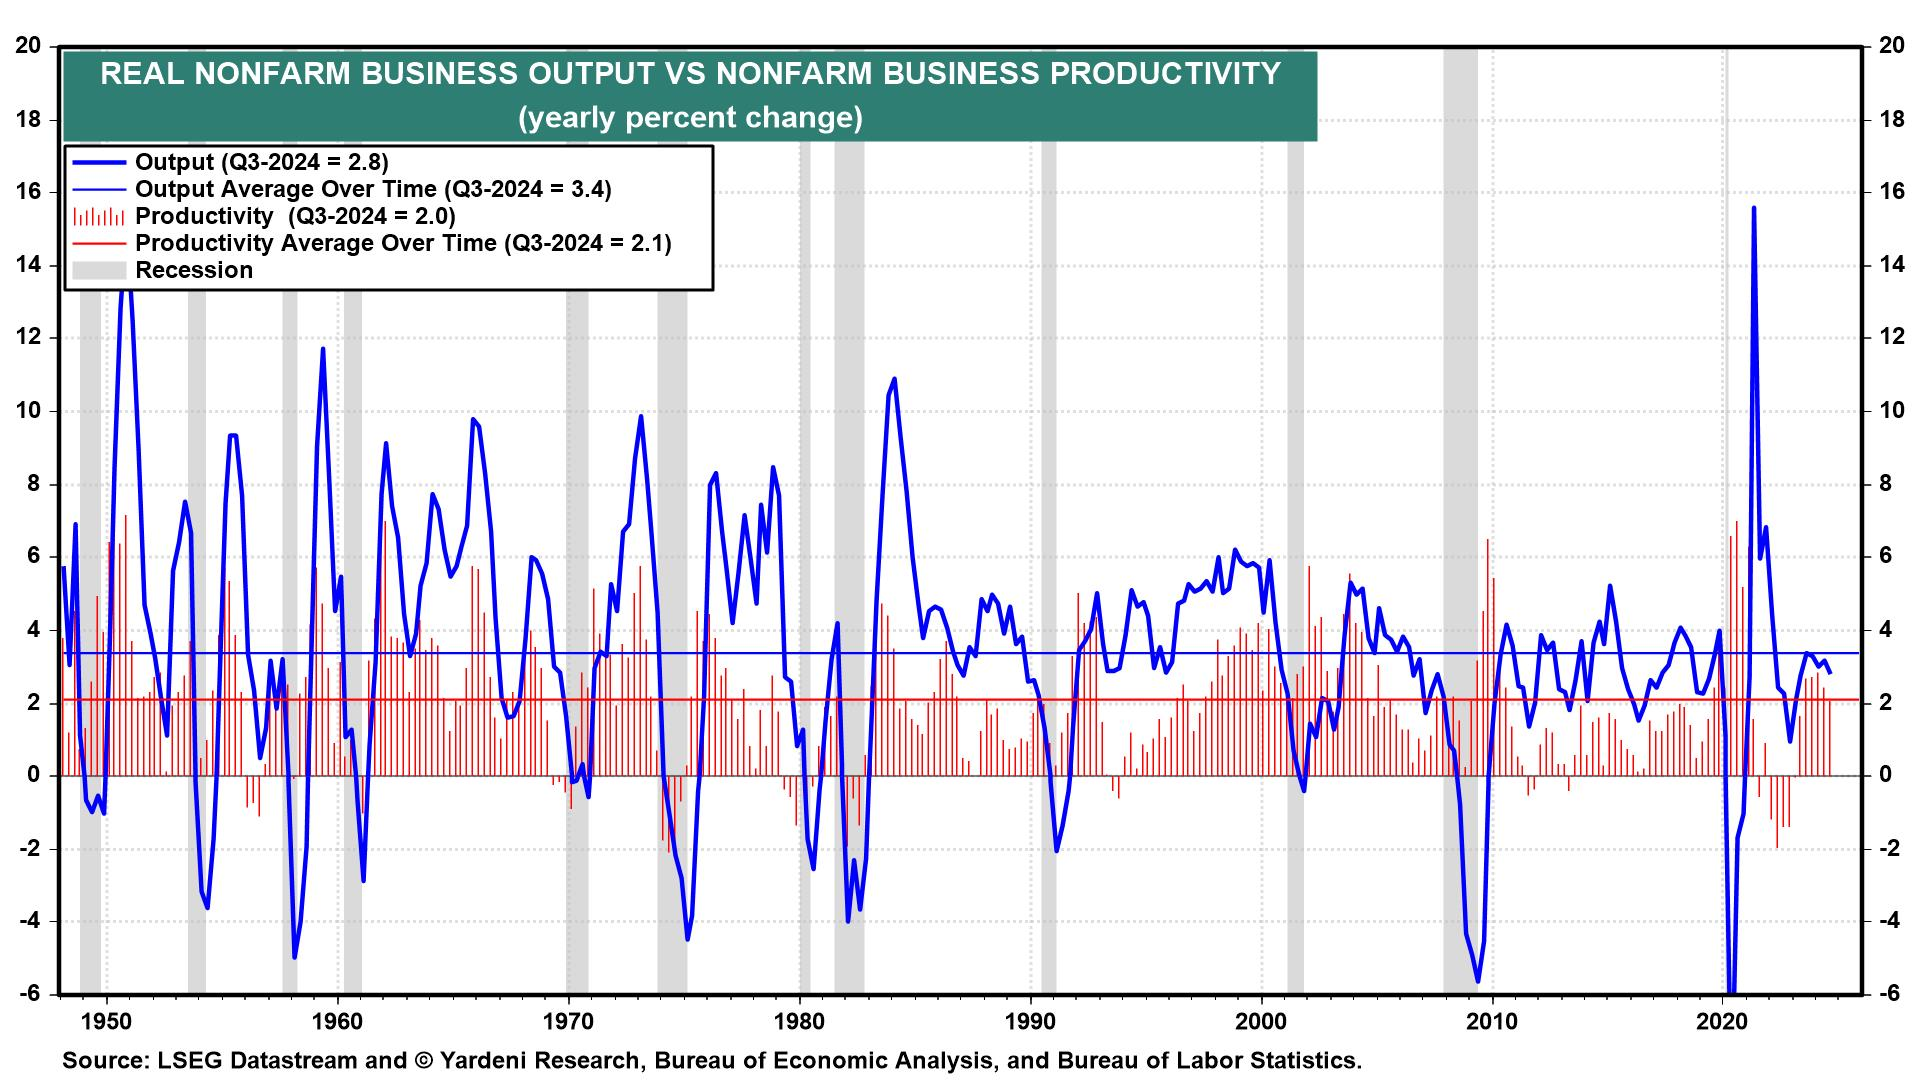
Productivity growth has been a major contributor to the growth rate of the economy. If it were to grow 3.5% with hours worked up 1.0%, real GDP would grow 4.5%. Is that conceivable? It is in our Roaring 2020s scenario. As noted above, it was achieved (and then some) during the previous productivity growth booms!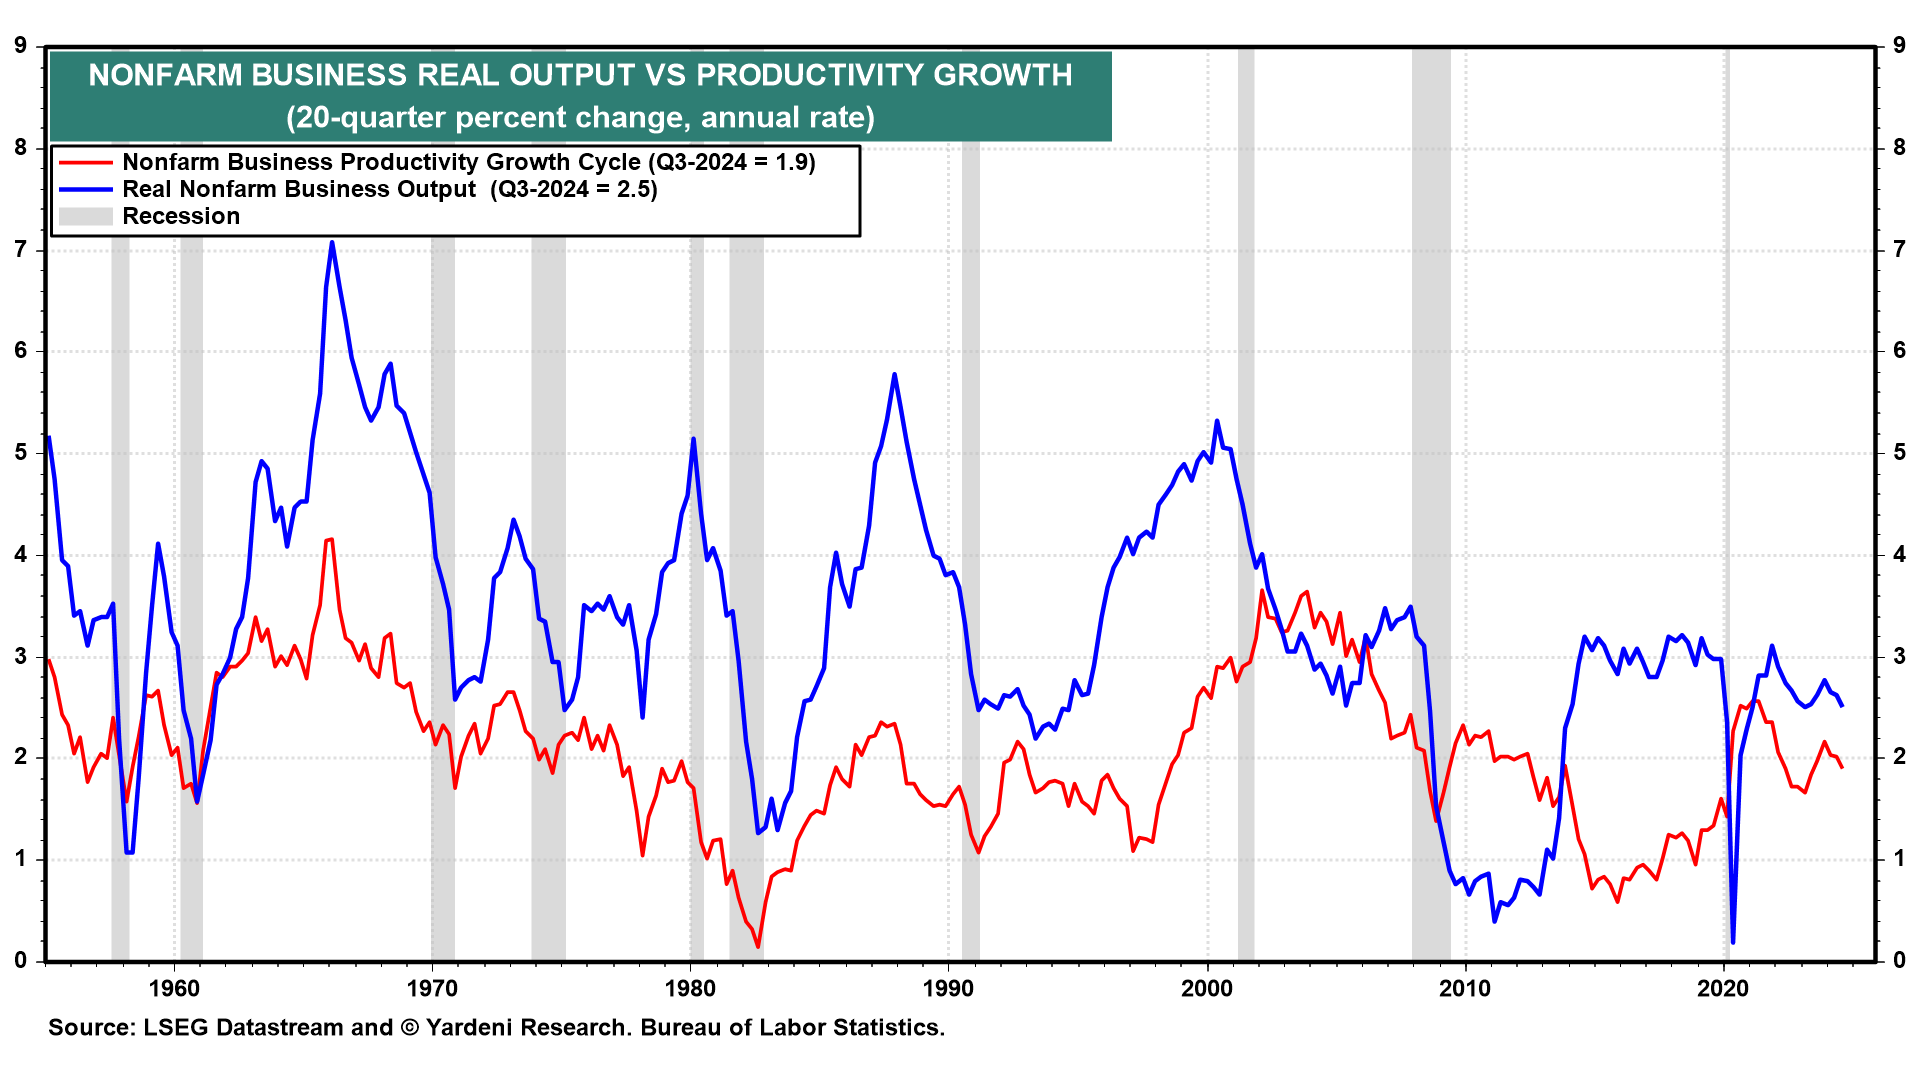
Productivity and hours worked
The average annual growth rate of hours worked has slowed significantly to only 0.6% over the past five years. We think this reflects a structural shortage of labor, especially skilled workers, which is one of the main reasons we believe that the economy is in the early stages of another productivity growth boom. This one has a lot going for it, especially lots of technological innovations that can augment the productivity of the available labor force in almost every conceivable business.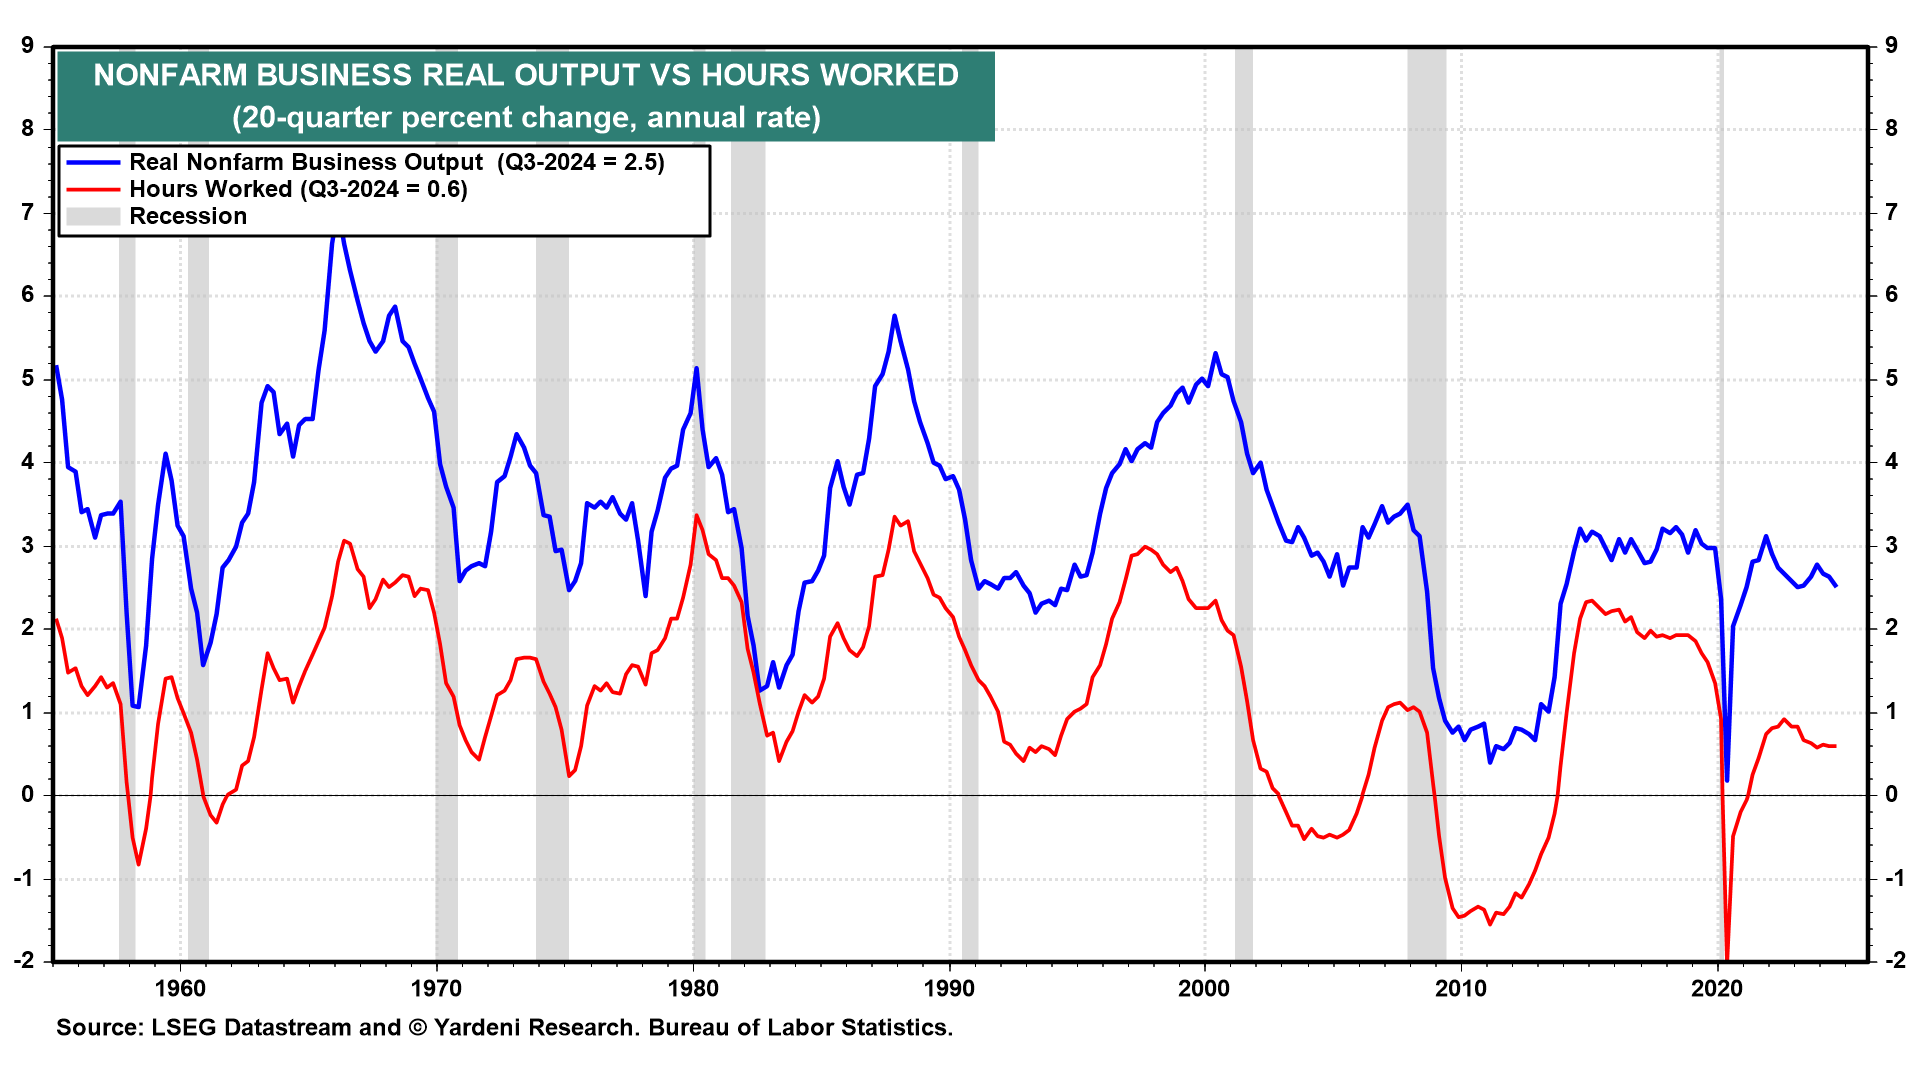
Productivity and price inflation
We’ve previously observed that one of the major flaws of the Phillips Curve model of inflation is that it ignores productivity. The model posits an inverse correlation between the unemployment rate and the inflation rate. This is a very Keynesian perspective that assumes that demand for goods and services drives the economy and inflation. When demand is strong (weak), the unemployment rate is low (high), driving up (down) wage inflation and price inflation.
In fact, there is an inverse correlation between productivity growth and the unemployment rate. Tight (loose) labor markets will drive up (down) wage inflation, but that pressure on prices tends to be offset by rising (falling) productivity. In the current productivity growth boom, we expect that the tight labor market will stimulate more productivity growth.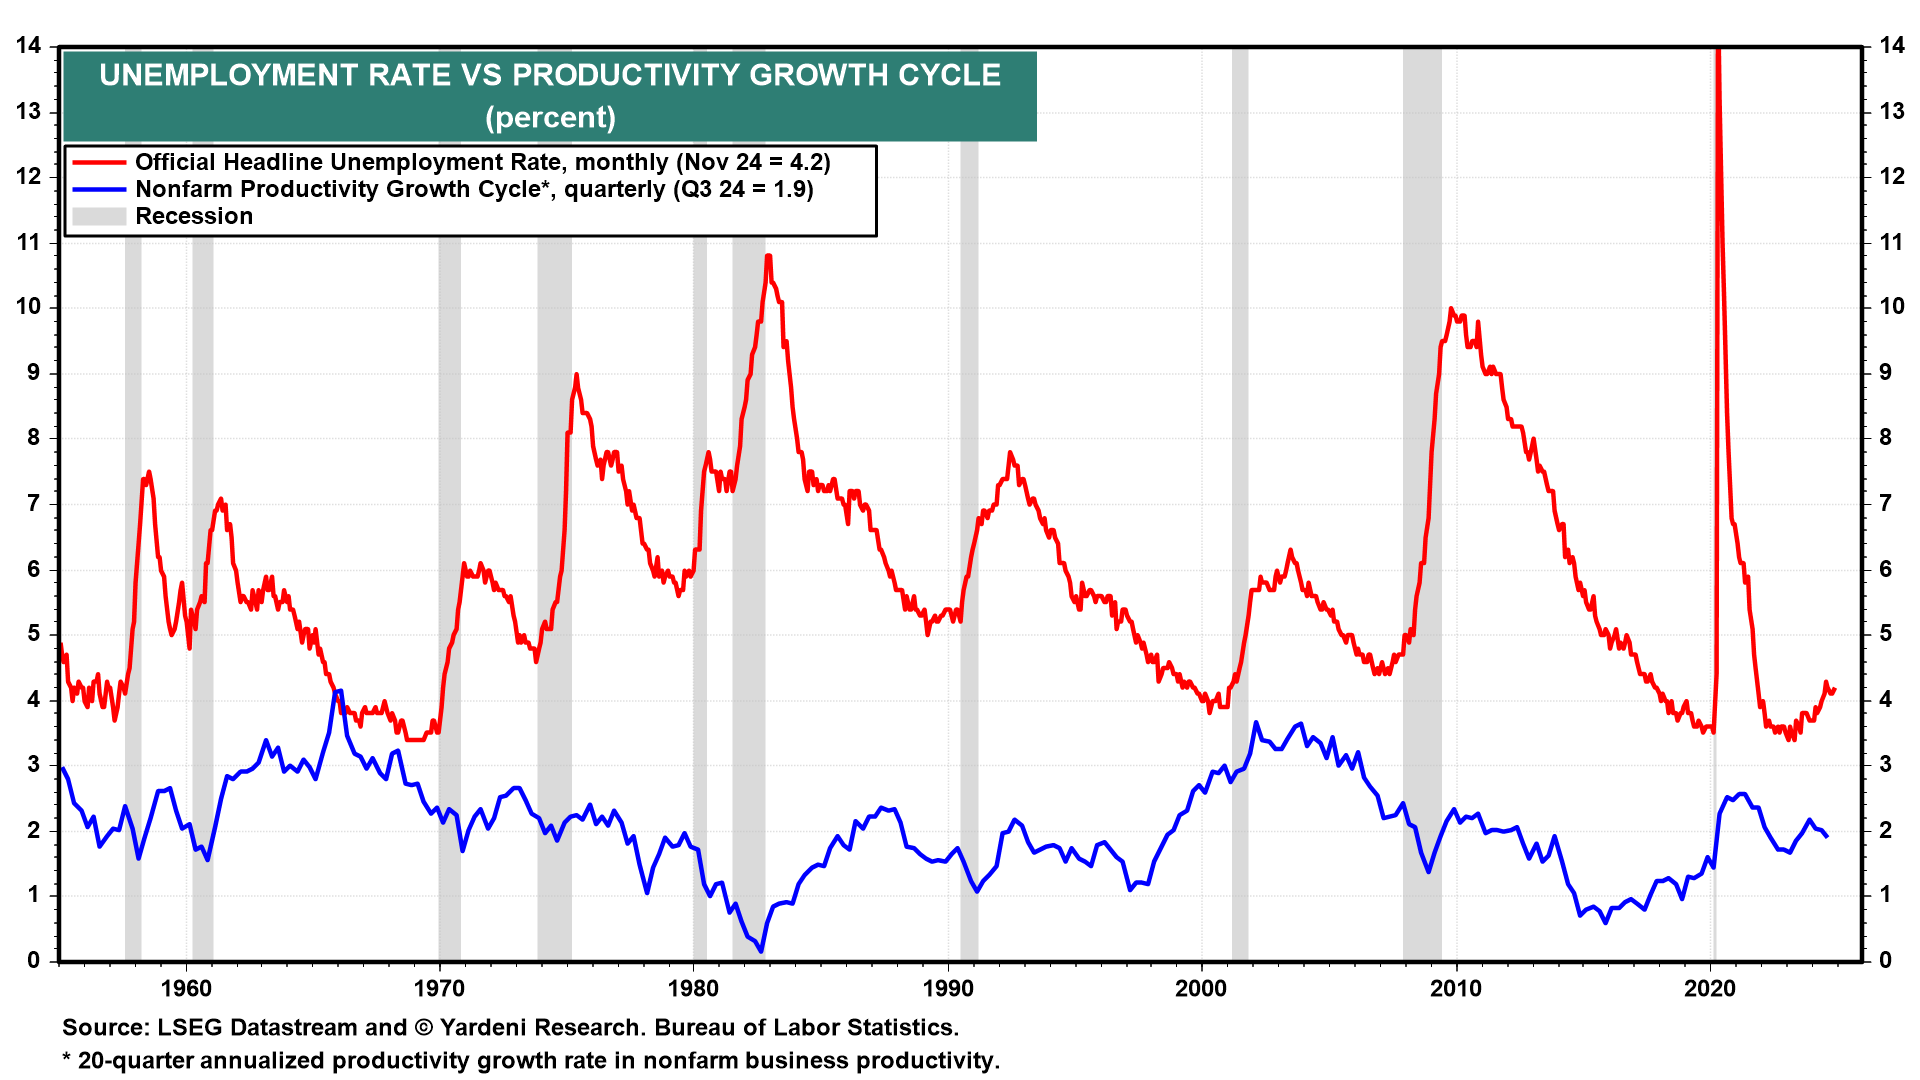
Productivity and labor costs
As noted above, ULC is equal to hourly compensation divided by productivity. In a competitive labor market, inflation-adjusted hourly compensation tends to be determined by productivity. The so-called productivity-pay gap almost disappears when the price deflator used is the nonfarm business price deflator rather than the CPI. That makes sense since employers’ compensation decisions are based on the prices they receive for their output, not on consumers’ overall cost of living.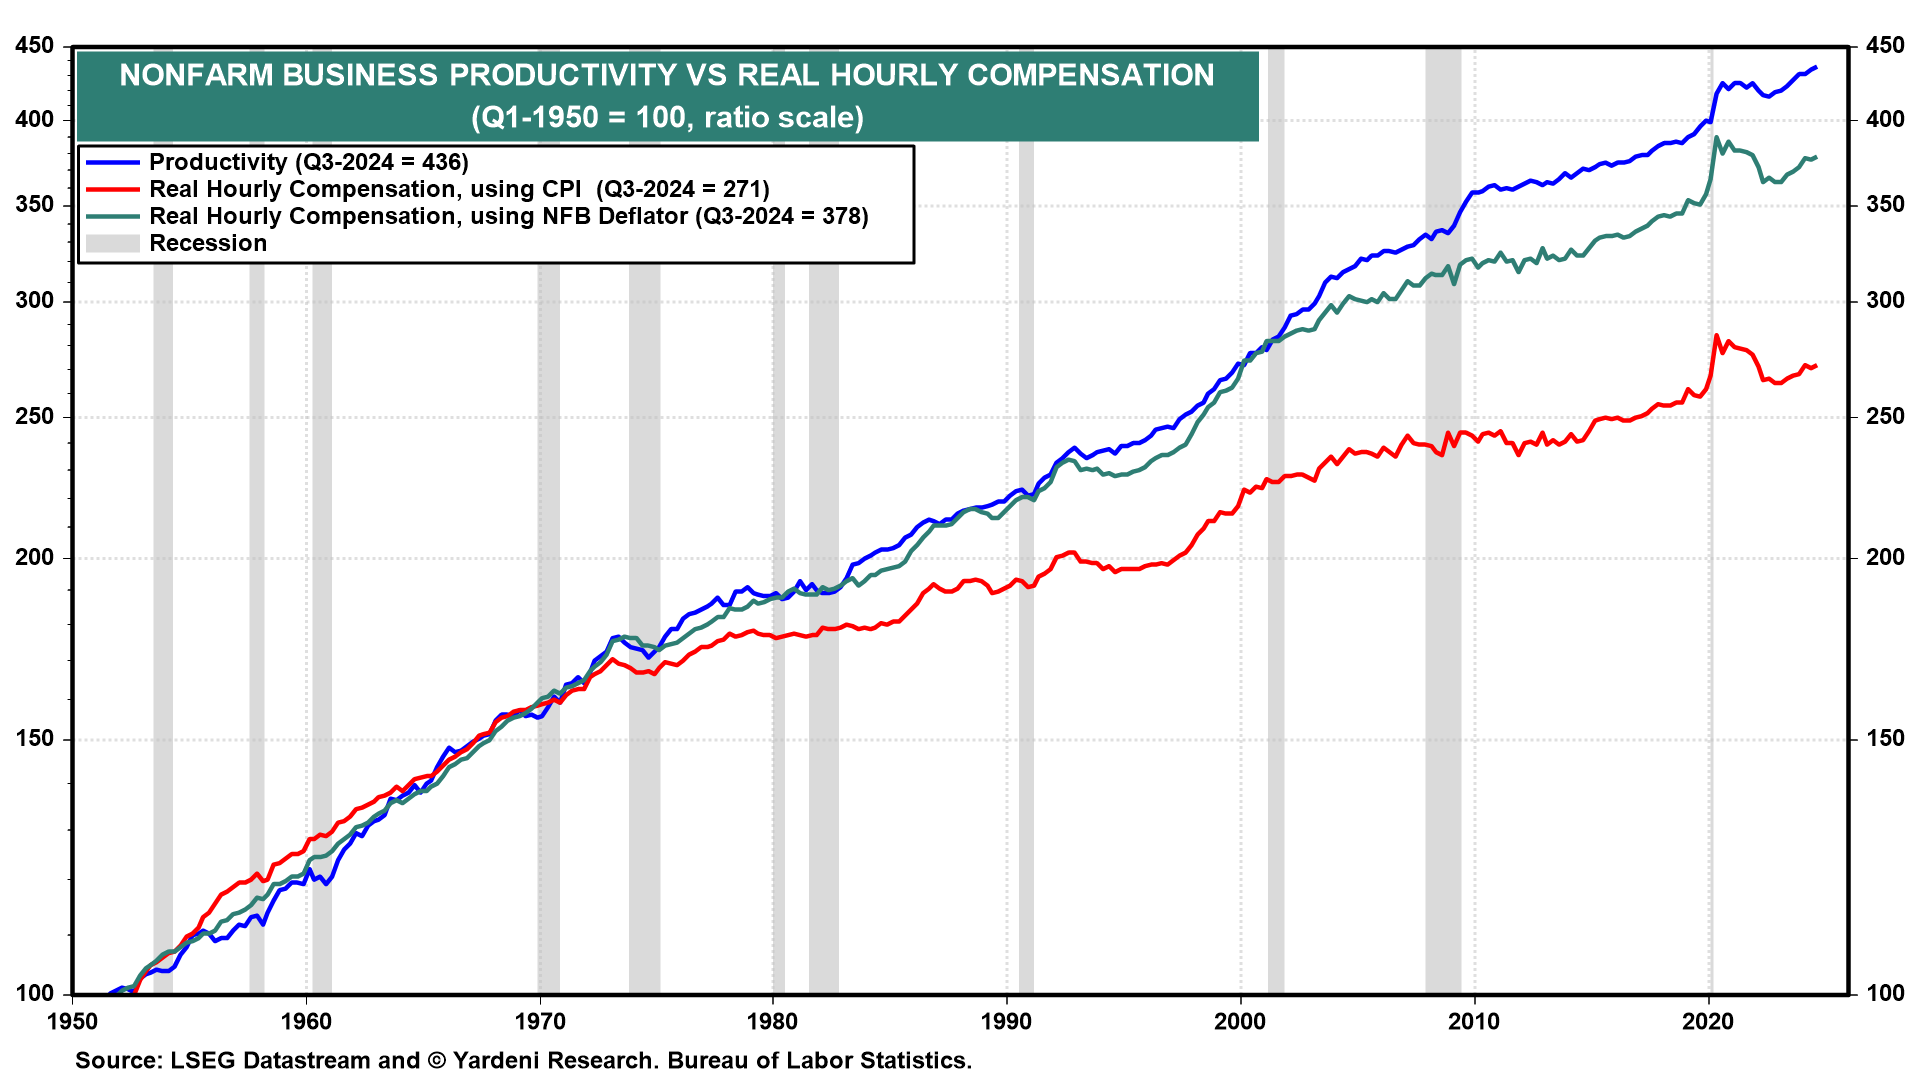
Not surprisingly, the 20-quarter percent change at an annual rate in real hourly compensation closely tracks the comparable growth rate in productivity. In other words, the current productivity growth boom that started at the end of 2015 has been reflected in improved real hourly compensation since then, and real compensation is one of the best measures of purchasing power and the standard of living.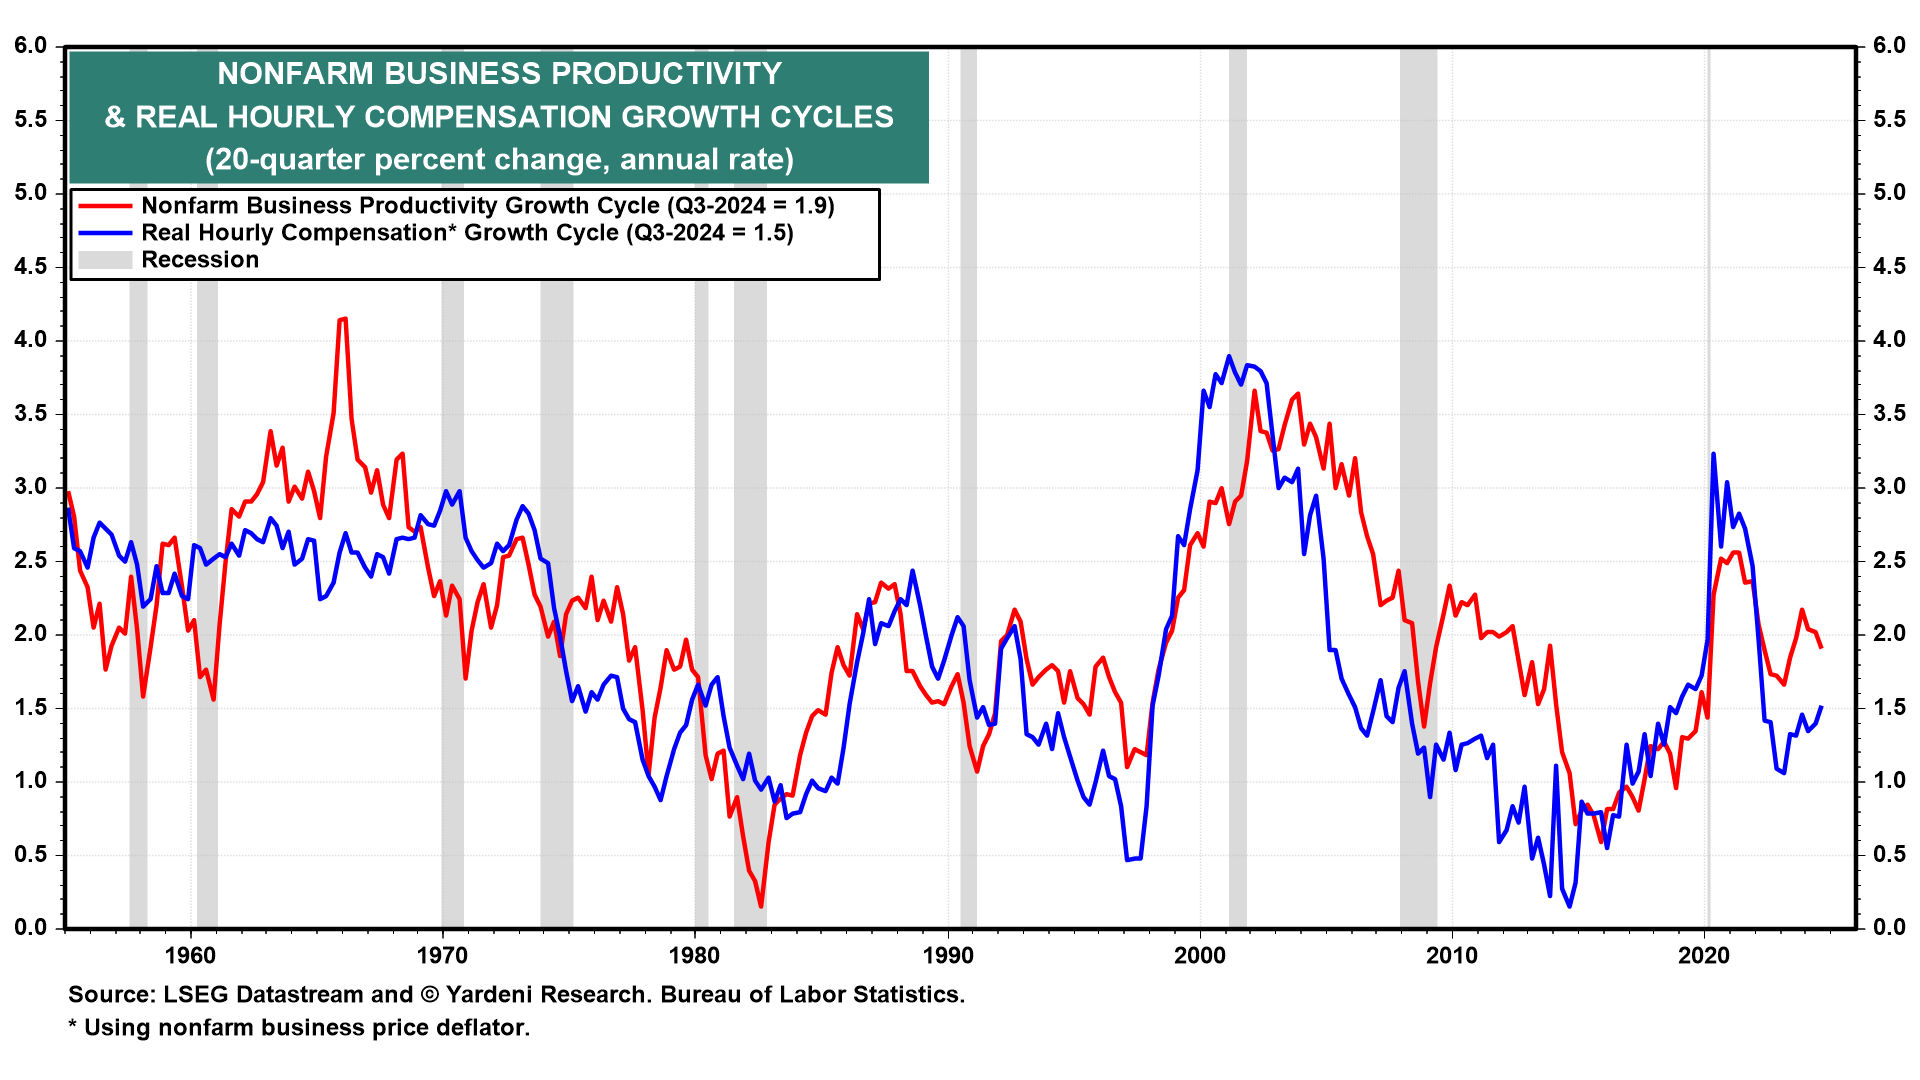
Productivity and profit margins
There should be a close correlation between the growth rate in productivity (using our trailing series) and the level of the profit margin, defined as pre-tax profits from current production as a percent of nominal GDP. There was a very close fit between the two from the 1950s through the 1980s.
The fit was less tight during the 1990s and 2000s. It’s been an inverse correlation since 2010. We don’t know why. We do know that the profit margin has remained on an upward trend despite the weakness in productivity during the five years following 2010. It should remain on that trend now that productivity growth is on an upward trend too since late 2015.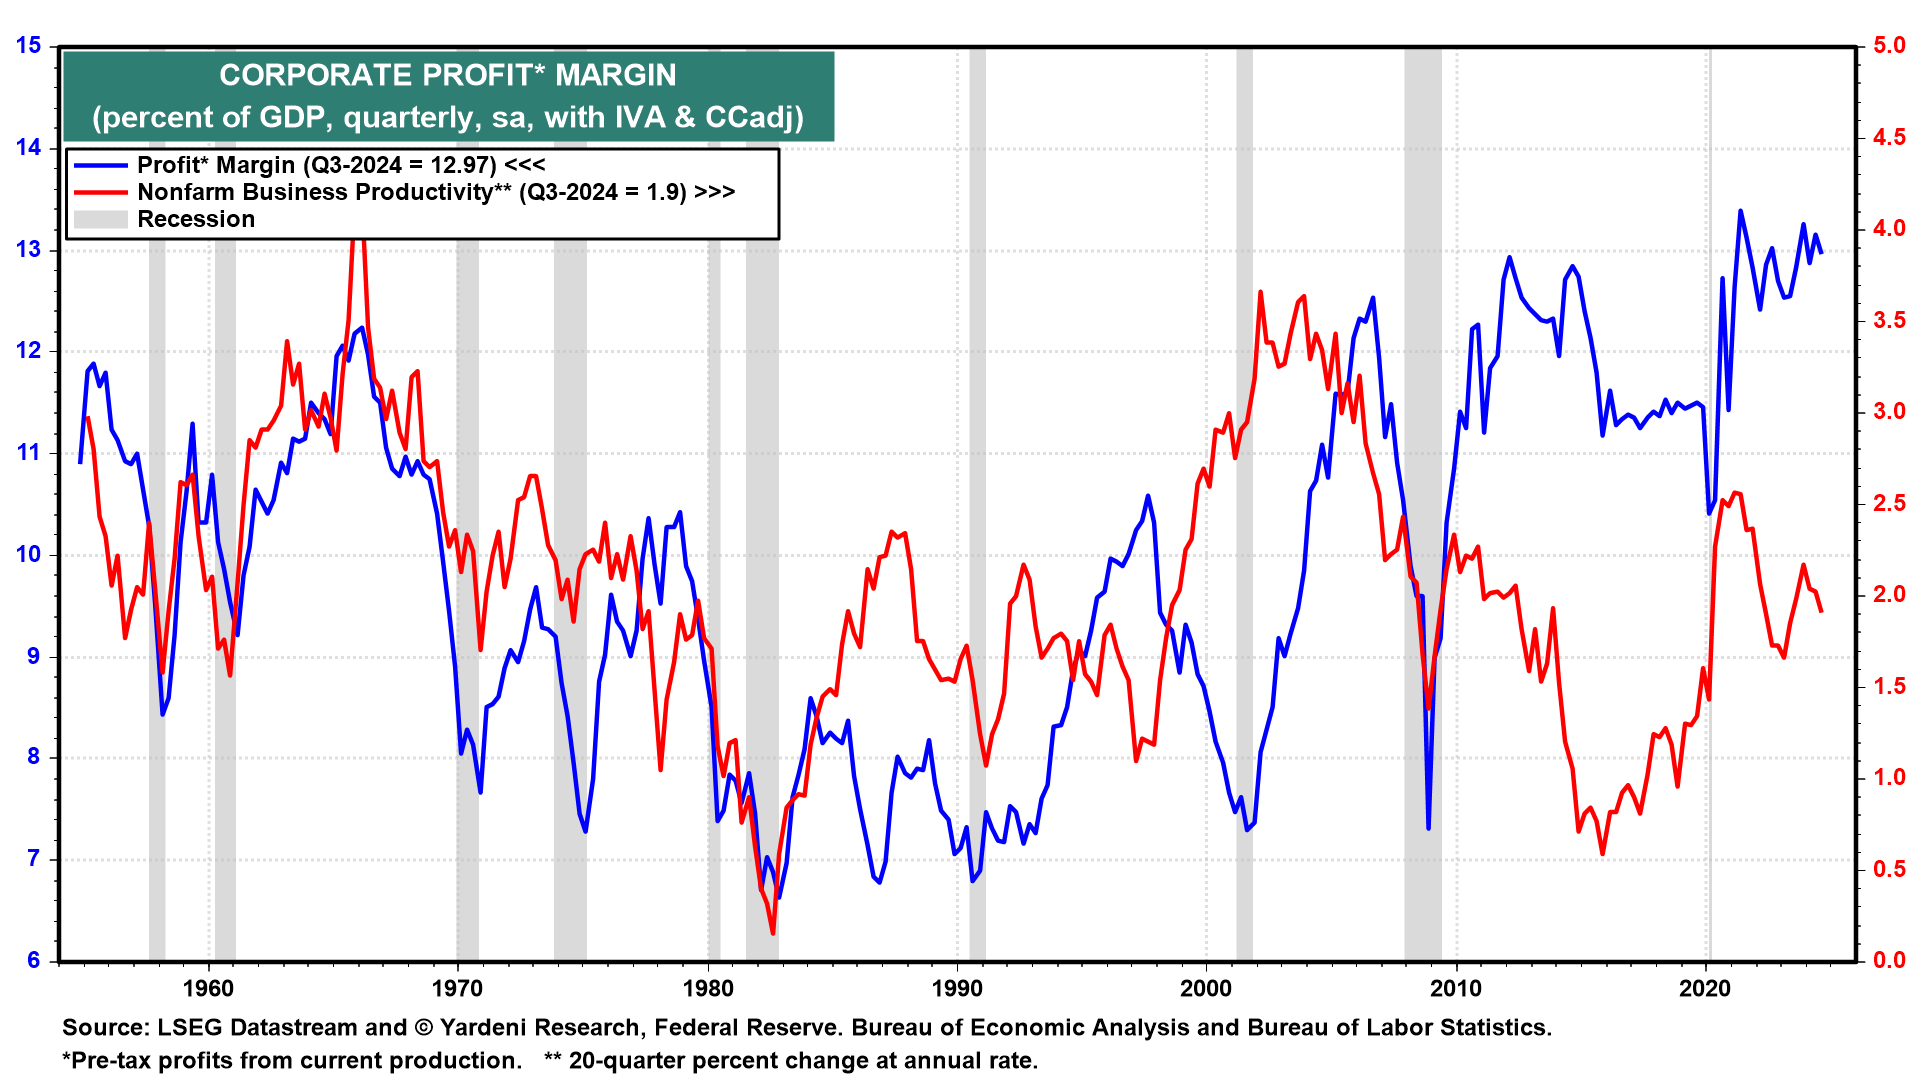
The GDP measure of the profit margin on an after-tax basis closely tracks the S&P 500 profit margin.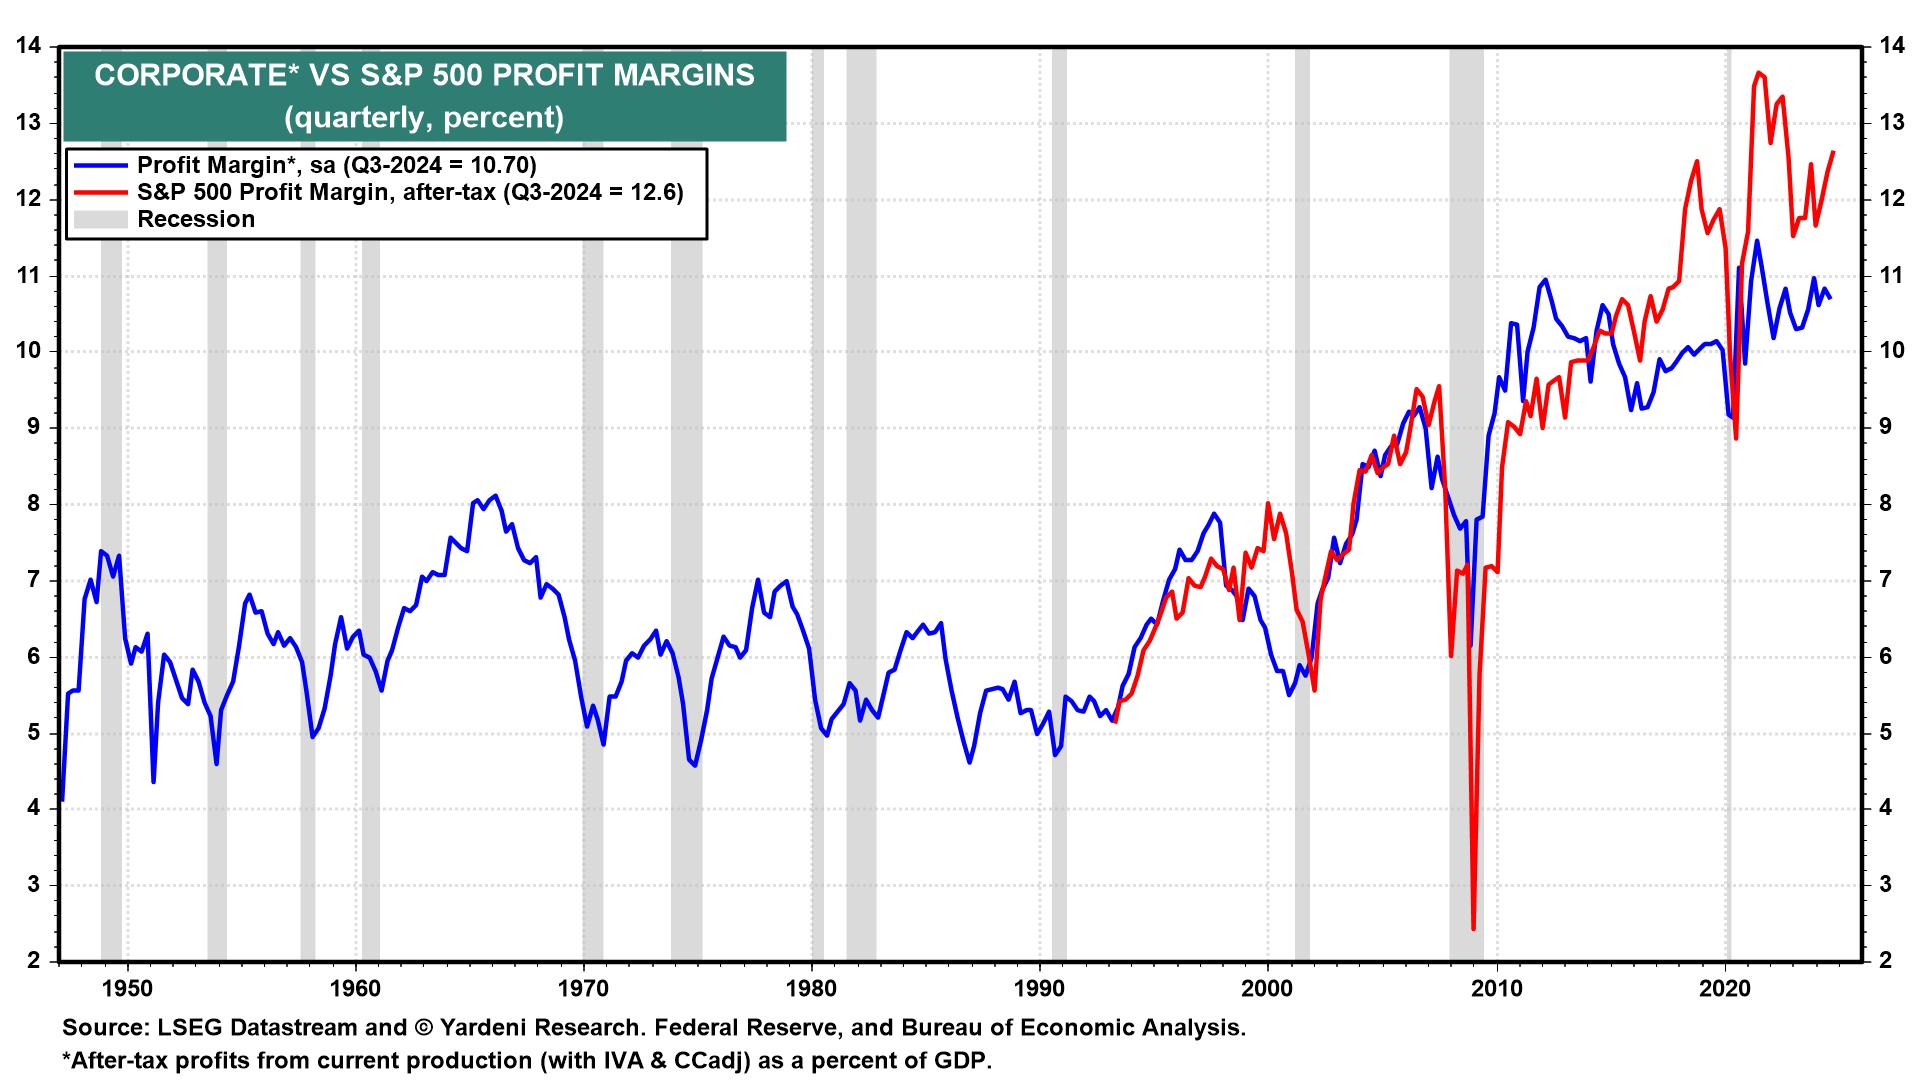
Both have remained on uptrends since the early 1990s. They both suggest that productivity growth might have been stronger since 2010, when it diverged from these measures of the profit margin. In any case, our Roaring 2020s scenario should be bullish for the profit margin of the S&P 500, which we expect to see at new record highs over the next few years.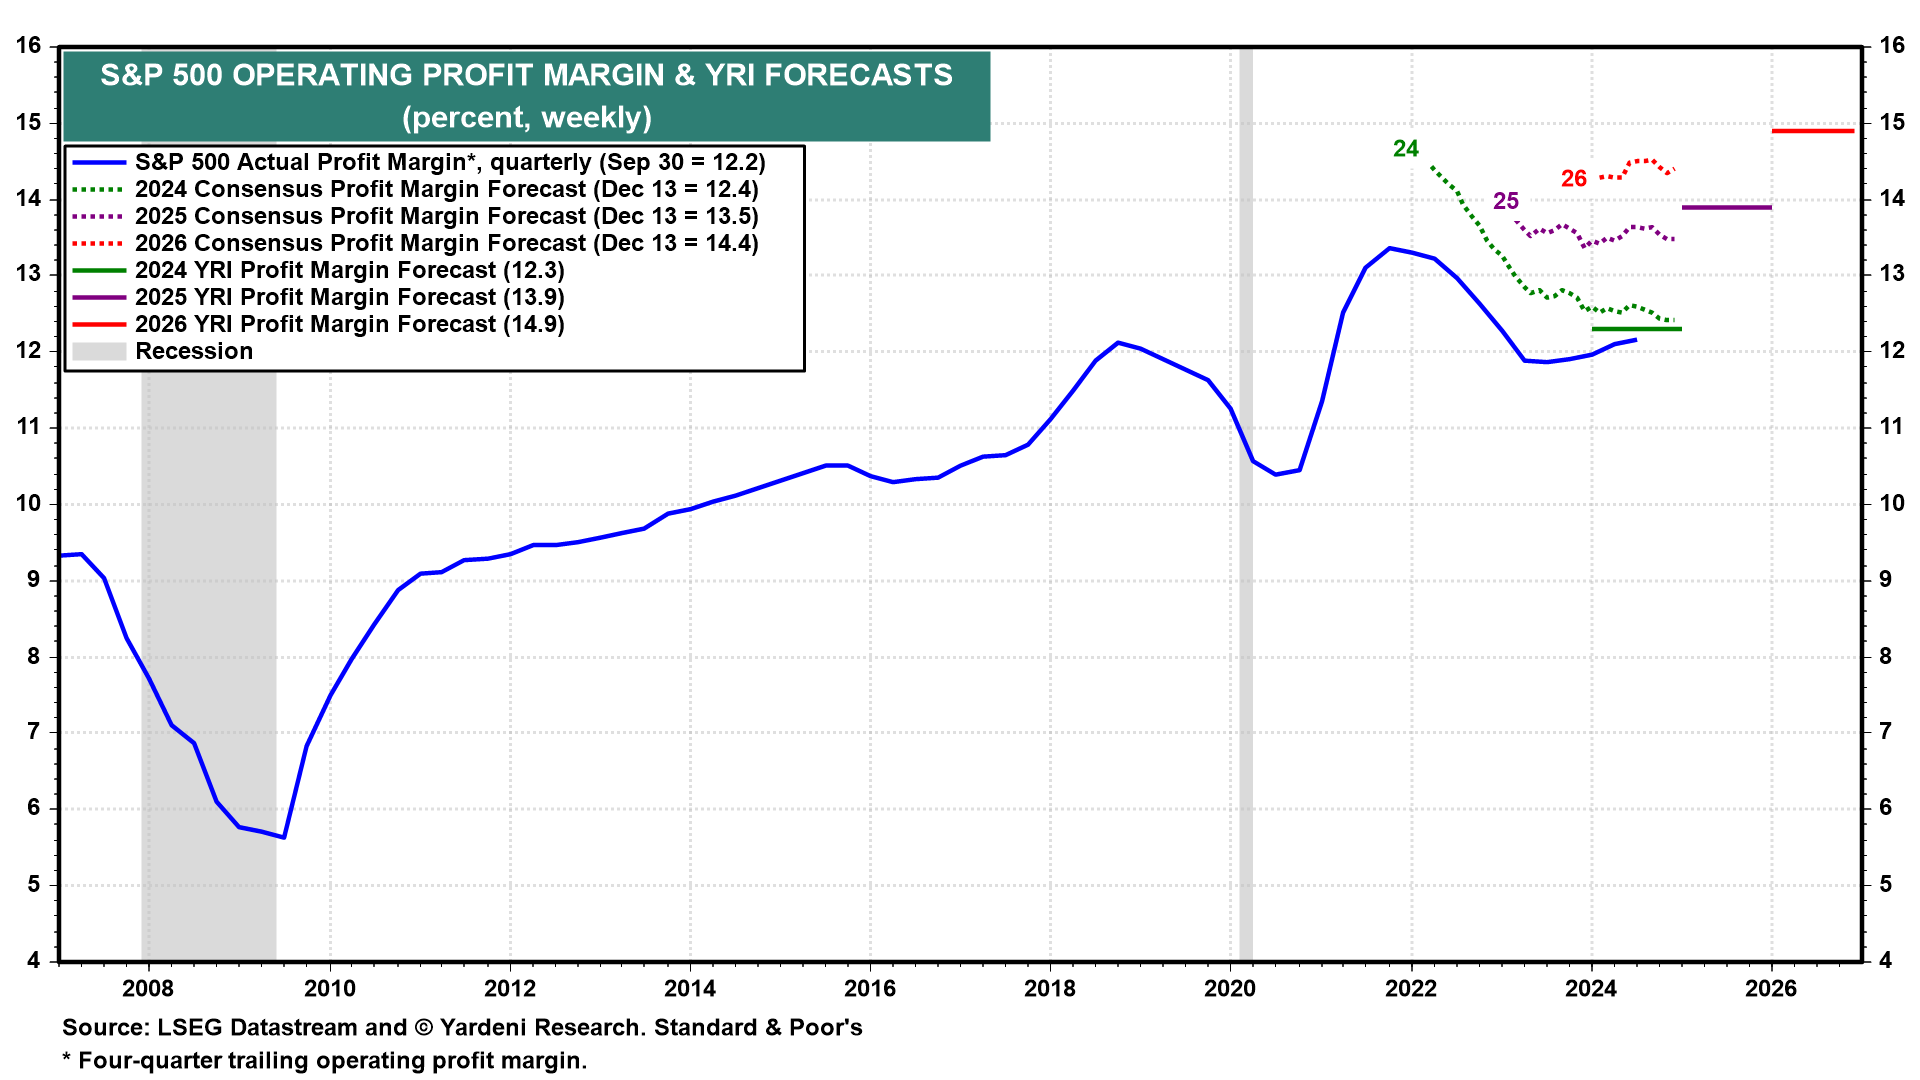
Bottom line
Productivity is like fairy dust. It makes everything better. When its growth increases, that boosts real GDP’s growth rate, moderates inflation, allows real hourly compensation to rise faster, and lifts profit margins. That’s what the Roaring 2020s is all about.
Inflation II, The Bad
So, what could possibly go wrong with our happy base-case scenario? It could be undone by one of the other scenarios we could see but view as less likely.
We are still assigning a 55% subjective probability to the Roaring 2020s, 25% to a 1990s-style meltup, and 20% to a bearish “cauldron” that includes a geopolitical calamity—with the recognition that geopolitical crises don’t seem to perturb the US economy or stock market anymore.
What other “toil and trouble” simmer in this wicked cauldron, to quote Shakespeare’s three witches in Macbeth? A tariff and currency war are in this pot. So is a US Treasury debt crisis. Also in the cauldron is a possible rebound in the inflation rate that would force the Fed to stop easing monetary policy, or possibly to tighten monetary policy again.
And what about inflation in the melt-up scenario? It has already been fueled by the Fed with an unnecessary 75bps cut in the federal funds rate since September 18. Additional cuts would pour more gasoline on the fire. The resulting positive wealth effect attributable to new highs in the prices of stocks, houses, real estate, bitcoin, and gold could also fuel consumer price inflation. That would force the Fed to raise interest rates, which would turn the meltup into a meltdown. For now, the latest inflation news suggests that inflation might be getting stuck just north of the Fed’s 2.0% target:
The latest core consumer price inflation as measured by the latest CPI for November and PCED for October showed increases of 3.3% and 2.8%. The comparable PPI measure showed consumer prices up 3.4% during November. When it was reported last week, there were significant upward revisions in this third measure of inflation, which unlike the other two doesn’t include rent paid by consumers.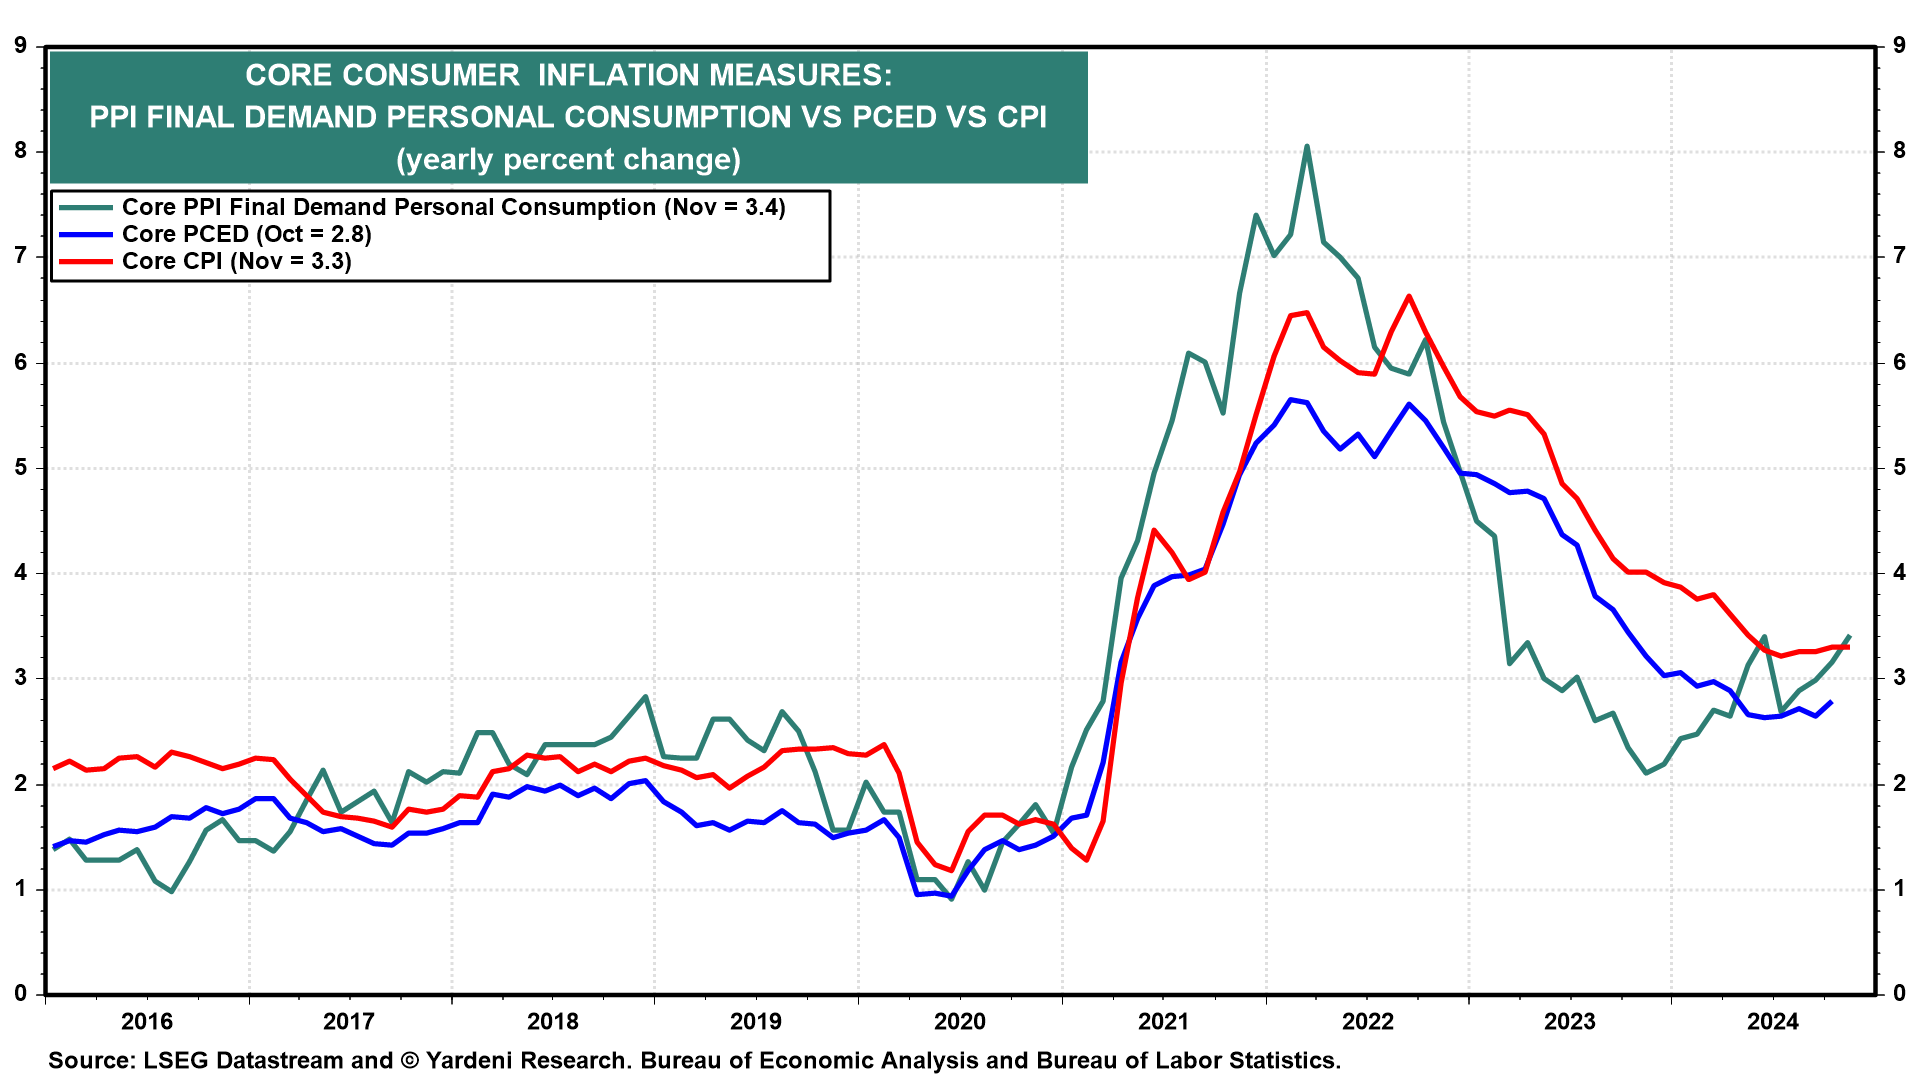
The supercore components of these three measures of consumer price inflation track services less shelter and remained relatively hot over the past couple of months at 4.1% (CPI), 4.0% (PPI), and 3.5% (PCED).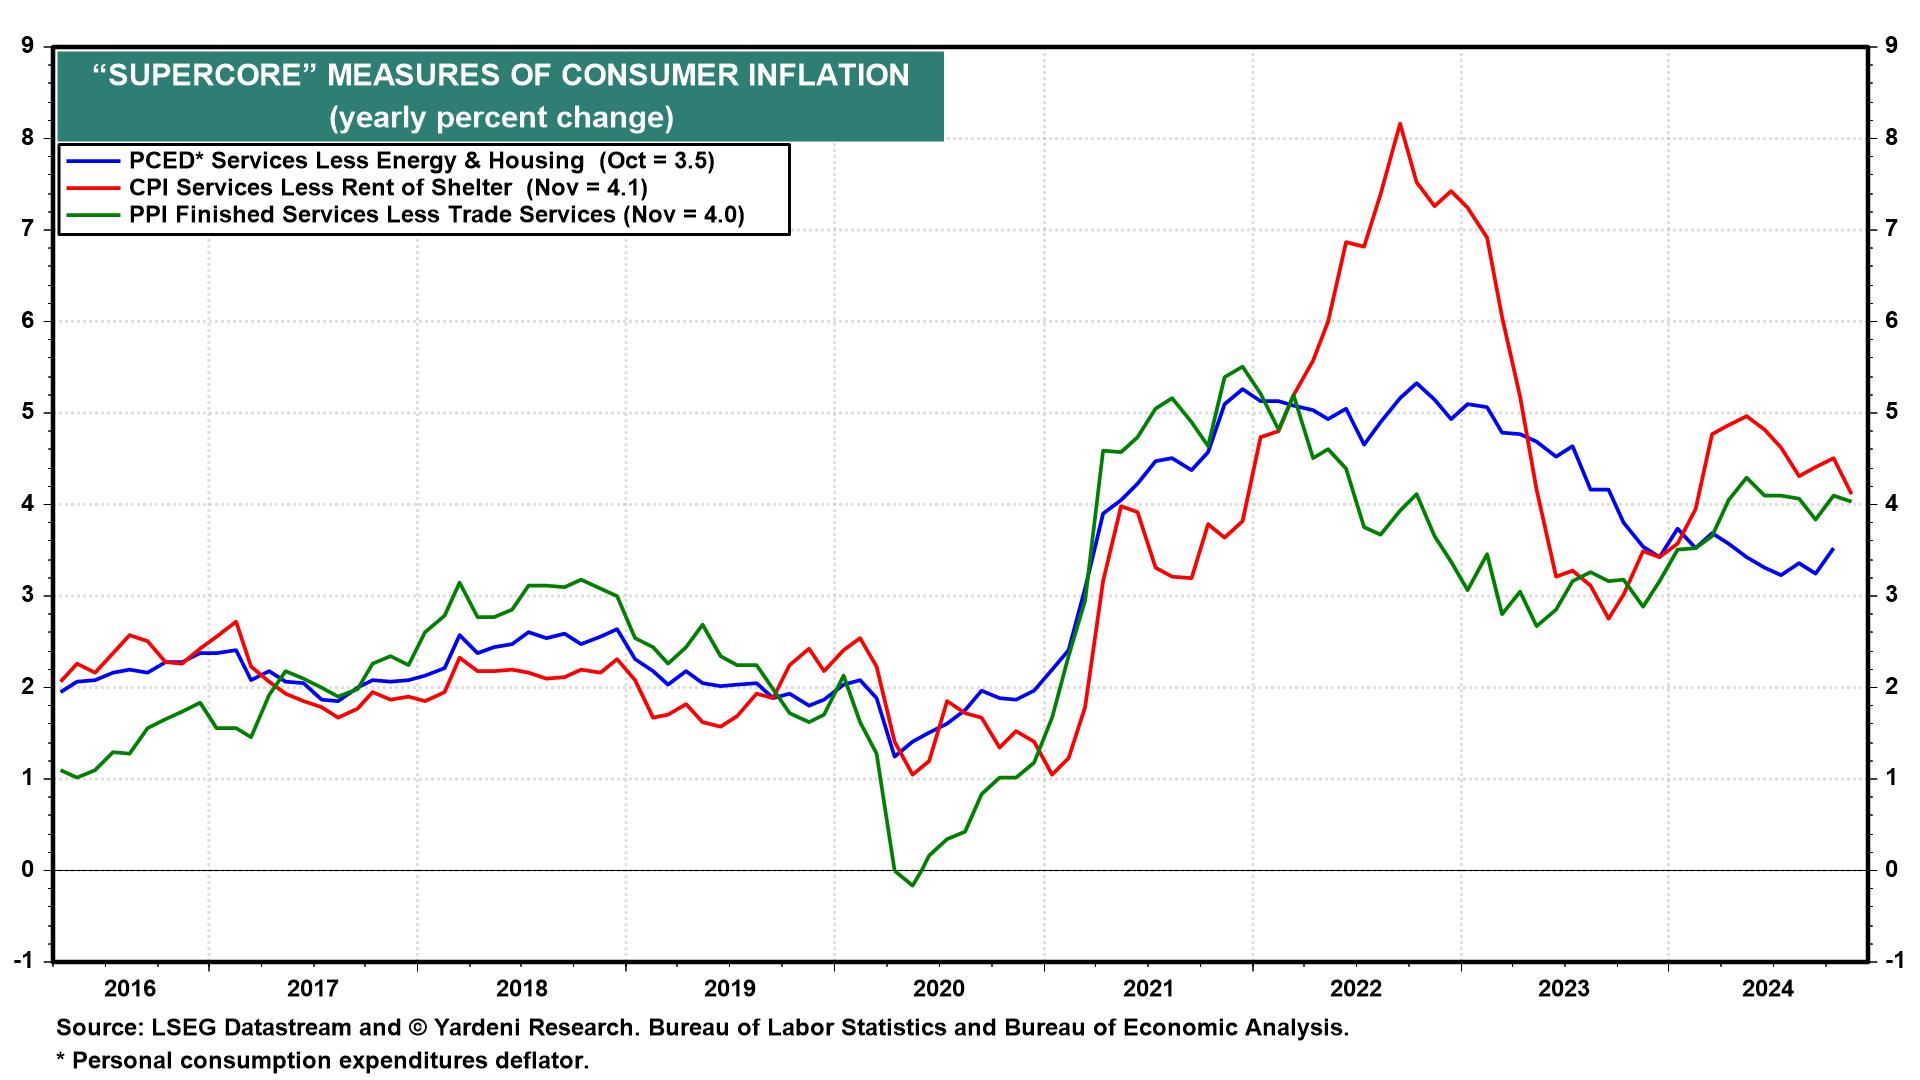
November’s survey of small business owners by the National Federation of Independent Business showed that 24% are raising prices and 28% are planning to do so. Those are low readings compared to the spike in 2022. But they are still relatively high compared to the pre-pandemic history of both series.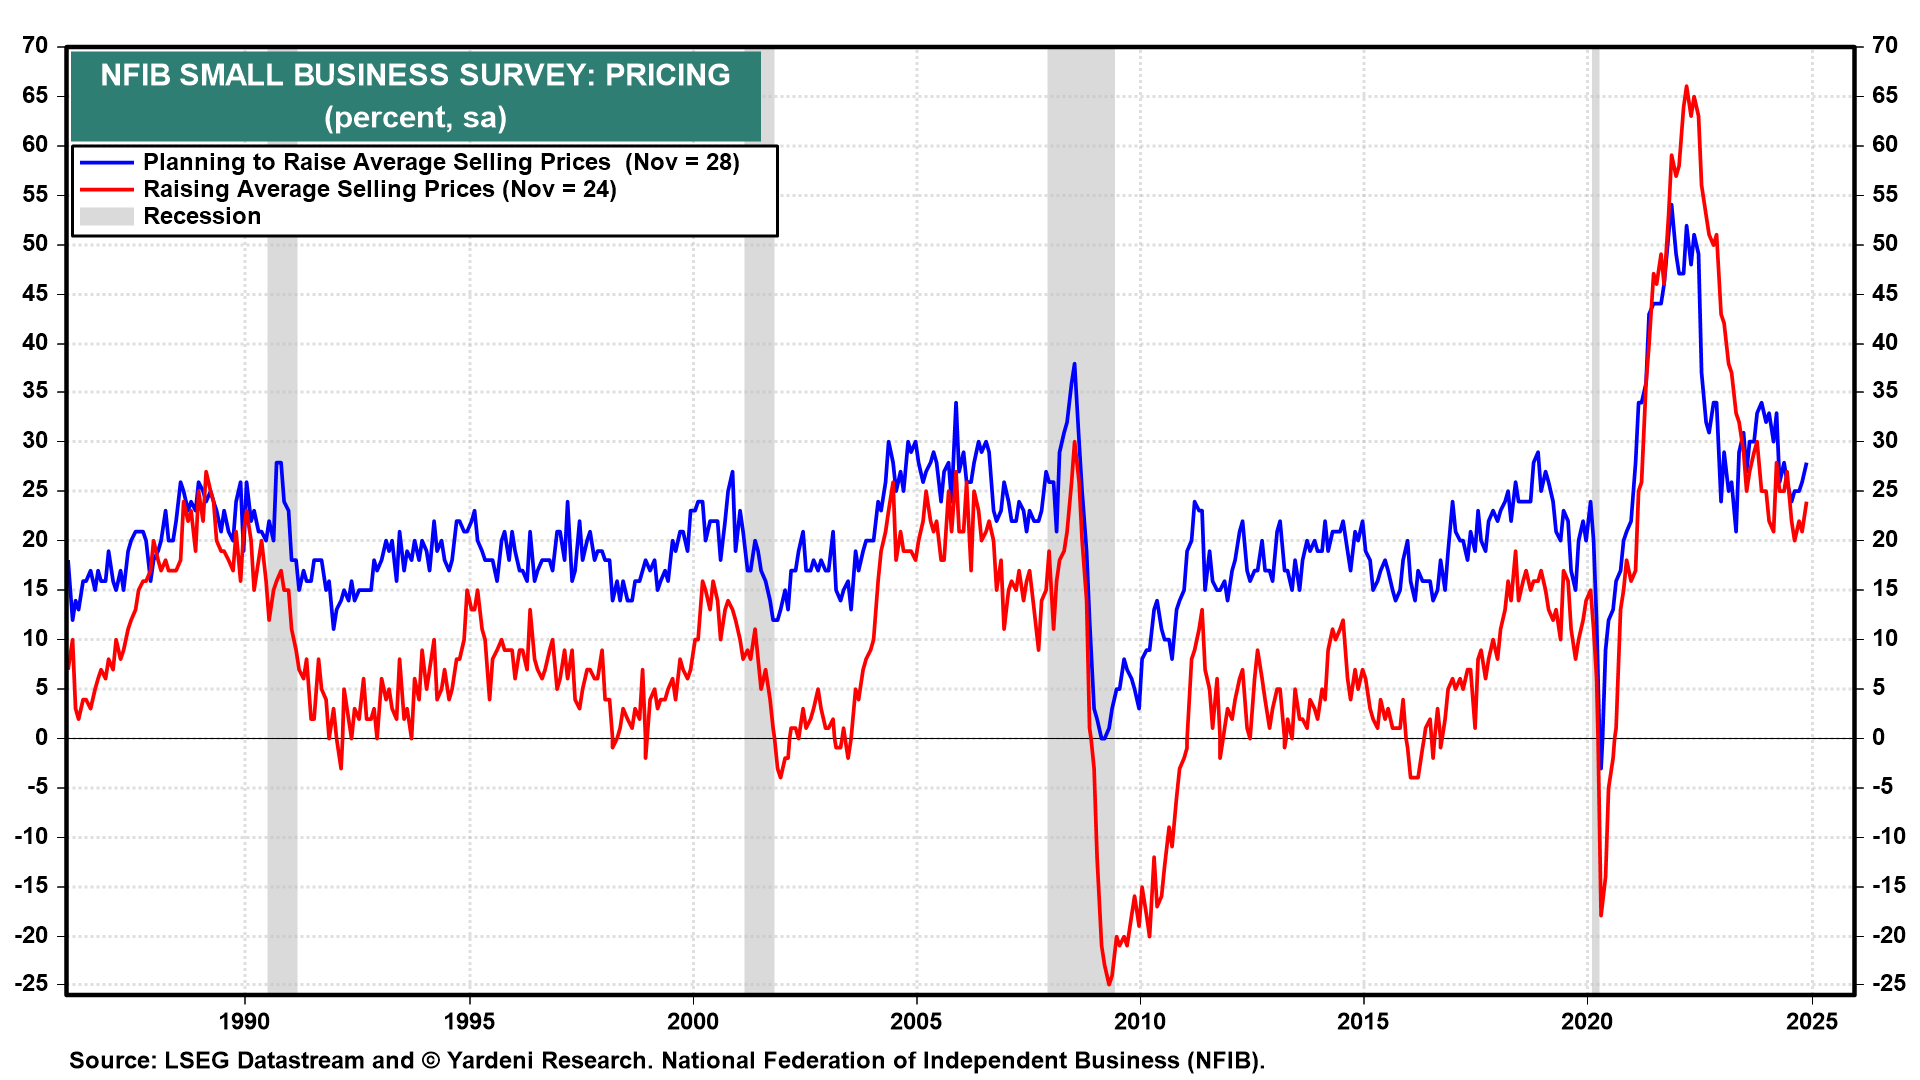
Inflation III, the Ugly:
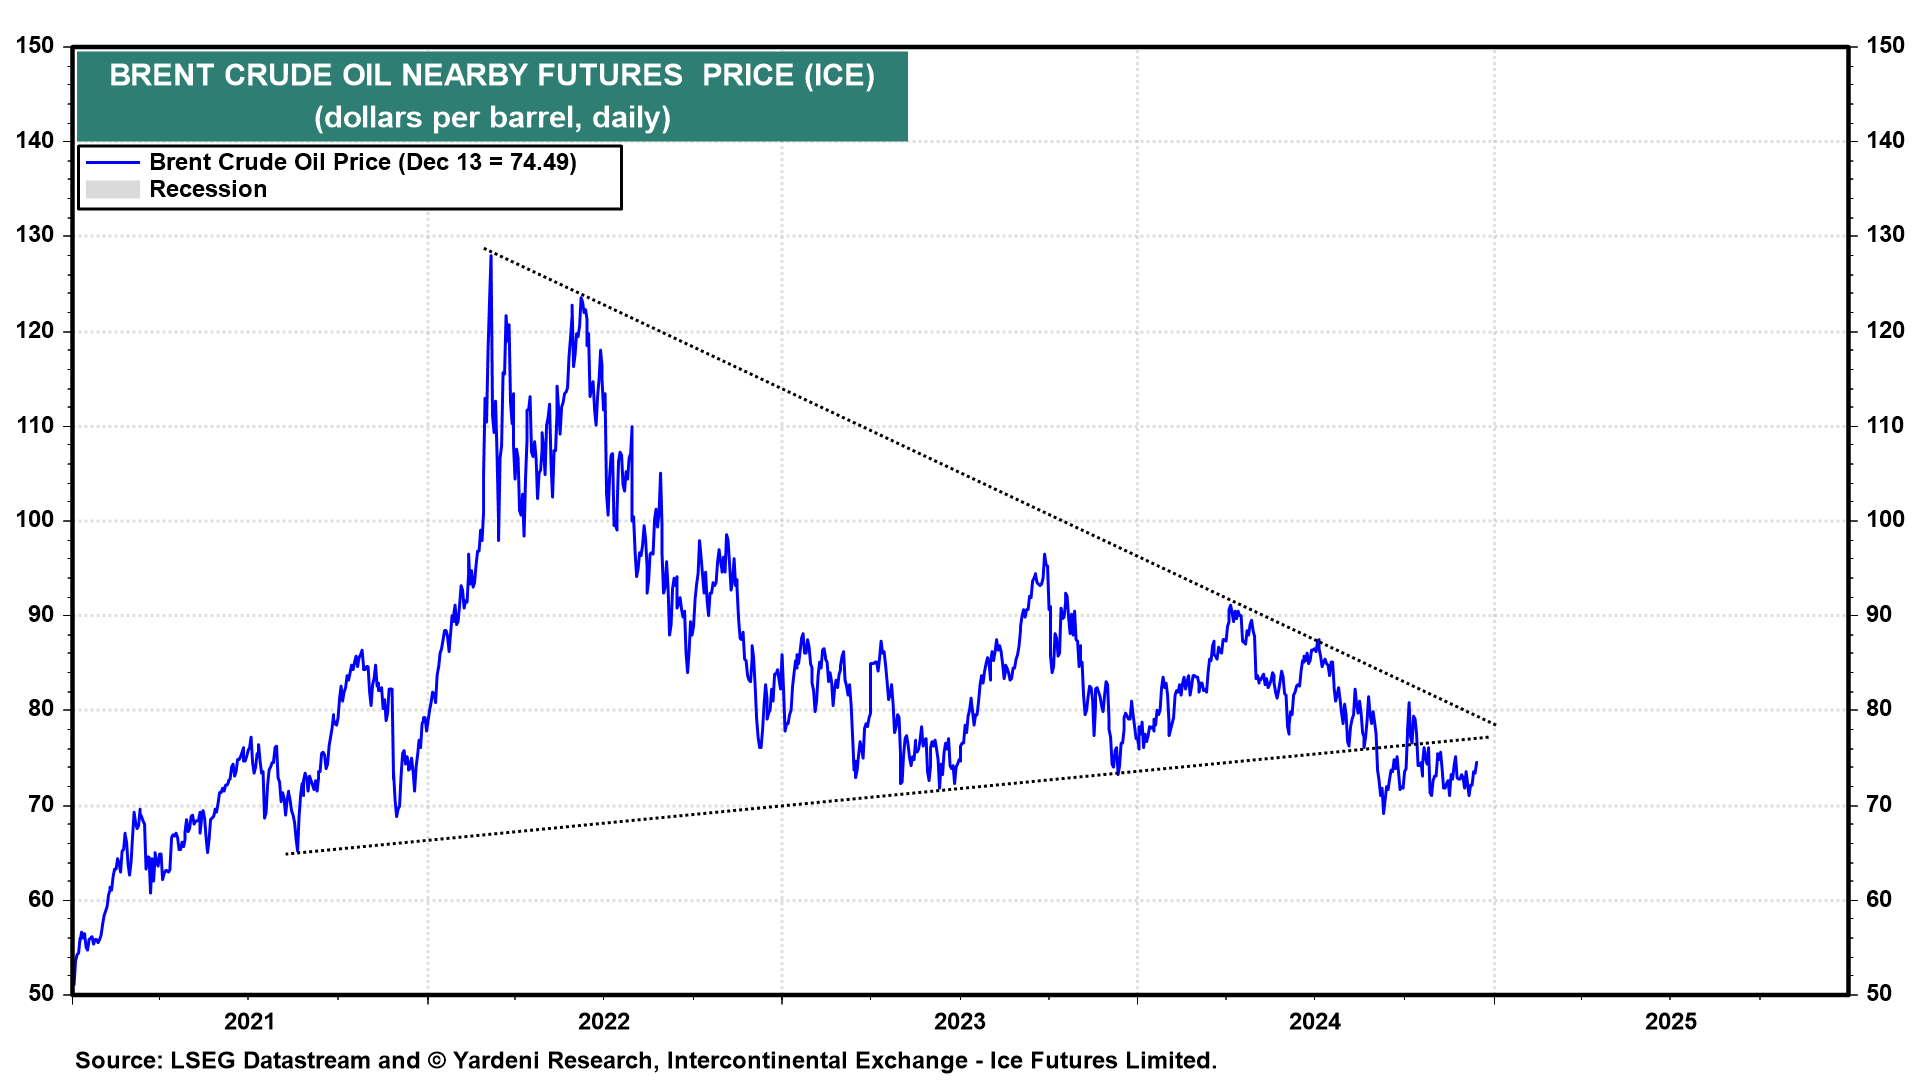
Reflationists have observed that inflation during the first half of the 2020s has traced out a similar pattern to that of the first half of the 1970s, when it also surged and then moderated. They warn that it might now trace out a second inflationary wave as happened during the second half of the 1970s. This scenario is one of the ingredients in our bearish cauldron. During the 1970s, two geopolitical crises in the Middle East caused oil prices to soar, resulting in the Great Inflation of the 1970s.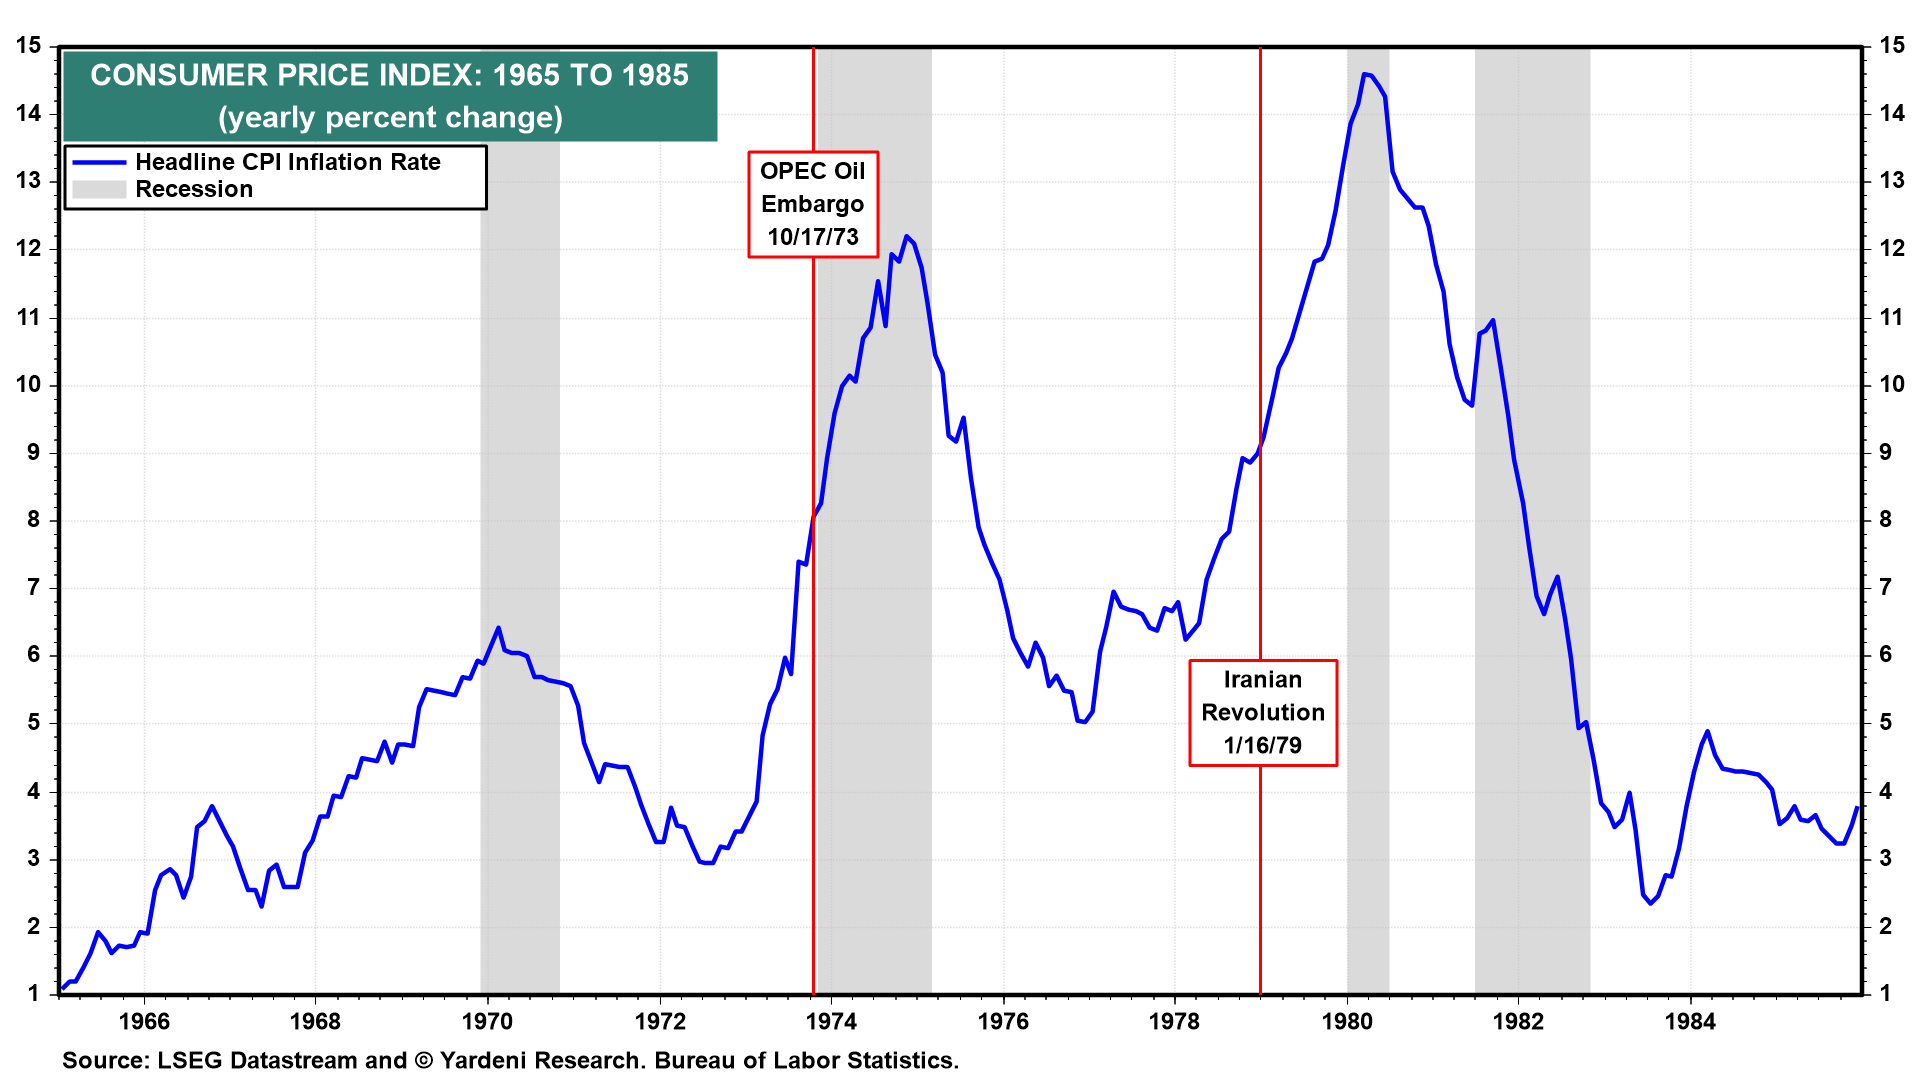
The current decade already has had two geopolitical crises with the potential to drive up oil prices, yet oil prices remain subdued. That’s because global oil supply remains ample, while global oil demand remains subdued.