S&P 500 Says Good-Bye August

Published 09/01/2015, 01:55 AM
Updated 05/14/2017, 06:45 AM
US500
-
ESH25
-

S&P 500 Chart

S&P 500 Says Good-Bye August

Heading into today’s trade that stats were not good as the last day of the trading month had closed lower on eight of the last nine occasions. Overnight the S&P futures (ESU15:CME) opened and went straight down losing more than 27 handles in just over 30 minutes before rebounding light early in the Asian session and holding its early range in the Euro session. The index futures opened the regular session down more than 10 handles and proceeded to trade down off the open back toward the overnight low before finding a low at 1962 and in turn bouncing back to 1983.75 all within the first two hours of the day. From there the index traveled 20 handles lower throughout the afternoon into the close and even a market-on-close (MOC) imbalance that exceeded $1.2 billion to the buy was not enough to give the market a sustainable pop as it closed near its session low at 1963.25 down 26.50 handles on the day. Volume was relatively strong but down for the fifth consecutive day as the end of month trade offered very little of a bid even though funds entered the month’s close stacked to the short side. Also the ESU5 placed a third consecutive lower high, while making a lower low from Friday.

Turn-Around Tuesday

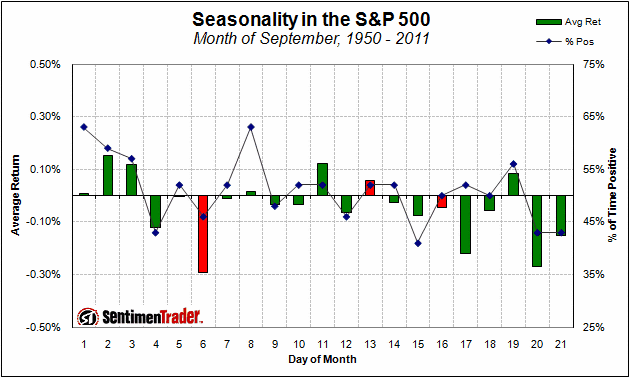
Heading into tomorrow’s session the calendar is fairly light, of particular note is the fact that 18 of the last 25 weeks has seen Tuesday close in the opposite direction than Monday, this would offer some bullish sentiment tomorrow as well as the fact that tomorrow marks the first trade of September, the first day of a month being generally bullish however somewhat less so for September in particular.

Seen In The MrTopStep IM Pro Room Today:

ICEchat ( 12:23:24 PM ): (bshepard) rich.canlione: could be interesting for Crude new low on move in Aug, new monthly low & new Quarter low, but closing above July close perhaps – 47.12 is July close

Floor Pivots For Tomorrow’s RTH E-mini

R3 2012.33

R2 1991.08

R1 1996.00

PP 1969.83

S1 1955.92

S2 1948.58

S3 1927.33


Original post

Latest comments

Loading next article…
Risk Disclosure: Trading in financial instruments and/or cryptocurrencies involves high risks including the risk of losing some, or all, of your investment amount, and may not be suitable for all investors. Prices of cryptocurrencies are extremely volatile and may be affected by external factors such as financial, regulatory or political events. Trading on margin increases the financial risks.
Before deciding to trade in financial instrument or cryptocurrencies you should be fully informed of the risks and costs associated with trading the financial markets, carefully consider your investment objectives, level of experience, and risk appetite, and seek professional advice where needed.
Fusion Media would like to remind you that the data contained in this website is not necessarily real-time nor accurate. The data and prices on the website are not necessarily provided by any market or exchange, but may be provided by market makers, and so prices may not be accurate and may differ from the actual price at any given market, meaning prices are indicative and not appropriate for trading purposes. Fusion Media and any provider of the data contained in this website will not accept liability for any loss or damage as a result of your trading, or your reliance on the information contained within this website.
It is prohibited to use, store, reproduce, display, modify, transmit or distribute the data contained in this website without the explicit prior written permission of Fusion Media and/or the data provider. All intellectual property rights are reserved by the providers and/or the exchange providing the data contained in this website.
Fusion Media may be compensated by the advertisers that appear on the website, based on your interaction with the advertisements or advertisers.
© 2007-2025 - Fusion Media Limited. All Rights Reserved.