Some Revealing Charts
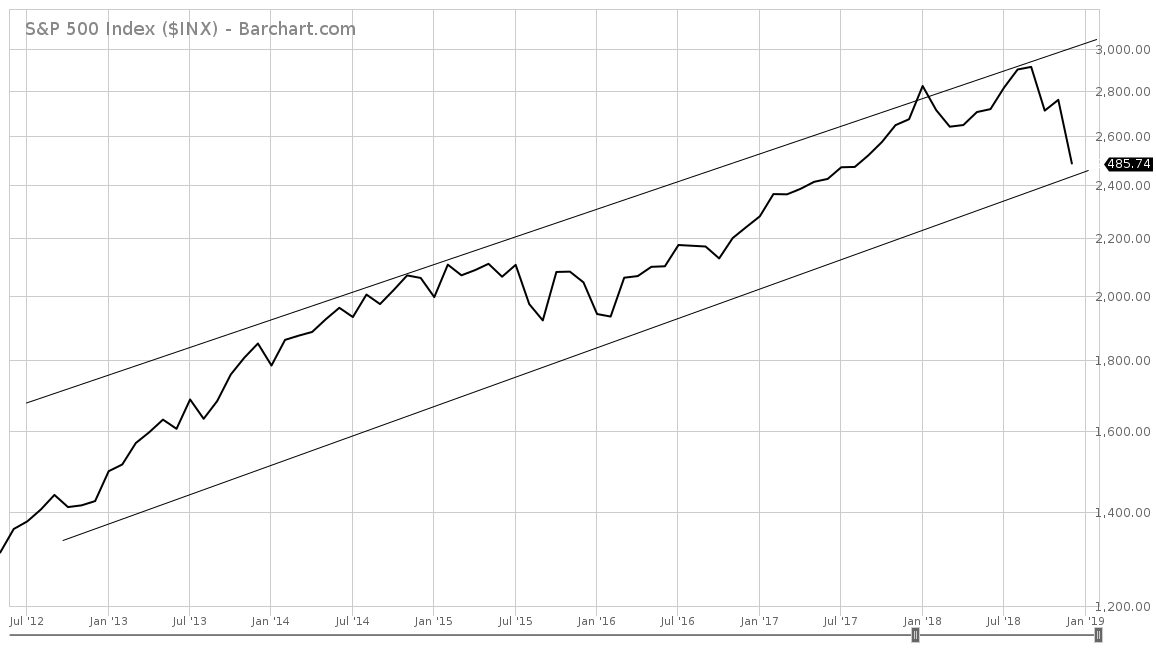
It occurred to me on a walk last night that drawing the weekly trend lines on charts and then switching the charts to monthly with the weekly trend lines remaining is a way to determine when the long-term trend may be at a key inflection point. Here is what this looks like for the S&P 500 Index:
logarithmic scale; chart courtesy of barchart.com
You can see here that the monthly price is still within the weekly bull channel that goes back to October 2012. In other words, the long-term bullish trend is still intact.
It is worth noting that following this method—raising cash when the monthly price nears the top of the weekly channel and deploying cash when the monthly price nears the bottom of the weekly channel—would have helped you reduce exposure right before the last 2 stock market peaks in January 2018 and July 2018.
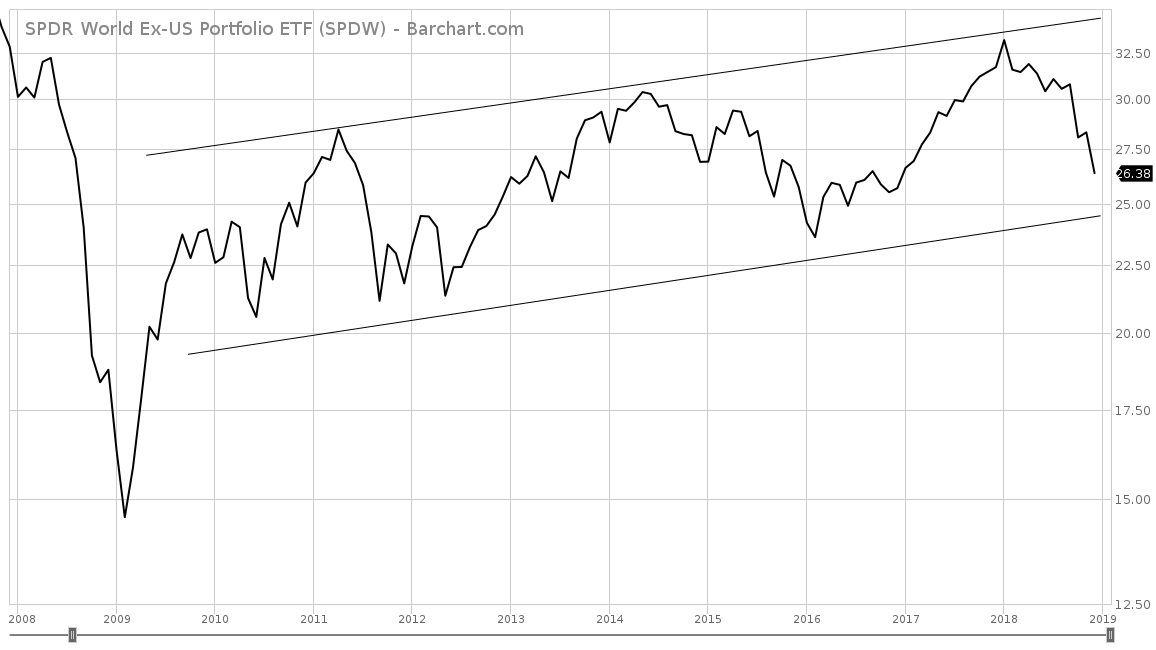
Here is the same type of chart for the State Street SPDR Portfolio Developed World Ex-US ETF (SPDR S&P World ex US (NYSE:SPDW):
logarithmic scale; chart courtesy of barchart.com
This relationship is even more pronounced for this large capitalization, developed country stocks listed outside the United States.
Another factor at play here is the U.S. dollar. The SPDW turned higher in January 2016, right as the dollar started falling, and has been plummeting in 2018 as the dollar has been climbing.
In the context of decent global economic growth, these 2 charts tell me that (1) stocks are getting ready to put in a bottom and (2) non-US developed market stocks could outperform the S&P 500 in 2019 if I am correct that the U.S. dollar is peaking and getting ready to roll over.
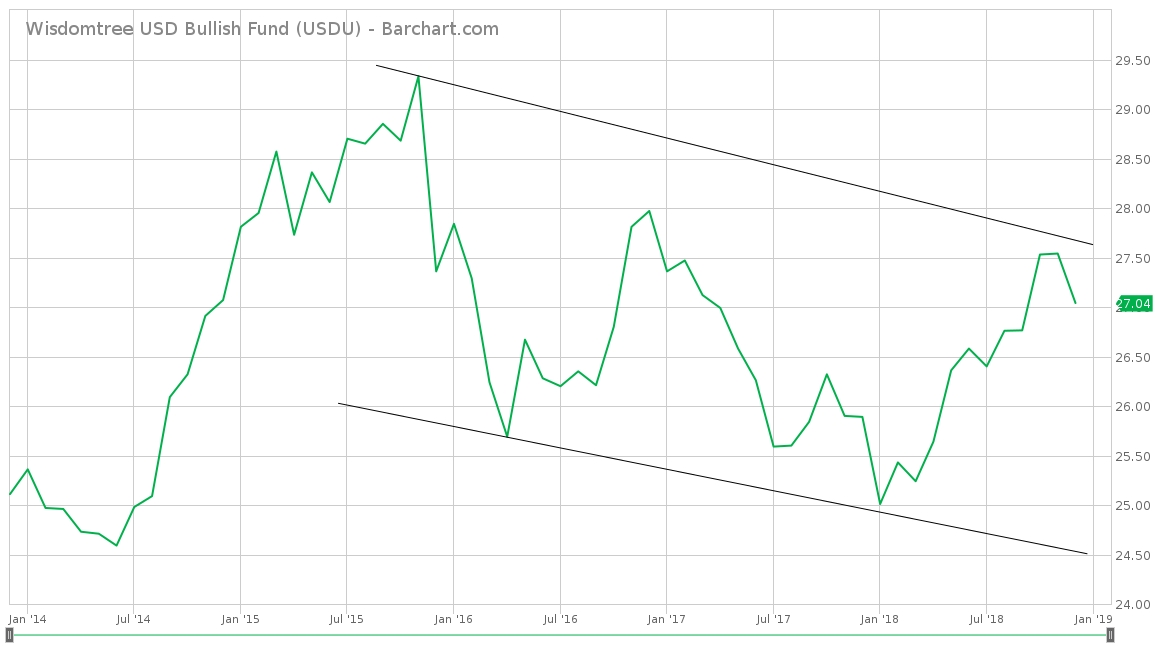
Regarding the U.S. dollar rolling over, consider the following monthly price chart of the WisdomTree Bloomberg US Dollar Bullish Fund ETF (NYSE:USDU) annotated with the weekly price trend line channels:
logarithmic scale; chart courtesy of barchart.com
USDU keeps putting in lower highs and lower lows on the monthly price chart.
Important Buying Opportunity
I expect that stocks have just or will soon (within a few weeks) put in what may prove to be the last great buying opportunity in the current bull market. I would not be surprised to see a shocking, sudden, sharp rise in developed stock markets in the very near future. The U.S. stock market's powerful ~5% rebound on December 26th was a signal that there are a large number of buyers around that lower weekly trend line.
Investors should have their shopping list ready.


