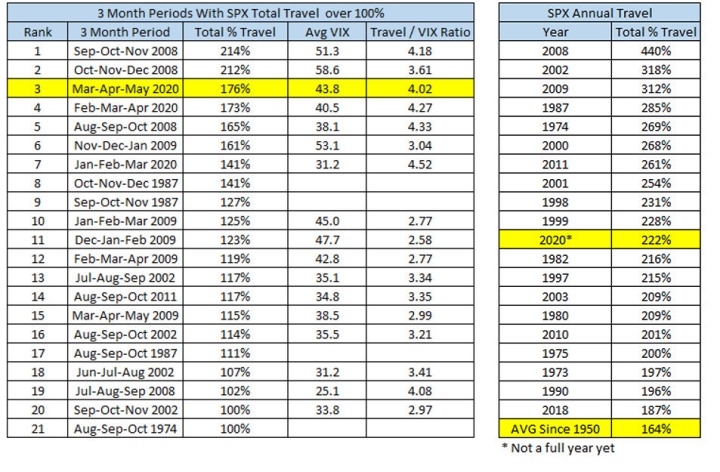
The last 3 months were some of the most volatile ever observed in stock markets. As measured by “total travel” – the sum of absolute daily percentage changes from close to close – the SPX had its 3rd most volatile period in its history since 1950. SPX traveled 176% up and down from March through May which is just shy of the 214% travel experienced from Sep to Nov of 2008. Just to put this in perspective, this is more than what the SPX usually travels for a full year. The average annual travel since 1950 is 164%. With 220% traveled already before half the year is over, 2020 on a path to beat 2008’s 440% as the most volatile market year ever. We are watching and trading history here.
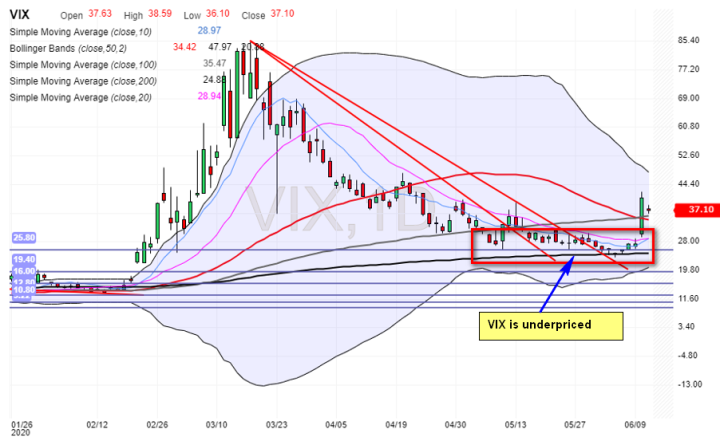
Before the VIX spiked yesterday, the VIX was trading below 30 for a couple of weeks and went as low as 23 on June 5th. This level of implied volatility is wildly at odds with historical averages for such volatile periods. In the fall of 2008 and winter of 2009, VIX averaged north of 50. The Travel to VIX ratio then was around 4. When the VIX was trading at 25, the travel to VIX ratio was 7 - in other words, the VIX was almost twice as cheap as it should be based on historical precedent from 2008. That is why we saw such a big and quick VIX spike yesterday which quickly returned the VIX to the 40 area which is more in line with history. If the SPX continues to decline in the summer (and there are many fundamental reasons to think that would be the case), 40-45 is the right average level for the VIX.
It is good to keep in mind that the VIX represents expectations for volatility over the next 30 days so if market expects volatility to be suppressed for a month due to a holiday or sudden presence of liquidity (some big investor is coming to market to buy stocks or the Fed launches some bailout facility which ends up in a roundabout way providing liquidity to stock markets), it is not unusual for the VIX to drop dramatically well below what historical averages would suggest. That is usually an opportunity to buy VIX via VXX, TVIX, SPX options or some other way. As soon as the short-term liquidity reason that is propping up the market is removed, the VIX will quickly revert to its historical averages for the realized level of volatility we are currently experiencing. This may not have been the case if the market was driven higher by fundamental factors such as economic and earnings growth, but that is not the reality on the ground right now. Liquidity is driving markets and when liquidity dries up, implied and realized volatility will revert to historical guideposts.
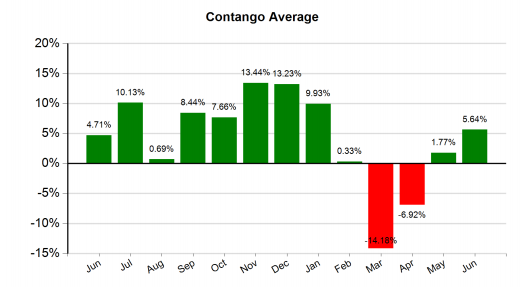
Many volatility traders are normally concerned by Contango – or the cost of carrying VIX Futures positions. The VIX futures curve is very flat these days with Contango of around 0% which means carrying VIX futures positions in VXX or other long volatility products for longer periods doesn’t incur the heavy costs we saw over the last 4-5 years.


