The US Dollar traded lower against other major currencies with the US Dollar Index (USDX) closing 0.22% lower as the upcoming holiday season brings down trading volumes in the US. The South African Rand (ZAR) was trading almost 3% stronger against the Dollar on Monday as the ruling ANC elected Cyril Ramaphosa who is seen as an anti-corruption and pro-business candidate. At the peak the USD/ZAR was over 8.7% lower on Monday compared to its level at the beginning of the month.
Gold traded higher as the tax reform could not add more momentum to the Dollar, which declined on Monday. Oil traded higher as a major oil pipeline in the North Sea is still not fully operational and the unionized workers in Nigeria began their strike.
US equity indices closed at record higher supported by strong bank/financial as well as basic materials stock prices.
While Bitcoin fell from it Sunday high to trading at around the $18 thousand level, other cryptocurrencies traded stronger on Monday with Bitcoin Cash, which is a fork from the Bitcoin blockchain reaching the level of $2,000 for the first time since its short-time surge on the 12th November.
On Tuesday the German IFO institute publishes the result of its business expectations and economic sentiment survey. In the US the Redbook Store Sales figures as well as housing starts and permit numbers will be released. The American Petroleum Institute (API) will release oil stockpile figures.
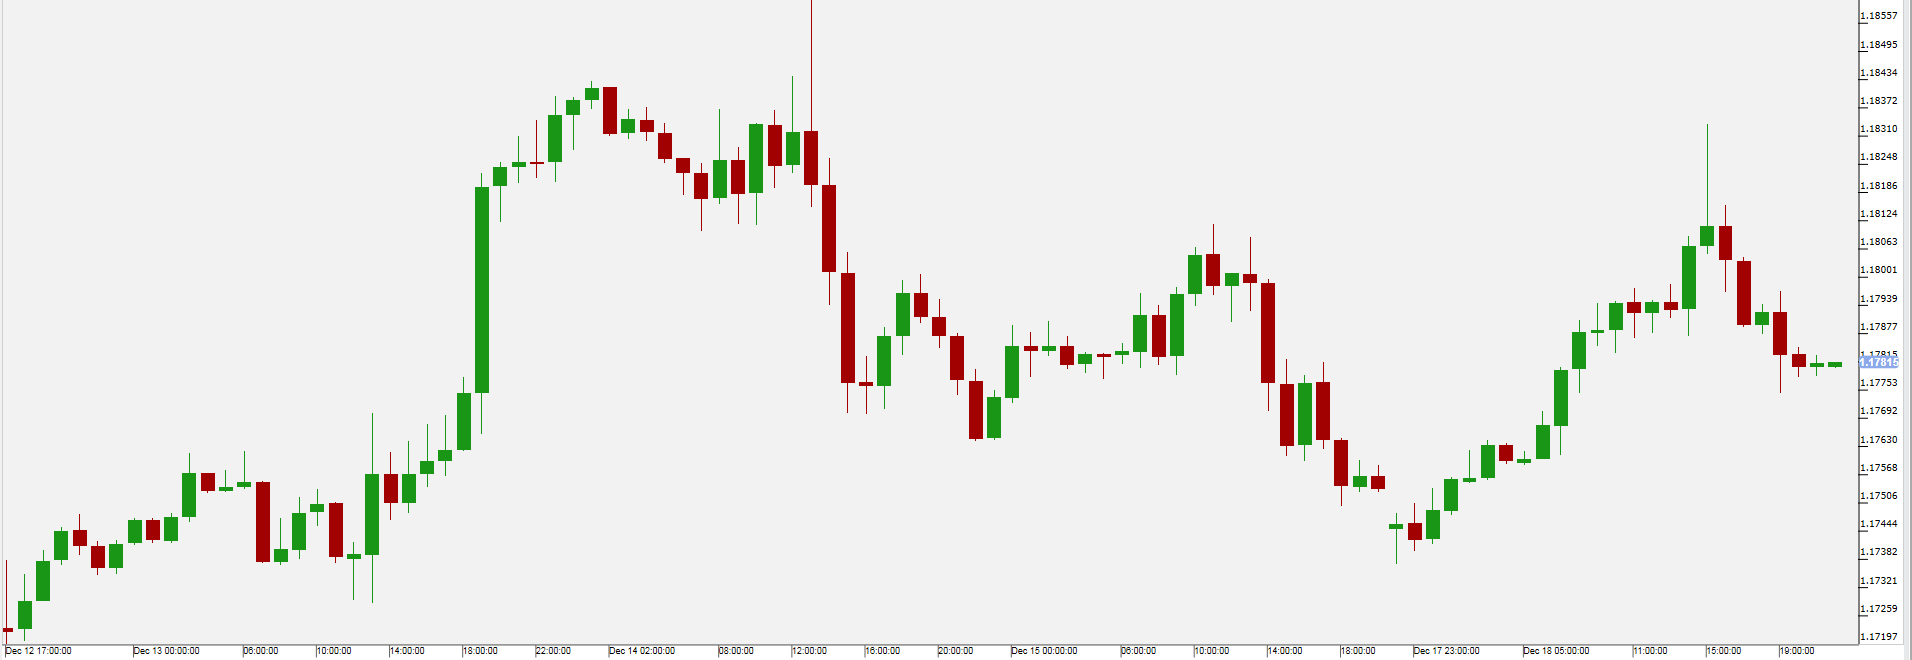
The EUR/USD traded higher due to lower trading volumes in the US ahead of the holiday season as well as higher annual inflation figures in the European Union as the Harmonised Index of Consumer Prices was at 1.5% (previously 1.4%). While the US tax reform will likely pass at last, there were increased concerns that the Republicans could face even more opposition after losing one Alabama Senate seat to the Democrats, as some media voices believe the Democrats could take over the Congress from the Republicans following elections in 2018.
On Tuesday the current account of the US trade balance is due to be published, as well as housing starts and permits data.

Pivot: 1.176
Support: 1.176 1.1735 1.1715
Resistance: 1.1815 1.1845 1.1865
Scenario 1: long positions above 1.1760 with targets at 1.1815 & 1.1845 in extension.
Scenario 2: below 1.1760 look for further downside with 1.1735 & 1.1715 as targets.
Comment: the RSI is mixed to bullish.
Bitcoin
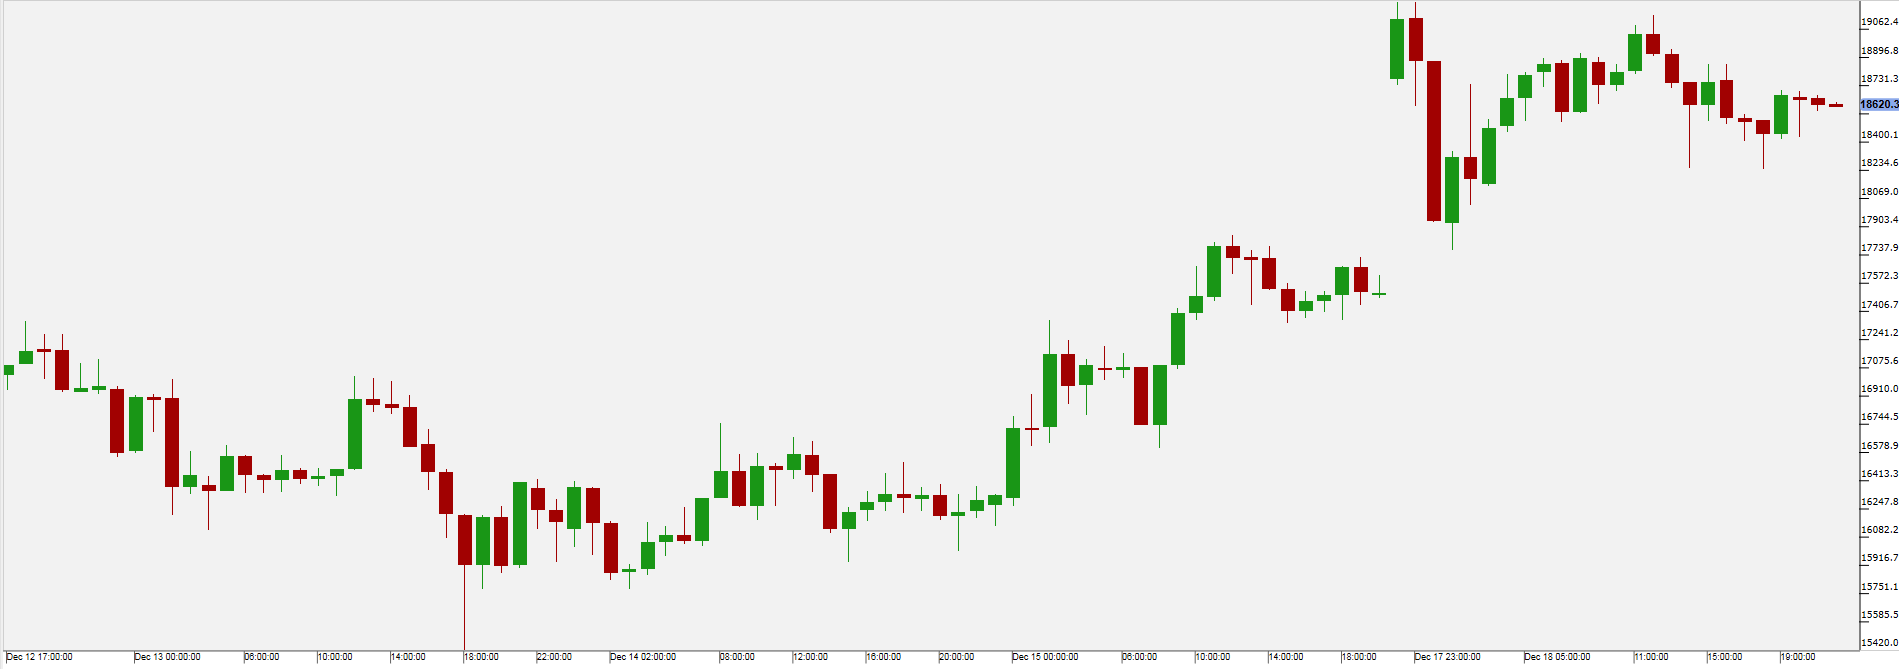
On Monday the CME Group (NASDAQ:CME) launched its Bitcoin futures settled via the aggregated BRR (Bitcoin Reference Rate), which will be based on prices of major cryptocurrency exchanges. This move is seen by some as a further milestone in making Bitcoin more mainstream and possibly accessible to ETFs. Meanwhile the French government pushes for regulation of the cryptocurrency via the G20 as to assure that the mostly anonymous transaction network is not misused for money laundering and terrorism financing. It is yet to be seen what these measures will look like. When China announced that cryptocurrency exchanges would not be allowed to operate within its borders in September, Bitcoin prices were significantly affected.

Pivot: 18276.6
Support: 18276.6 17322 16753.8
Resistance: 20246.8 20817.4 21388
Scenario 1: as long as 18276.63 is support look for 20817.38.
Scenario 2: the downside breakout of 18276.63 would call for 17322.01 and 16753.78.
Comment: the RSI is above 50. The MACD is below its signal line and positive. The pair could retrace. Moreover, the pair is above its 20 and 50 MAs (respectively at 18858.47 and 18531.76)
WTI Oil
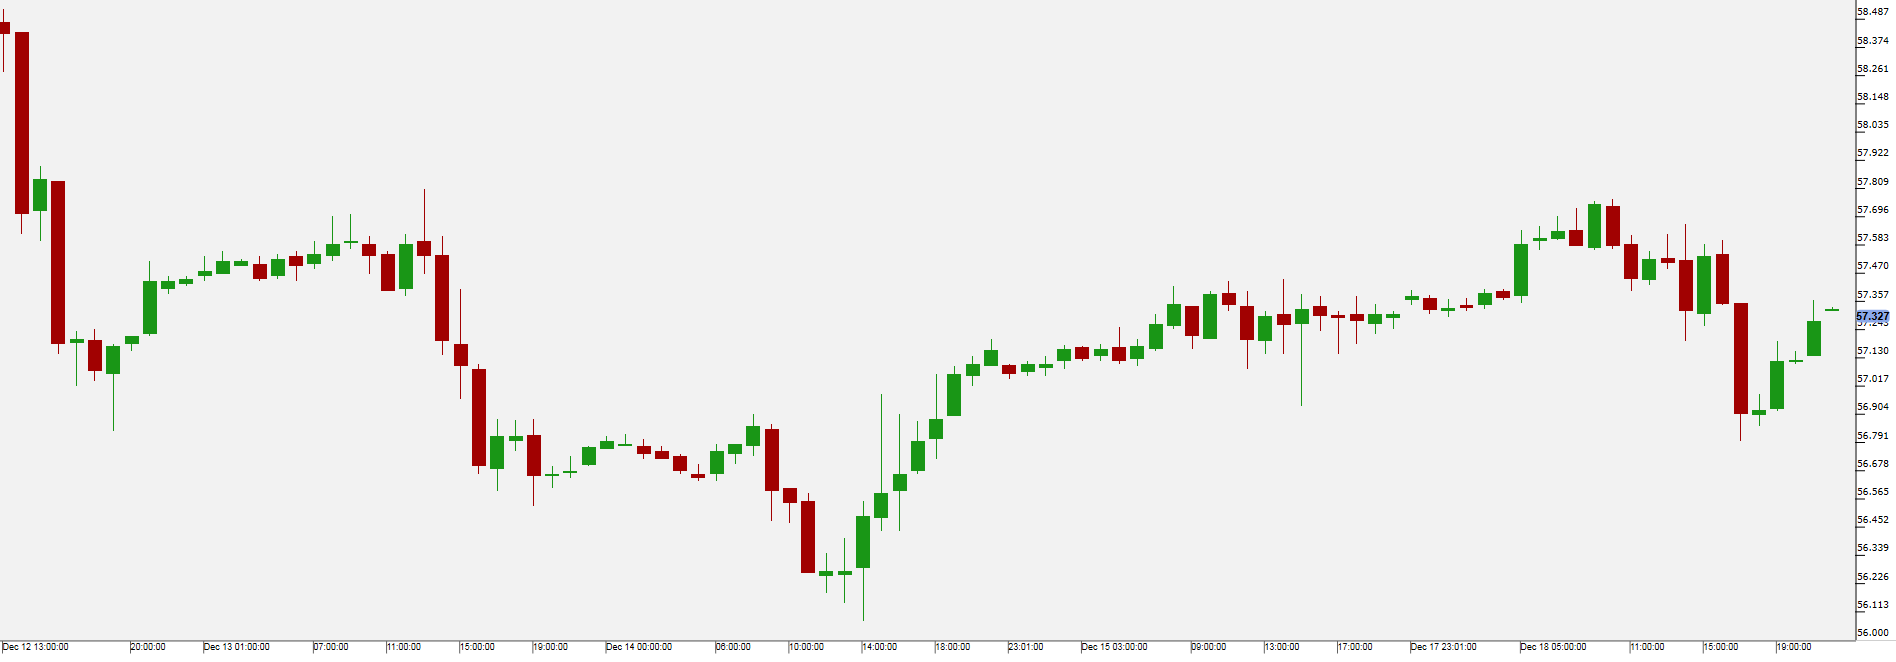
Oil traded higher as there is no solution in sight in Nigerian oil worker’s strike and the faulty North Sea pipeline (Forties) in the North Sea, which normally carries 450 thousand barrels per day, will possibly take up to four weeks to repair.
On Tuesday the American Petroleum Institute (API) will release oil stockpile figures, followed by the Energy Information Administration (EIA) on Wednesday

Pivot: 57.15
Support: 57.15 56.65 56.1
Resistance: 57.85 58.15 58.55
Scenario 1: long positions above 57.15 with targets at 57.85 & 58.15 in extension.
Scenario 2: below 57.15 look for further downside with 56.65 & 56.10 as targets.
Comment: the RSI is mixed to bullish.
US 500
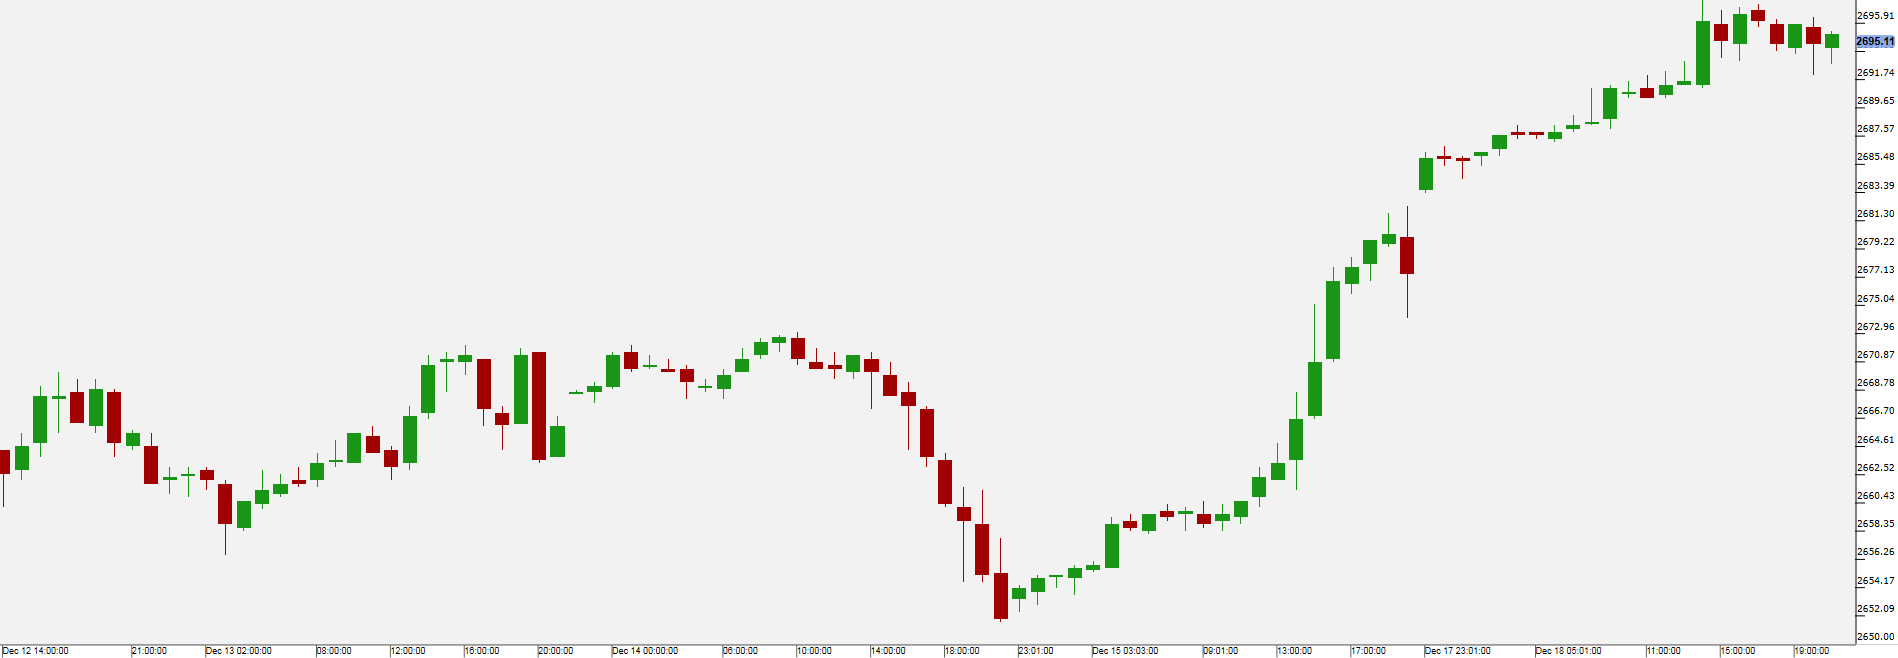
US equity indices traded significantly higher with the major indices like the S&P 500 (US 500) again reaching all-time record high. Significant gains were seen in basic material (US Basic Materials ETF +1.58%) and cyclical (US Cyclicals ETF +1.31%) stocks, while bank (US Banks ETF +1.40%) and financial (US Financials ETF +1.01%) were also strong. The lowest performing sectors were utilities (US Utilities ETF -0.98%) and biotech (US Biotech ETF -0.22%) values.
Twitter jumped 11.30% up on Monday as analysts from JP Morgen raised their price target for the social media company stock.
On Tuesday the Redbook Store Sales figures as well as housing starts and permit numbers will be released.

Pivot: 2684.5
Support: 2684.5 2675 2670
Resistance: 2700 2705 2711.5
Scenario 1: long positions above 2684.50 with targets at 2700.00 & 2705.00 in extension.
Scenario 2: below 2684.50 look for further downside with 2675.00 & 2670.00 as targets.
Comment: the RSI is mixed and calls for caution.
