Peak Stimulus?
Buy the rumor—sell the stimulus checks?
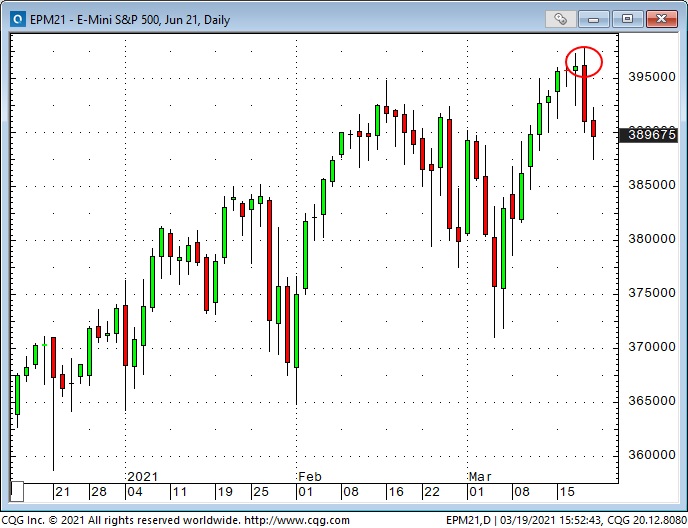
Stocks and commodities lurched higher, and the USD tumbled when Fed Chair Jerome Powell made it clear that the Fed would remain ultra-dovish; 24 hours later, stocks and commodities were lower, the USD was higher.
Last week may have been a MAJOR TURN week.
Was That As Good As It Gets?
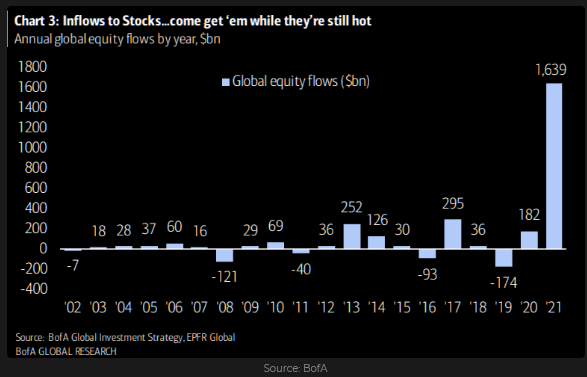
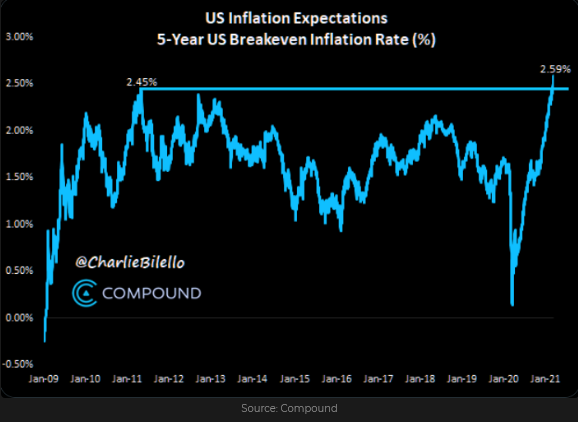
We’ve had massive equity inflows, stimulus checks, a super-easy Fed, a vaccine rollout going gang-busters, surging inflation expectations, a red-hot housing market; what could go wrong?
This chart shows 2021 equity flows annualized; as if the flows were sustained all year at the YTD pace.
People believe that stocks only go up; that inflation will surge higher. Nobody actually comes out and says it, but the crowd likes to think that the Fed is either stupid or lying when they claim that increases in inflation will be “transitory.” If inflation is “transitory” the crowd is heavily positioned the wrong way.
People want to believe that US President Joseph Biden is just getting started as far as stimulus programs are concerned. Maybe, maybe not. The Big Green Infrastructure Program may never get through Congress.
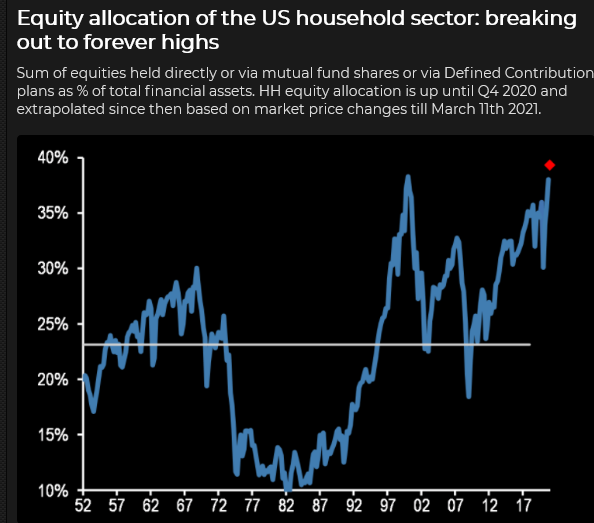
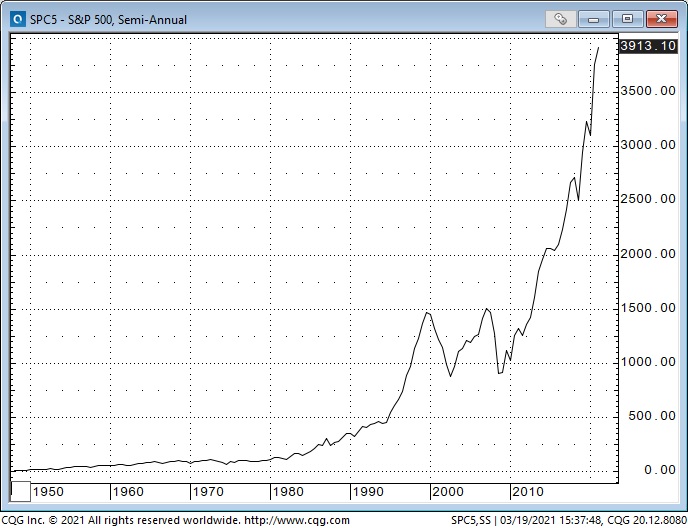
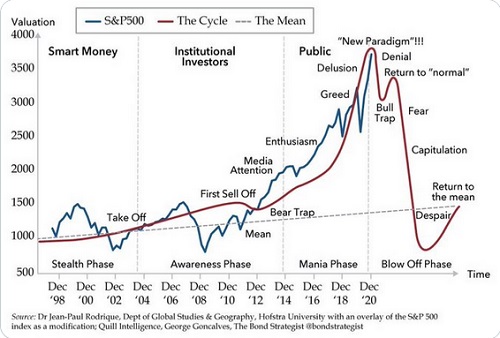
Here’s a long-term chart of the S&P 500 index. I’ve seen this chart pattern many times before, and while I understand the market can easily keep going up, I worry that we may be near the high point of the 2nd chart.
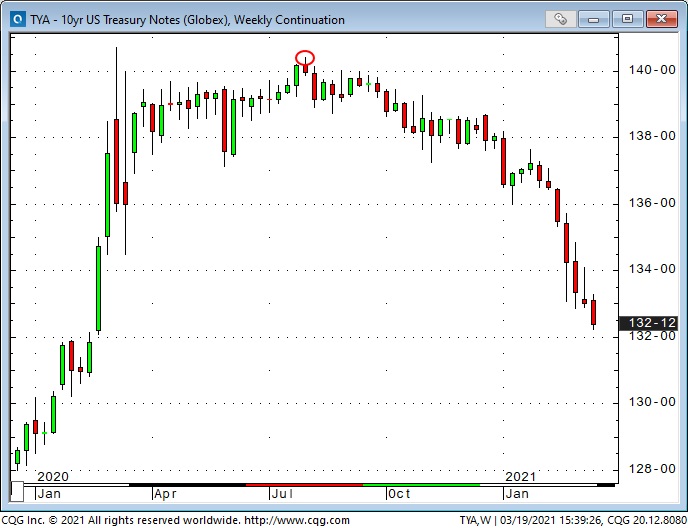
The yield on the 10-year Treasury bond jumped from ~0.5% last August to ~1.75% last week. A new generation of Bond Market Vigilantes has been testing the Fed. The 10-year Treasury yield is now greater than the S&P 500 dividend yield for the first time in over a year.
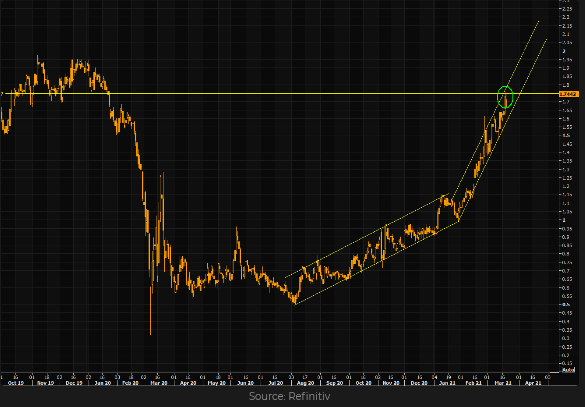
Bonds have fallen so fast that it makes me think they have been getting hit with “Get Me Out” orders. Bonds are now extremely oversold, and if (for some reason) stocks and commodities start falling, bonds could jump.
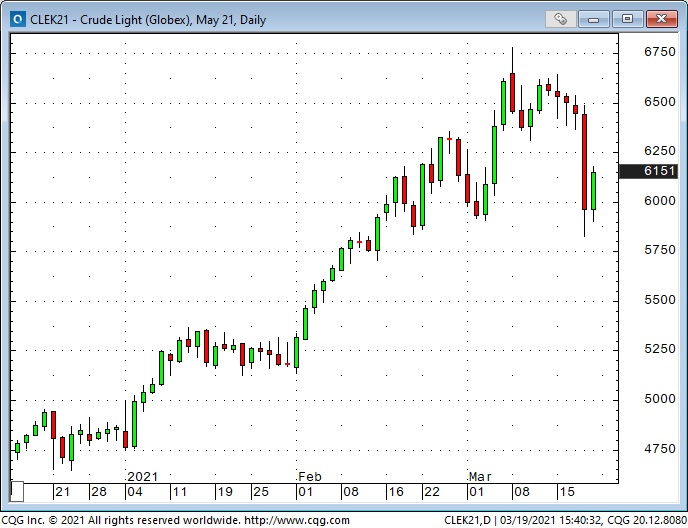
WTI rallied to a 28 month high near $68 last week (a double from November) but got hit hard with wave after wave of selling on Thursday. Perhaps there was a psychological connection between the waves of selling in stocks, bonds and crude!
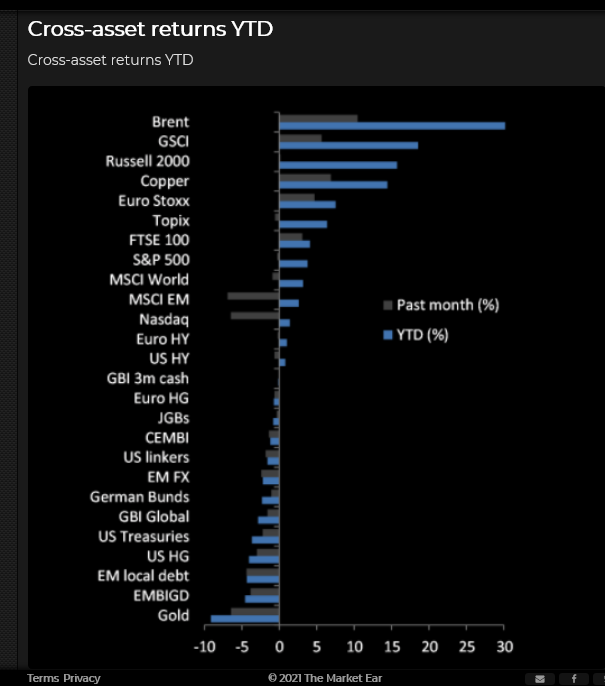
Fossil fuel energy was the DOG of the market last year—it has been the DARLING of the market this year-to-date. (Early last week I sent Martin Murenbeeld this chart and asked if he thought it was a good time to buy gold and sell crude; it looks tempting to me!)
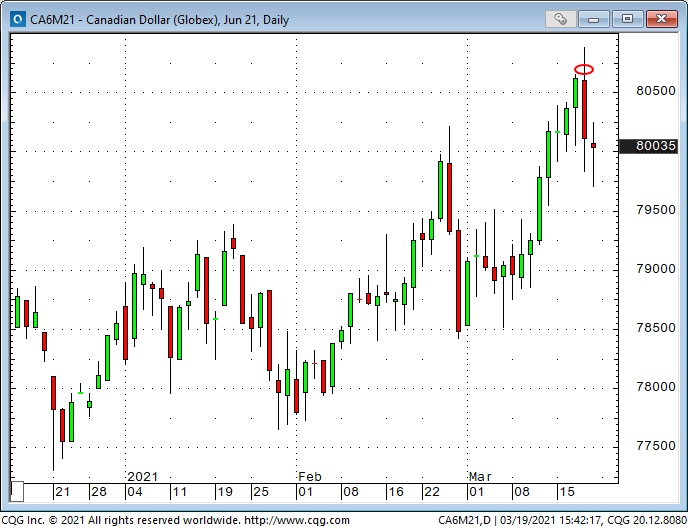
The Canadian dollar hit a 4-year low around 68 cents during the panic last March but has rallied (with the other commodity currencies) ever since and touched a 3-year high of ~80.90 cents following the easier-than-expected Fed announcement. The CAD sold off Thursday as stocks, bonds and commodities fell, creating a classic Daily Key Reversal on the charts.
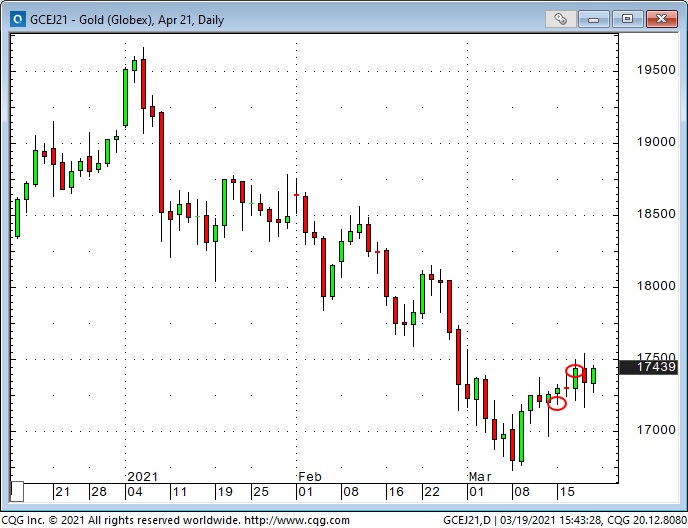
Gold has quietly rallied ~$75 from last week’s 10-month low. If copper has a Ph.D. in economics, gold has a Ph.D. in market psychology—and often moves before other markets. Gold has been “ignored” by the crowd lately while they have been busy buying other things on the reflation/inflation story. Last week I wrote that gold would rally on “uncertainty,” which is a polite word for fear.
My Short Term Trading
Last week I explained that my “bias” or my “Big Picture View” is that stock indices (and many other markets) have been pushed to preposterous levels by excessive speculation and are at risk of nasty corrections. I also explained that my “bias” was out-of-sync with current price action—that it’s hard to make money shorting a bull market!
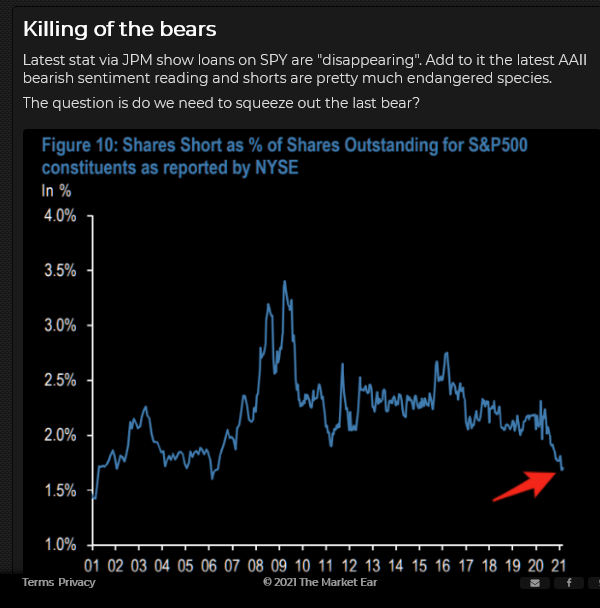
I started last week with a clean slate, looking for opportunities to trade in line with my “bias.” I sold CAD short with a tight stop last Monday when it appeared to be making a double top near 80 cents. I was stopped for a small loss. I sold it again Thursday when it reversed from a 3-year high. I remain short.
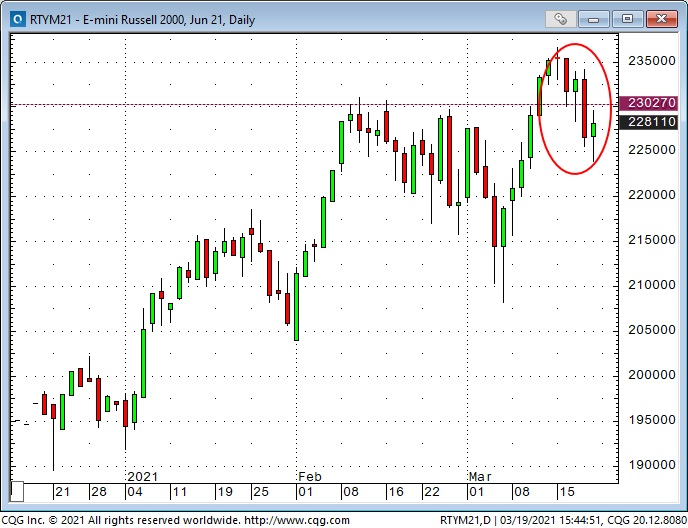
I sold Russell short a couple of times early in the week for small gains and sold it again Thursday when stocks, bonds, and commodities tumbled. I remain short.
I bought gold Monday (I liked the way it rallied back from the lows the previous Friday) and sold it for a $15 gain Wednesday when it rallied on the Fed announcement.
I think Bullish Enthusiasm may have peaked this week. I’ll be going through my charts looking for possible setups to short stocks and commodities while buying the USD. If market psychology gets jittery this week I will also look to buy bonds and gold.
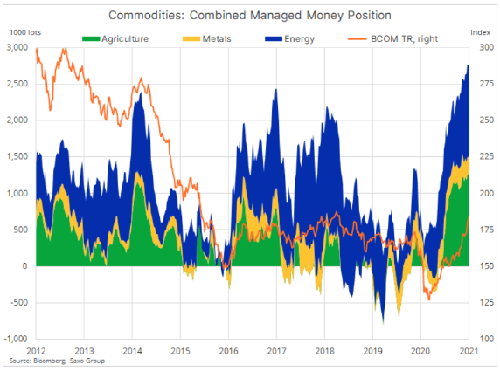
This chart shows Hedge Funds holding record-sized long positions in commodity futures. BCOM is a commodity index.
