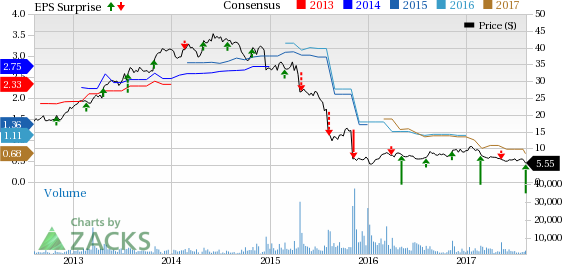
After witnessing negative earnings surprise in the first quarter of 2017, Iconix Brand Group, Inc. (NASDAQ:ICON) delivered positive earnings surprise of 52.9% in the second quarter. Also, its top line surpassed the Zacks Consensus Estimate. However, the company slashed its earnings and revenue guidance for 2017, which has hurt investors’ sentiments.

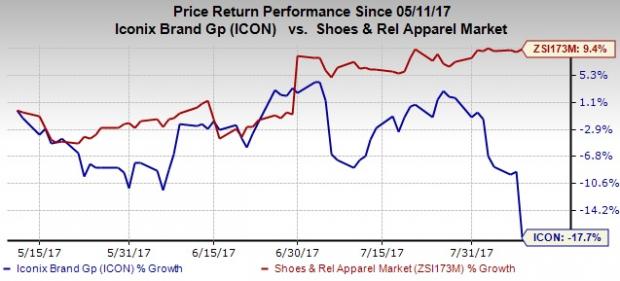
Consequently, shares of this Zacks Rank #3 (Hold) company declined 9.6% yesterday. Overall, the company’s shares have declined 17.7% in the last three months against the industry’s gain of 9.4%. The industry is currently placed at the top 14% of the Zacks Classified industries (36 out of 256). Meanwhile, the broader Consumer Discretionary sector gained 3.2% and is placed at the top 25% of the Zacks Classified sectors (4 out of 16).
Management revealed that it is deconsolidating its Southeast Asia joint venture owing to the venture partner's payment of the final purchase price installment with regard to the interest in the venture. The company received this payment in late June. As deconsolidation is a time-consuming process, Iconix issued preliminary second-quarter results, which excludes the effect of the deconsolidation.
Q2 Highlights
The company posted adjusted earnings from continuing operations of 26 cents per share that outpaced the Zacks Consensus Estimate of 17 cents, and also increased 4% from the prior-year quarter. Further, adjusted for non-cash taxes associated with the amortization of wholly-owned intangible assets, earnings came in at 39 cents, compared with 40 cents in the prior-year period.
However, on a GAAP basis, Iconix incurred loss from continuing operations of 30 cents per share versus earnings of 21 cents posted in the year-ago period. This is attributable to the licensee termination expenses as well as loss from the early extinguishment of debt.
Total licensing revenues of $61.6 million beat the Zacks Consensus Estimate of $31 million by 98.7% but declined 10% from the year-ago quarter. Excluding the Sharper Image brand’s revenue, the same fell nearly 7% in the quarter. The year-over-year decline mainly stems from lower revenues at the Women’s and Men’s segments, which were more than offset by revenue growth at the Home and International segments.
Revenues at the Women’s segment dropped 12% to $27.6 million, while the Men’s segment reported an 18% decline to $10.0 million. However, revenues increased 7% and 3% at the Home and International segments, respectively.
Operating income came in at $12.1 million, down nearly 68.2% from $38 million in the year-ago quarter. Excluding operating income of nearly $1.5 million associated with the Sharper Image brand incurred in the prior-year quarter and the charge of $23.2 million related to licensee terminations as well as loss of $1.1 million from the sale of trademarks, adjusted operating income dipped 6% to $35.3 million.
Financial Update
The company ended the quarter with roughly $313 million of total cash and $980 million face value of debt. In the reported quarter, it paid nearly $224 million of debt, along with the additional payment of $167 million, subsequent to June 30, 2017.
Further, Iconix generated nearly $10.6 million as free cash flow from continuing operations versus $38.7 million in the year-ago quarter.
Outlook
Management remains impressed with its second-quarter results, which reflects improvement from the previous quarter.
The company has two main objectives for the year, which are strengthening its balance sheet and executing the organic growth strategy. Notably, its near-term balance sheet goals are considerably completed with the refinancing activities announced last week. Though organic growth is taking more time than initially expected but management remains on track to fulfill its objectives.
Meanwhile, Iconix has slashed its earnings and sales guidance for 2017. Management now projects full-year licensing revenues in the band of roughly $225–$235 million, down from $235−$245 million, guided earlier. The decline can be attributable to the transition of certain licensees, timing of definite new strategies and deconsolidation of the Southeast Asia joint venture. However, the deconsolidation is likely to have no effect on the second-quarter revenue. In fact, revenue from this operation will be reported in the company's equity earnings on joint ventures line.
Furthermore, management anticipates 2017 adjusted earnings in the range of 65–70 cents, versus 70–85 cents, projected earlier. However, the Zacks Consensus Estimate is currently pegged higher at 78 cents per share, which is likely to witness downward revisions. However, on adjusting the tax benefit, it anticipates non-GAAP earnings of $1.16–$1.21 for 2017, down from previously stated guidance range of $1.21–$1.36.
Moreover, on a GAAP basis, the company expects to incur loss per share in the range of 1–6 cents versus earnings of 29–44 cents, predicted earlier.
Additionally, management projects free cash flow in the band of $65–$82 million versus $105–$125 million, guided earlier.
Stocks to Consider
Better-ranked stocks in the same industry include Caleres, Inc. (NYSE:CAL) , Rocky Brands, Inc. (NASDAQ:RCKY) and Steven Madden, Ltd. (NASDAQ:SHOO) sporting a Zacks Rank #2 (Buy). You can see the complete list of today’s Zacks #1 Rank (Strong Buy) stocks here.
Caleres, with a long-term earnings growth rate of 11% has delivered positive earnings surprise of 11.1% in the last reported quarter.
Rocky Brands has pulled off an impressive average positive earnings surprise of 224.8% in the trailing four quarters.
Steven Madden, with a long-term earnings growth rate of 12.3% came up with an average positive earnings surprise of 7.1% in the last four quarters.
One Simple Trading Idea
Since 1988, the Zacks system has more than doubled the S&P 500 with an average gain of +25% per year. With compounding, rebalancing, and exclusive of fees, it can turn thousands into millions of dollars.
This proven stock-picking system is grounded on a single big idea that can be fortune shaping and life changing. You can apply it to your portfolio starting today.
Iconix Brand Group, Inc. (ICON): Free Stock Analysis Report
Steven Madden, Ltd. (SHOO): Free Stock Analysis Report
Rocky Brands, Inc. (RCKY): Free Stock Analysis Report
Caleres, Inc. (CAL): Free Stock Analysis Report
Original post

