I have spotted a lot of potential Head and Shoulders patterns in the broad market and individual names the past couple of weeks. If you are not familiar with it a definition can be found in Investopedia. But you already know this pattern, right, everybody does.
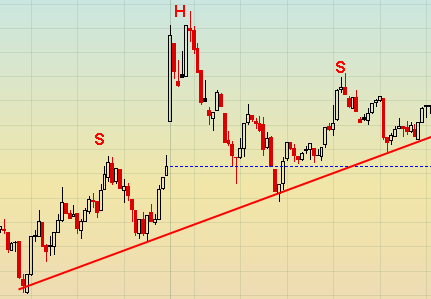
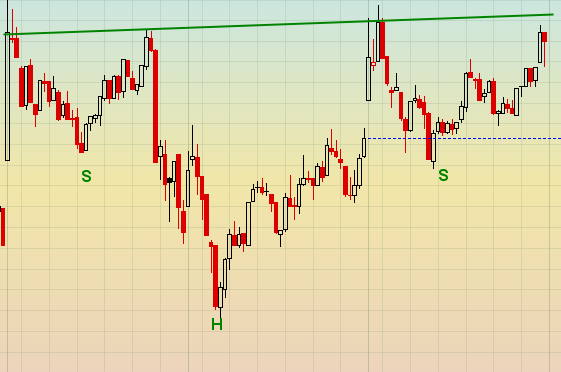
This pattern has become extremely popular to talk about and to look for. You even see it coming up in advertisements for on-line brokerage trading tools. When it is discussed, it is often mentioned in the same statement that it is an extremely reliable reversal pattern. This is one good reason that it is popular. Here are two illustrations of Head and Shoulders pattern taken from recent market activity. The Head and Shoulders Top would signal a reversal lower and the Head and Shoulders Bottom would signal a reversal higher. Simple. But but reliability of this pattern is determined by sticking to several details that often get short cut.
Head and Shoulders Top

Inverse Head and Shoulders Bottom

There are several rules to note when looking for these patterns:
Description
The shoulders should be about the same distance from the neckline and the head must be further away. Three humps of the same size does not count. Price must touch the neckline between each segment of the formation, this is not horseshoes.
Price Potential
The market technician expects the completion of the pattern to result in a price move equal to or greater than the distance between the top of the head and the neckline, from the point where price breaks the neckline following the formation of the right shoulder.
Confirmation
This only occurs when the price breaks through the neckline after forming the right shoulder, not when it touches or comes close, or starts to head lower to the neckline. Remember that the neckline is support so it should first be expected that it will not break.
Keep your Head
We are all people with heads and shoulders and necklines so we all think we know when we recognize this pattern. But keeping to the rules above will save money and heartbreak when a price pattern that is similar or close turns out not to follow through. Also, like any technical pattern, it is significant because it has worked to some degree in the past, but only gives the trader a potential edge, not a guarantee. These patterns can fail. Don’t let the giddiness of a Head and Shoulders lead to losing your Head.
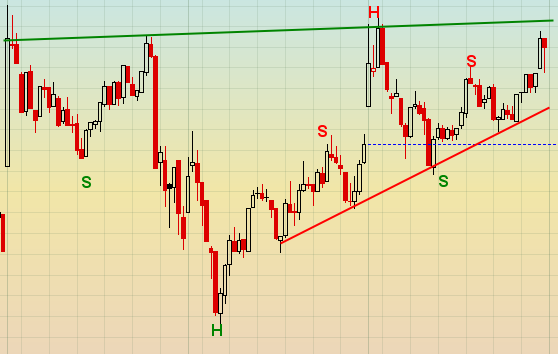
By the way, did you recognize that the two charts above overlap? Here is the combined chart below. It is for the S&P 500 Index, SPX, for the early December 2010 on a 15 minute timeframe.

.The information in this blog post represents my own opinions and does not contain a recommendation for any particular security or investment. I or my affiliates may hold positions or other interests in securities mentioned in the Blog, please see my Disclaimer page for my full disclaimer.
