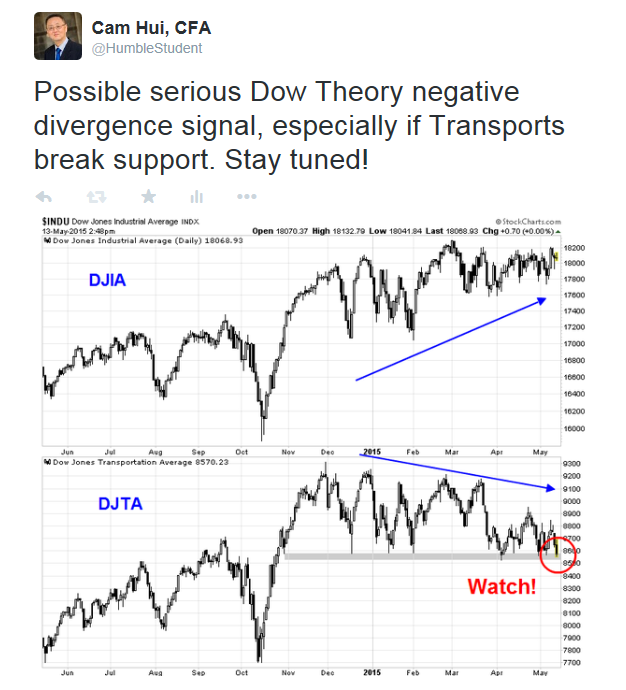
Last week, I pointed out the negative divergence between the Dow Jones Industrials averages and the Transportation average. The latter was not only weak, but it was testing a key support level. Such an event was a typical non-confirmation of the DJIA bull trend.
The observation prompted push back in the blogosphere and on Twitter. A typical example came from Josh Brown, who said that the Transports don't matter much anymore as the character of the stock market had changed since Charles Dow first wrote about the Dow Theory.
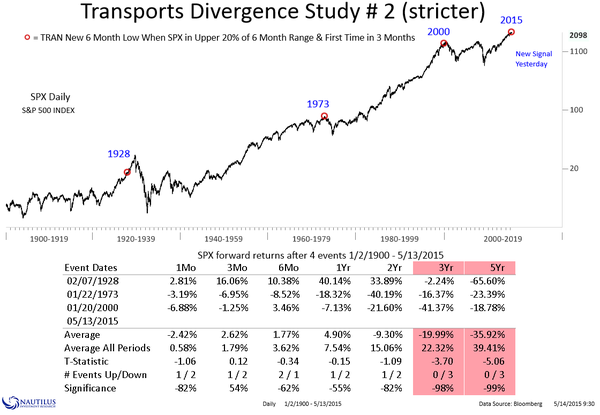
However, Nautilus Research found that negative divergences of the SPX with the Transports was bearish, though the sample size was very small:
Mark Hulbert more or less said the same thing:
How bearish is this divergence? To come up with an answer, Jack Schannep recently focused on periods over the past 25 years that included big divergences. Schannep is the editor of a market-timing advisory service called TheDowTheory.com.
Schannep found 14 such instances. In nine of them, he says, the broad market subsequently dropped by less than 10%. But in the remaining five cases, the stock market’s eventual decline averaged 25.7%.
Those are sobering odds. If we average all 14 instances of prior divergences similar to the current one, the market eventually fell more than the 10% threshold for a correction. If that turns out to be the case this time around, it would be the first correction since 2011.
Even more ominous is that in five of the 14 cases, or more than a third of the total, the divergences presaged a full-scale bear market. In fact, Schannep points out that when the broad market hit its bull-market highs in 1990, 1998, 2000 and 2007, the Dow Transports in each case had already turned down several months before.
Notwithstanding the bearish analysis from Nautilis and Schannep, I would be philosophically inclined to agree with the naysayers about the importance of the Transports. No indicator is perfect, particularly an indicator as old as the DJIA-DJTA link. Technical indicators have to be viewed as part of a mosaic and the analyst has to see what the big picture is telling him.
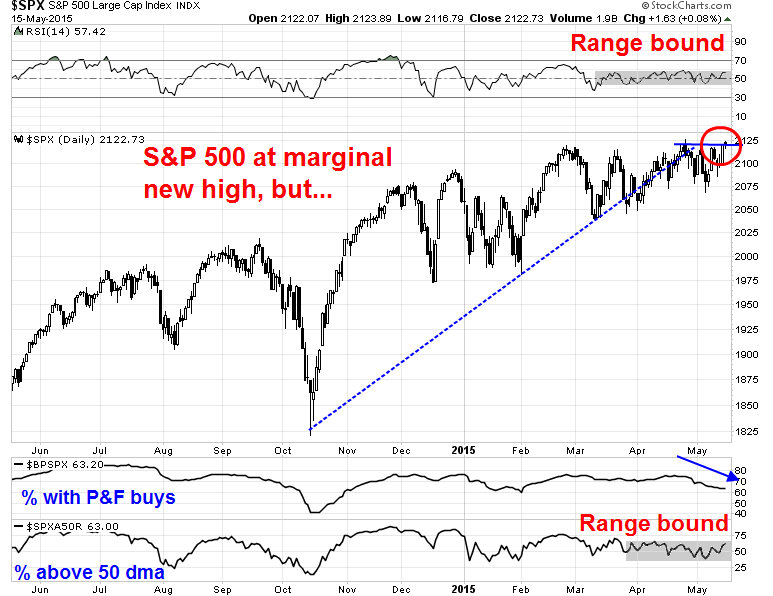
The comparison of the DJTA with the DJIA is a well-known technique of looking for breadth confirmation of a move. So why all the hate? Good technical analysts need to consider the big picture on indicators like breadth. Even as the SPX achieved new highs on Thursday or Friday, indicators like RSI and % above the 50 dma remain range bound, indicating a lack of momentum. In addition, % on point and figure buys is in a downtrend, showing a negative divergence.
Weakness in the Transports is only one data point. On the other hand, when you look at the big picture on breadth and momentum, how much confidence would you have about the all-time highs achieved by the SPX?
Disclosure: Cam Hui is a portfolio manager at Qwest Investment Fund Management Ltd. ("Qwest"). This article is prepared by Mr. Hui as an outside business activity. As such, Qwest does not review or approve materials presented herein. The opinions and any recommendations expressed in this blog are those of the author and do not reflect the opinions or recommendations of Qwest.
None of the information or opinions expressed in this blog constitutes a solicitation for the purchase or sale of any security or other instrument. Nothing in this article constitutes investment advice and any recommendations that may be contained herein have not been based upon a consideration of the investment objectives, financial situation or particular needs of any specific recipient. Any purchase or sale activity in any securities or other instrument should be based upon your own analysis and conclusions. Past performance is not indicative of future results. Either Qwest or Mr. Hui may hold or control long or short positions in the securities or instruments mentioned.
