Myth Busters Part III
Is it logical for equity investors to be concerned about any of the following?
- Weakness in economically-sensitive small caps.
- A near-record low Volatility S&P 500 “Fear Index”.
- Recent demand for defensive bonds.
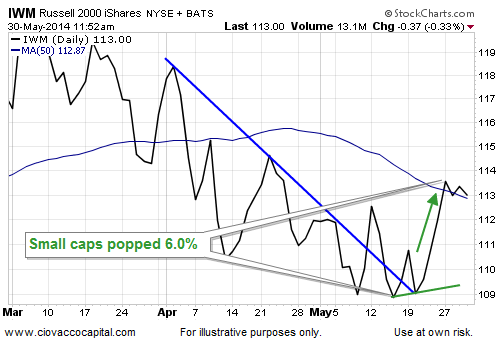
The answer is “yes”. The three bullet points above are relevant to the stock market’s risk-reward profile. However, the question is how relevant? We recently showed examples that aligned with the theory that “nothing says small caps cannot begin to find their footing again”. After making an intraday low on May 15, small caps (ARCA:IWM) rose 6.0%, telling us to keep an open mind about the possibility of a sustained rally in higher-risk/higher-reward stocks.
Building The Flexibility Case
In a detailed May 29 article, we showed it is possible for stocks to post impressive gains during a period when the VIX rises significantly from low levels. The purpose of the small cap and VIX articles is not to build a bullish case, but rather to emphasize the importance of respecting both the bullish and bearish cases for stocks; doing so allows us to maintain the always-important flexibility needed to remain aligned with the market’s current profile.
Bonds: How Concerned Should Stock Investors Be?
It has been easy to find “bonds are saying be careful with stocks” articles in recent weeks. It is prudent to be concerned when demand for defensive-oriented bonds is strong. However, it is also prudent to ask:
Can stocks and bonds rise in unison for long periods of time?
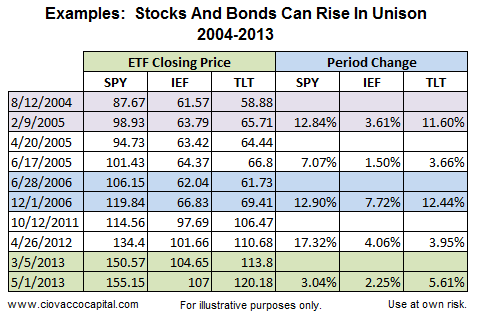
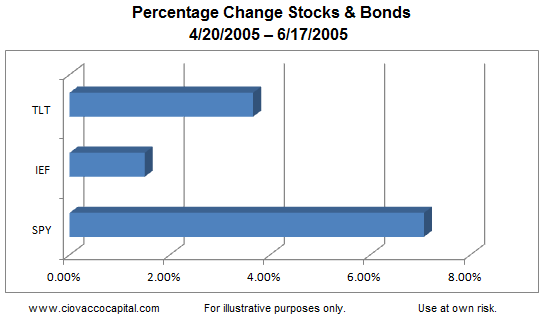
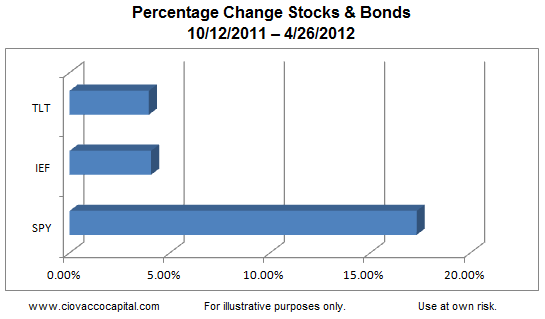
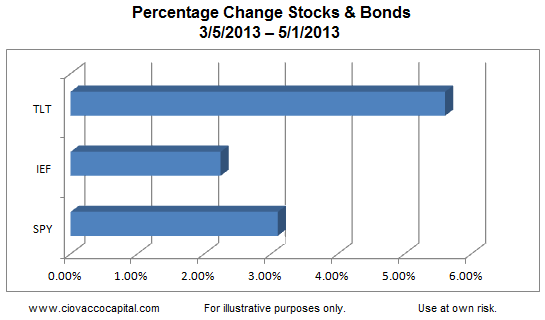
As shown in the table below, the answer is yes. The S&P 500 (SPY), intermediate-term Treasuries (ARCA:IEF) and long-term Treasuries (ARCA:TLT) all posted gains in the periods shown.
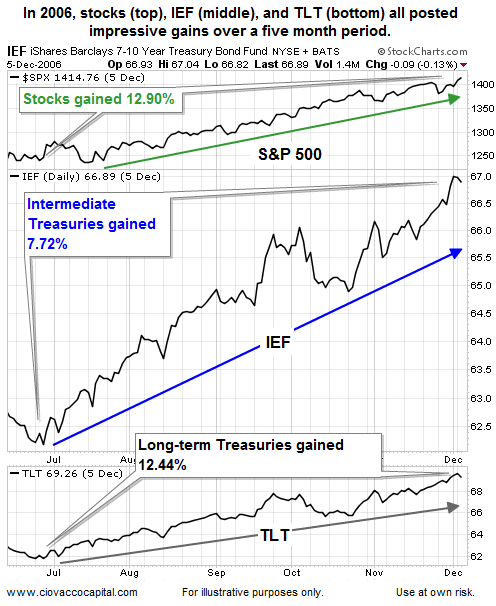
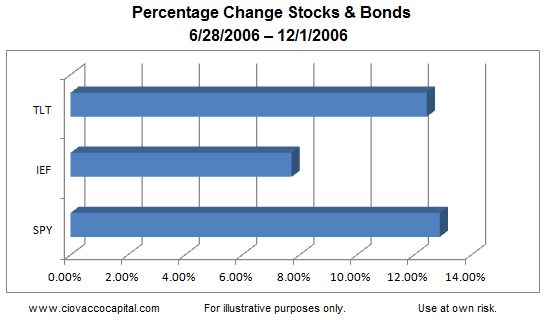
The chart below shows one of the periods in the table: June 28, 2006 to December 1, 2006.
But, The Economy Is Much Different Today, Right?
Yes, the economy in 2014 is quite a bit different than all the historical periods referenced above. The same argument can be made for any period we cite as potentially bearish evidence for stocks when bonds were strong. The point of the article is not to compare economic similarities, but rather to answer the simple question – Is it possible for stocks and bonds to rise in unison for extended periods of time? The answer is yes.
A Bar Is Worth A Thousand Words
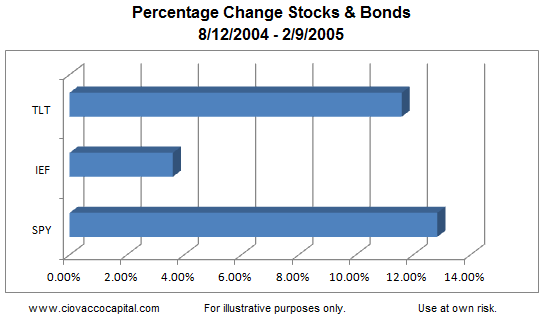
Since a table of numbers does not provide a visual reference point, we have provided the bar graphs below showing the percentage changes of SPY, IEF and TLT for each period in the table.
Investment Implications
How do we use all this? Small caps, the VIX and bonds are all helpful in terms of managing stock market risk. However, there are more effective ways to monitor the big picture for equities. For example, stocks cannot morph into a corrective state until we see visible signs of a breakdown on the weekly chart below. The top portion of the image below shows what the early stages of a correction looks like; the bottom portion shows the market as of 2:24 p.m. EDT Friday.
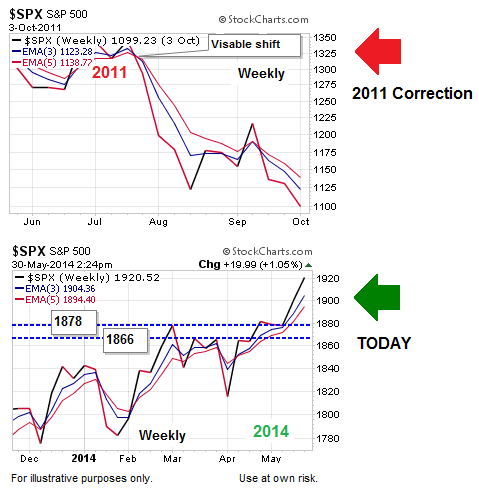
If the 2014 chart above maintains its present look, it does not matter what small caps, the VIX, or bonds are doing; it is not possible for too many bad things to happen, especially a multi-month correction or new bear market. Therefore, until a breakdown in the major averages occurs, worrying about bonds may do nothing but sap productive energy from well-intentioned investors.
