1929, 2008 and, now, 2020.
We’ve only seen this level of “selling pressure” three times since 1900. A limited sample size, sure, but we’re in ominous company. Anything and everything has been dumped in a panic liquidation to raise cash.
We saw a similar “global margin call” in late 2008. A year’s worth of selling crescendoed into a financial crisis grand finale that would eventually conclude in March 2009.
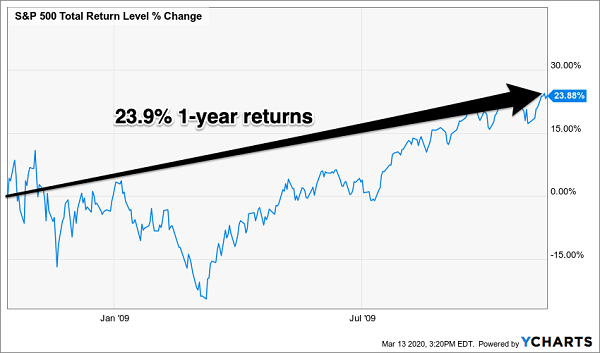
The good news then? If you held tight or, better yet, bought through the panic, you eventually did quite well. Let’s take the worst day of that year. On October 15, 2008, the S&P 500 slid 9% in one day. If you bought then, you needed a strong stomach because it continued to decline (with high volatility) for a few more months. But buyers were ultimately rewarded. They earned 23.9% returns in just one year—one that included the early 2009 slide:
A “Close Your Eyes and Buy” Moment…

However, there is a potentially big difference between the 2020 and 2008 crashes. Back then, we were closer to the end of the recession. Right now, we may just be sliding into one.
There are two types of bear markets (defined as a drop of 20% or more in stocks). The first is a scary plunge that does not result in a recession, like we saw in the fourth quarter of 2018. They tend to peter out around 20%, and that’s exactly what happened in late ’18.
Now here’s the thing. During the drop, nobody really knows if a recession is on the way (or here already). In hindsight, it’s obvious—but then again, aren’t all stock charts simple when you view them from the right-hand side?
The middle of the chart is trickier to navigate. However, last week’s collapse likely ruled out a “mere correction” and perhaps even guaranteed a recession. And recessionary bear markets tend to draw the S&P 500 40% to 50%+ lower from peak to trough. So, while we are “due” for a bounce, we can no longer be sure that any rally is going to have sustained legs.
This means we must change our income investing strategy immediately. Here’s what we need to do next to position our portfolios to first, survive and second, thrive in the year ahead.
First, Liquidate the Losers
Mere stock market corrections of 10%, 15% or even 20% don’t change the structure of the economy. Let’s consider the correction of 2018. The leading stocks heading into that fourth quarter drop emerged from it as the strongest shares to hold in 2019.
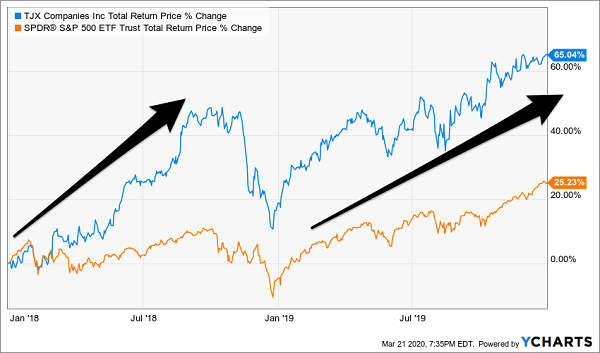
Take TJX Companies (NYSE:TJX), a true dividend grower. Through 2018 and 2019 the firm delivered dividend growth of 47.2%. Its stock corrected sharply in late ’18 but emerged as powerful as ever and sailed through 2019. No economic reshuffle here, and this strong name stayed strong:
Strength to Strength (When No Recession)

Unfortunately, the world has been flipped on its head since February. TJX relies on in-store, in-person sales. Its 2020 numbers are going to be seriously impaired and, who knows how the company emerges after social distancing and the likely follow-on recession. These shares are likely to remain weak for a while.
I like the company long-long-term and believe the stock can still do great between now and March 2025. However, I’m not sure about March 2021. So, a better bet is to sell the shares to raise cash, which can then be redeployed more profitably.
Then, Keep the Powder Dry
Markets have been slammed and the “bottoming process” typically takes weeks to months after this type of damage.
Is a relief rally on the way? Probably, and it may be one that you and I can profitably trade. (I compile my broader market signals after the market closes every day, and when we do get a “bullish” signal from Mr. Market, I will let you know.)
However, the highest probability play is the money we’re going to put to work when:
- The bear market finally puts in a major bottom. It usually does so quietly, without much fanfare or many believers. It usually happens when…
- Some stocks “get up off the mat” and climb to new highs, while fewer stocks drop to new lows. This is what happened between October 2008 and March 2009. Even though the indices made a lower low in March, there were fewer stocks in the grasp of the bear. This was a “bullish divergence” and ultimately the tipoff to an 11-year rally.
Most investors only pay attention to the broader indices, so these undercurrents go unnoticed. That is good news for us.
At the moment, I’m staring at historic levels of new lows with respect to new highs across any and every category I can think of. This is a sign that markets are completely oversold. However, it doesn’t mean they can’t go even lower.
Until we do see some stocks get up off the mat (which is a sign that markets are once again “working” and liquid), we should not be afraid to sit on our cash, or super safe bonds that are cash equivalents. We may see “once in a generation” buying opportunities ahead. It’s important to have cash in our pockets for that big moment.
Finally, We’ll Buy the Best Dividends for “Dimes on the Dollar”
The strongest dividends in March 2009 stayed strong for 11 years. The economic snow globe had just been shaken up, and the winners had smooth sailing until, well, last month.
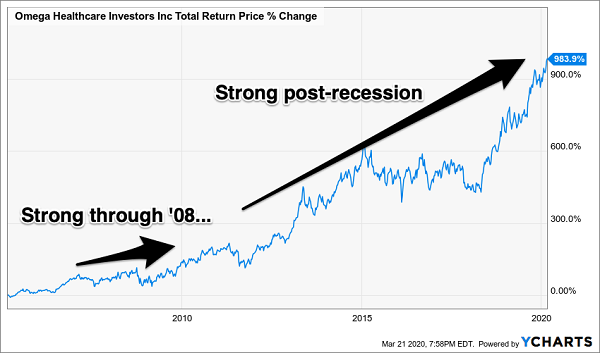
One hint that an income stock was destined for a big 2010s decade? In the case of Omega Healthcare Investors (NYSE:OHI), it motored through the 2008 pullback without much of a problem:
A Hint for Post-Recession Strength

Why the stock strength in ’08? The firm paid a fat dividend, Mr. Market realized the dividend was safe and (amazingly) even financial crisis-proof. So, the stock didn’t budge.
Fast-forward to today, and OHI’s price action is indicating it’s lost its edge, at least for now. Whether it is the current pandemic or the unfolding recession, we should use this as our cue to sell or avoid these shares for the time being and rebalance our portfolio towards dividends that are more appropriately aligned for our suddenly-socially-distanced world.
Introducing the “Pandemic-Proof” Income Portfolio Paying Up to 13%
The “cash or bear market” no-win quandary inspired me to put together my 5-stock “Pandemic-Proof” portfolio, which I’m going to GIVE you today.
These five income wonders deliver two things most “blue-chip pretenders” don’t, such as:
- Rock-solid (and growing) cash dividends up to 13%.
- A share price that doesn’t crumble beneath your feet while you’re collecting these massive payouts. In fact, you can bank on 7% to 15% yearly price upside from these five “steady Eddie” picks.
With the Dow regularly lurching a stomach-churning 1,000 points (or more) in a single day, I’m sure a safe—and growing—8% every single year would have a lot of appeal.
And remember, one of these titans pays up to 13%.
Think about that for a second: buy this incredible stock now and every single year, nearly 9% of your original buy boomerangs straight back to you in CASH.
If that’s not the very definition of safety, I don’t know what is.
These five stout stocks have sailed through meltdown after meltdown with their share prices intact, doling out huge cash dividends the entire time. Owners of these amazing “Pandemic-Proof” plays might have wondered what all the fuss was about!
These five “Pandemic-Proof” wonders give you the best of both worlds: CASH dividends up to 13%, with your feet firmly planted on a share price that holds steady in a market inferno and floats higher when stocks go Zen.
Disclosure: Brett Owens and Michael Foster are contrarian income investors who look for undervalued stocks/funds across the U.S. markets. Click here to learn how to profit from their strategies in the latest report, "7 Great Dividend Growth Stocks for a Secure Retirement."
