Folks, there is a technical breakdown on the charts of the small-cap, growth, and technology groups in the stock market. I can’t say I’m surprised, given the major run-up in 2013 and the lack of any significant stock market correction.
The fact that the majority of the high-momentum technology stocks have corrected more than 20% is a red flag that there could be more breakdowns on the charts.
While I’m not saying that a bear stock market is on the horizon, I do suggest that the stock market risk is above-average at this time, and we could see a bigger correction pending.
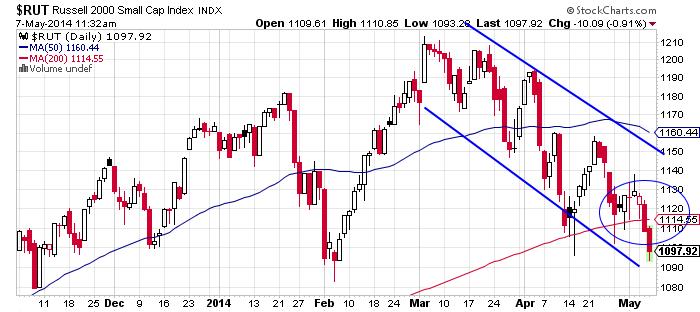
On May 6, there was a downside break of the Russel 2000 to below its key 200-day moving average (MA) of around 1,114. This could signal additional downside moves. As of that time, the index was down 4.78% in 2014 and 8.56% from its record high. The previous time the index corrected 10% from its high, it was subsequently met with buying support in the stock market. Note the downward-trending channel on the Russell 2000 chart below.

With the break, you could consider adding the iShares Russell 2000 Index (ARCA:IWM) exchange-traded fund (ETF) as a play on a possible bounce in small-cap stocks, especially if the index corrects more than 10%.
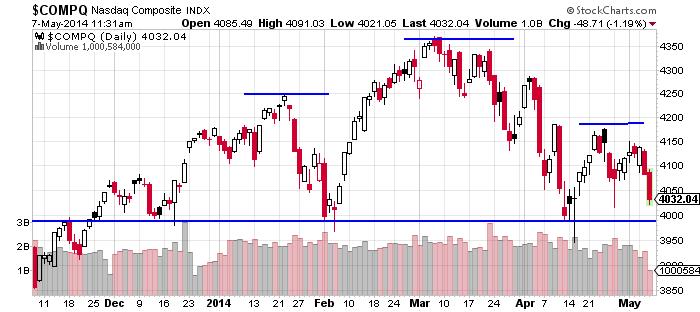
Technology also continues to be fragile, with the NASDAQ south of its 50-day MA. Watch for a possible move and testing of the 200-day MA at 3,982. This index has corrected 6.67% from its recent high and looks to be setting up for another move below 4,000. If this happens, it would mark the third time this year that the index would have failed to hold above 4,000, which is another red flag. Moreover, as I have shown on the chart below, the presence of a possible bearish head-and-shoulders formation on the NASDAQ is concerning for technology stocks.
The lack of any leadership from technology stocks, which was so prevalent in 2013, has also hurt the broader stock market.
For the NASDAQ, the investor sentiment readings have also weakened, which indicates corrosion in investor confidence in the stock market. Investor sentiment last flashed a bullish reading on April 22, as well as on April 3. This is a red flag for the technology stock market, based on my technical analysis.
In addition, trading volume has been light. The last time volume was greater than two billion was on April 16. It’s clear the appetite for higher-beta stocks is low at this time, so I’d suggest investors exercise caution.
You can protect against downside risk on the NASDAQ by buying put options on the Powershares QQQ (NASDAQ:QQQ) ETF. Keep in mind that you can also divest of some of your higher-beta positions and shift some capital into the more conservative big-cap stocks.
Disclaimer: There is no magic formula to getting rich. Success in investment vehicles with the best prospects for price appreciation can only be achieved through proper and rigorous research and analysis. The opinions in this e-newsletter are just that, opinions of the authors. Information contained herein, while believed to be correct, is not guaranteed as accurate. Warning: Investing often involves high risks and you can lose a lot of money. Please do not invest with money you cannot afford to lose.
