Until 29th October 113 companies of S&P 500 have already published their financial reports for the last quarter. A big number of them – 76% - presented better than expected performance. “Exceeded expectations” sounds very positive and is already a buzzword in the world of investment but we should take a look at it in the context of American reality.
How it all works?
You had a chance to read about our criticism towards the overpriced US stocks. We presented evidence including extremely high levels of indicators such as P/E, CAPE and P/S.
The question is: why companies still boast exceedingly good financial results? Let us take a look at the past quarters and whether we can see any patterns. The chart below shows that in every single one of the last 17 quarters American companies exceeded forecast.
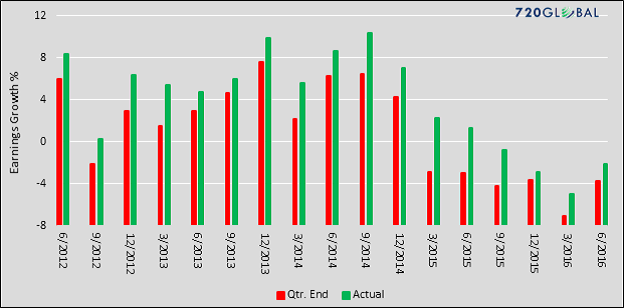
In red you see prognosis and in green actual growth according to official reports of said companies.
Every time the ‘surprise’ is on the positive side. How is that possible? All this works on a very simple mechanism which is left unchanged for some years now. I will try to explain it in a few simple steps.
STEP 1: Great future
Forecasts are done one year in advance and are designed to create a good outlook for investors. There is no place for pessimism here. Announcements of increased revenue streams by a double-digit margin sound good, especially with the real rate of inflation today and ZIRP.
STEP 2: Revised hopes
With every quarter expected gains are slowly and systematically being reduced. This is when an investor should be cautious. We should be wiser than to expect anyone from stock exchange officials or companies themselves put a spotlight on any negative news.
The pattern of changes is shown in the chart below.
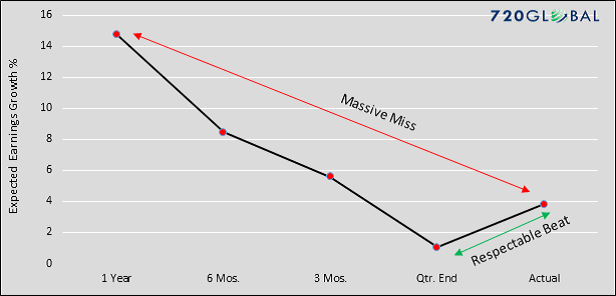
In red we see a significant difference between first forecast and the actual result. On average it is over 10 percentage points. The green line shows us the ‘exceeding expectations’ part – the difference between expected earnings and actual data.
It is pretty clear that in advance 14-15% profit is announced only to be lowered steadily with every subsequent quarter. Right before the actual earnings report being presented forecasts are, to put it mildly, very low.
STEP 3: Company presents its financial report
Finally, the firm shows actual data. It is compared with the last point of reference and this means that they ‘exceed expectations’. This enables the last step…
STEP 4: Propaganda
All previous steps allow the firm to send a very positive message to investors. It is true but does not manifest any value. Also, it is very helpful for every specialist trying to sell their financial product to build their resume and take a nice cut for themselves. At the end of the day, there is always someone who wants to listen to this never-ending novel about success.
Using the right methodology you can show that the inflation rate in the US is equal to 1.5%. Similarly, we can manipulate the earnings report of companies and create an atmosphere of success – a bull market. Both examples have little to do with reality but a lot with perception. A recent example of ‘guaranteed' Clinton’s win also falls into this category.
If someone has doubts whether this scenario applies to the majority of traded companies I ask you to pay attention now. Below we can see an anticipated difference between forecasts depending on the time left to the actual report.
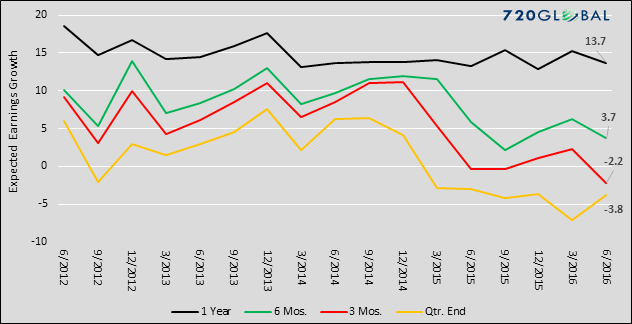
Last 17 quarters were taken into consideration and every time first forecasts were the most optimistic (black line). After half a year, they were decreasing (green line) and continued growing smaller (red and yellow line). I do not think that ‘conspiracy theory’ is the right term to describe the above.
Summary
The problem this article talks about is often seen only after the crisis. An intelligent investor has to pay attention to this aspect particularly when everyone is charmed by an everlasting boom.
Presented data is only about American stocks. This is why we have to point out that a small group of corporations is producing a huge profit dragging up hundreds of firms with only losses in their books. FANG (Facebook (NASDAQ:FB), Amazon (NASDAQ:AMZN), Netflix (NASDAQ:NFLX) and Google (NASDAQ:GOOGL)) are responsible for 90% of the current growth in the US.
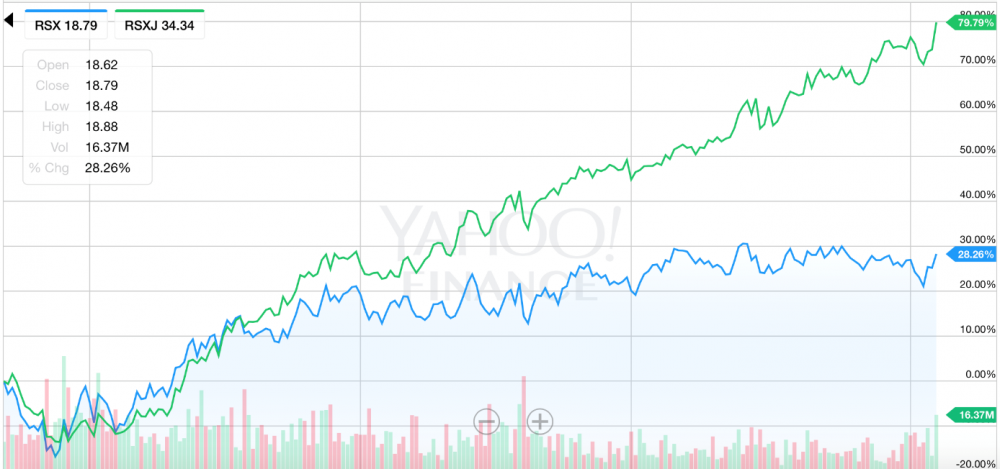
Overpricing of equities makes the possibility of a change of this bullish trend higher. American stock exchange is responsible for 42% of world capitalisation of all exchanges and affects both emerging and developed markets. This is why we remind everyone to invest in equities only in undervalued markets. Take a look at Russia where all equities are very cheap. In the case of relations between the US and Russia warming up, which is probable after Trump’s win, the EU sanctions against Russia should be at least softened if not cancelled altogether. This is why VanEck Vectors Russia (NYSE:RSX) and VanEck Vectors Russia Small-Cap (NYSE:RSXJ) should still grow even after gaining 28% and 80% respectively since the beginning of 2016.
Chile is another good pick because its economy is linked to commodities. Nigeria and Turkey are viable options too but the latter has big geopolitical risks.
To sum it up, do not rely on forecasts and projections because indicators such as P/E or CAPE have a much better track record. Finally, I want to show you a table – it explains the prospect of return depending on the starting P/E level. The timeframe is 10 years.
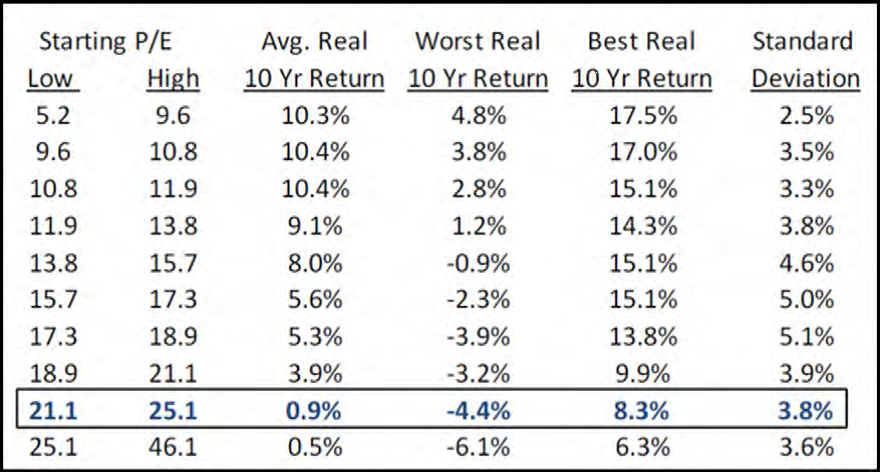
Today’s P/E for the US is equal to 21.2. Based on the data above average investor can count on a ‘return’ of 0.9% each year for 10 years. You will not see it in any forecasts.
