There’s a dangerous myth going around: that stocks are in a bubble, and if you buy now, you’ll lose money.
This myth is dangerous because it is discouraging people from putting money in one of the most powerful wealth-generating machines on earth. And income-seekers (retirees, in particular) who know how to navigate this market can not only get massive profits but also strong cash flow, like the 6% dividends, paid monthly, on a fund I’ll introduce you to shortly. This fund is worth your while because it’s a play on US stocks at a time when stocks are strong and getting stronger, and because it’ll get you those stocks at an 8.6% discount, too.
And no, you aren’t too late to get into this market now, even if people are telling you otherwise. Let me explain why.
The Bubble Myth
First, let’s look at 2019’s stock performance by examining the SPDR S&P 500 ETF Trust (NYSE:SPY), which tracks the S&P 500.
30% Gains in a Year
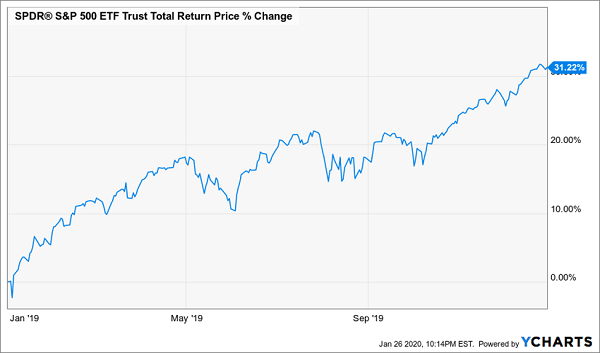
In just one year, the S&P 500 rose over 30% with dividends included. In fact, 2019 was the best year for the index since 2013, and one of the best on record. As a result, a lot of people are warning that we’re in a bubble.
They’re wrong, for one reason: recency bias. Look at 2019 on its own and it seems like stocks are overheating. But look back further and the picture changes a lot.
Two Years Were Worse Than One
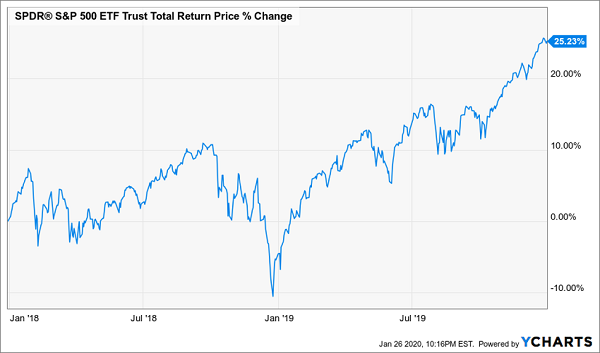
Over two years, stocks earned about a 12.5% annualized return. That’s still high, but by no means in bubble territory.
When we take a broader view of stocks, we realize that 2019’s performance was an aberration, and partly a result of luck. Since the 2018 downturn ended in late December, it just so happens that the 2019 calendar year looks unusually strong. But what if we looked from July 2018 to July 2019? Again, things seem much milder.
Slight Shift Changes the Picture
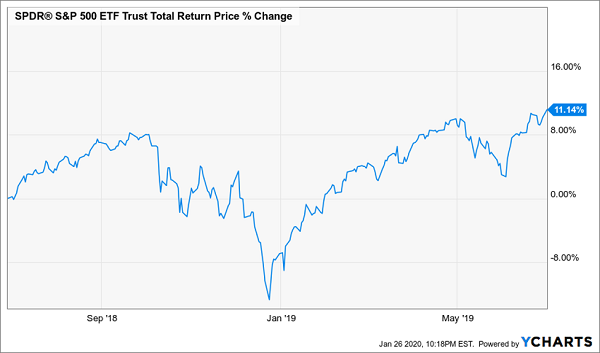
Now we see just 11% gains in a year—a very big difference! The lesson here? Always take the long-term view and don’t cherry-pick short-term time periods when attempting to understand how stocks perform over the long haul.
The Really Long View
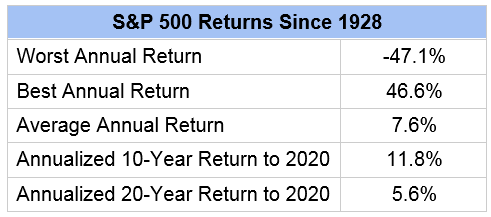
Let’s go way back to understand how US stocks are doing now and try to get to the bottom of whether we’re in a bubble. To do so, let’s review some facts.
Fact #1: The worst year for stocks since 1928 was in 1931, when stocks fell 47.1%. The global financial crisis triggered the third-worst year, in 2008, when stocks fell 38.5%.
Fact #2: The best annual return in history was 46.6% in 1933, when stocks recovered from the initial drop in the Great Depression.
Fact #3: Since 1928, even including the Great Depression, 1970s stagflation, the dot-com bubble bursting, and the global financial crisis, stocks have returned 7.6% annually, on average.
These three facts tell us something crucial: stocks tend to correct from big declines and, over the long term, investors will still make a lot of money, no matter how severe the crisis seems to be. US stocks have been through world wars, oil shortages and financial disasters and still come out ahead.
But naysayers still protest: over the last 10 years, stocks have returned 11.8% a year, on average.
Is This Market Too Hot?
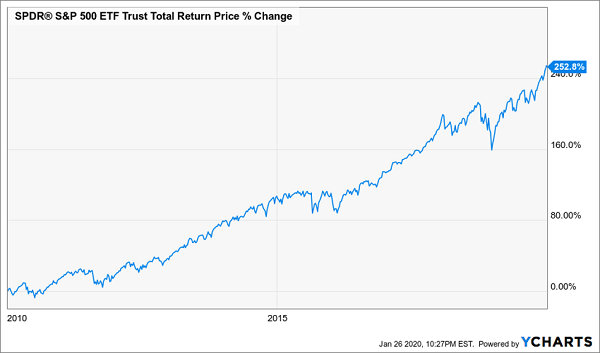
Since this is above the long-term average, the argument goes, stocks are in a bubble and should be sold immediately.
Again, this is flawed thinking, based on cherry-picked data.
Rewind 20 years and the average return for stocks is just 5.6%. Stocks were in neutral from their dot-com reversal in the 2000s until the global financial crisis, and in the last decade they’ve been recovering from this historical aberration through a gradual appreciation. That’s evidence that the 10-year time horizon is wrongheaded.
But even more compelling is this: move the goalposts just slightly and the average annual return goes down to 8.6%.
Two Years Make a Big Difference
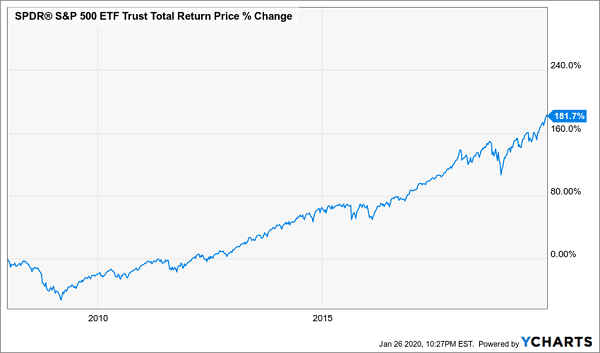
Because the global financial crisis ended exactly a decade ago, choosing a 10-year time horizon right now will give you an unusually high data point that isn’t an accurate reflection of reality. The longer-term view tells us that, over the long haul, stocks go up, and right now stocks aren’t going up much more than their normal rate of return.
Which is why now is the time to jump in.
But How?
If you’re still worried that stocks are overvalued, there is one way to get them at a big discount: closed-end funds (CEFs).
Here’s how they work: a CEF will buy a basket of assets and keep them in a portfolio. The sum of that portfolio’s value is known as the net asset value (NAV) of the fund. Since CEFs trade on an exchange, like stocks, but trade a fixed number of shares, the market price of their shares, which is based on investor demand, can go above or below the NAV of the fund.
When the fund’s market price is below its NAV, you can get the assets in that fund at a discount.
This is why a fund like the Gabelli Dividend & Income Trust (NYSE:GDV) is so interesting. GDV holds a number of large-cap US stocks like JPMorgan Chase (NYSE:JPM), Honeywell (NYSE:HON), Mastercard (MA), Verizon (NYSE:VZ) and Microsoft (NASDAQ:MSFT) while trading at an 8.4% discount. That means that you can get $10,000 worth of these stocks with just $9,160. Plus, that $9,160 will get you a 6% income stream, or $45.73 per month on your initial investment.
If you wanted to get that same income stream with SPY, you’d need to invest a whopping $32,087, or three-and-a-half times as much as you’d need to put into GDV.
And GDV isn’t the best CEF out there—not by a longshot. There are dozens of CEFs with dividends upwards of 8%, and dozens more with returns that have beaten the S&P 500 for years. So you can get into this rising stock market and get a massive income stream at the same time, while also paying less than most investors do.
5 Quick Buys for 20% Upside and 8%+ Dividends—Starting Today
If you think a 6% would make a big difference to your retirement, wait until you see the 5 CEFs I have for you right here. They pay you steady dividends of 7%, 8%, even north of 9%! Like GDV, most of them pay you every single month, too.
In all, we’re looking at an 8% average dividend from this 5-fund “mini-portfolio.” And thanks to their totally unwarranted discounts, I’m calling for 20% gains in these 5 funds’ market prices in the next 12 months, too.
It pains me to see regular folks sleepwalking right past huge dividends like these, especially when they’re sitting in plain sight! Right now, there are around 500 CEFs out there, and they yield 7%, on average.
Why haven’t you heard about them?
Because the financial media is too obsessed with flashy headlines, like the latest offering from Tesla (NASDAQ:TSLA) or Apple (NASDAQ:AAPL), to focus on “boring” CEFs. Most advisors, too, would rather simply recommend you buy an ETF—it’s a lot less research for them, and they get paid either way!
It’s a sad situation we’re going to put a stop to right now—today.
Disclosure: Brett Owens and Michael Foster are contrarian income investors who look for undervalued stocks/funds across the U.S. markets. Click here to learn how to profit from their strategies in the latest report, "7 Great Dividend Growth Stocks for a Secure Retirement."
