It always fascinates me to see changes in the S&P 500 earnings and revenue data and how it correlates to the actual index or market action.
Was 2017’s 21.8% S&P 500 index return discounting the 2018 “expected” EPS growth of 20%? For those who believe that the stock market is a discounting mechanism, looking out 9 to 12 months in advance, then the answer to that question is “yes”.
The S&P 500 fell 1% in the first quarter of 2018 and most of the bond market asset classes were negative as well.
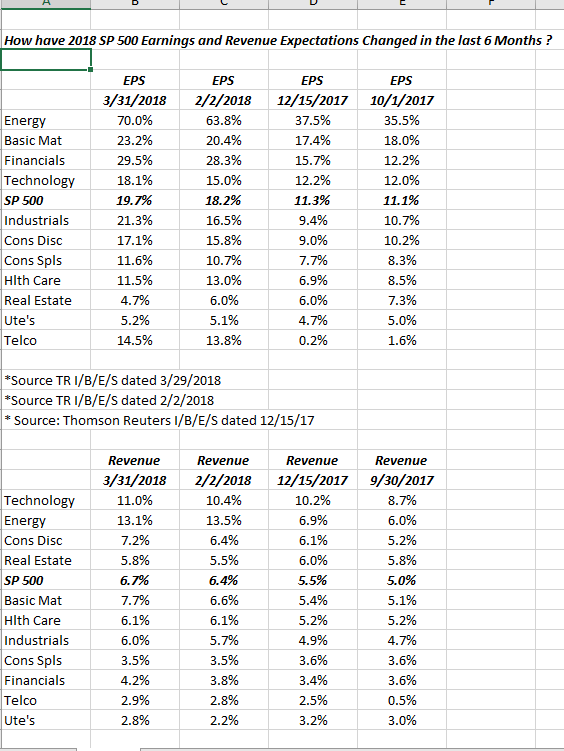
So how have 2018 EPS and revenue growth estimates changed in the last 6 months ?
Investors are seeing positive revisions mostly, certainly for EPS estimates given tax reform and the lower corporate tax rate, while revenue estimates look for “mid-single-digit” growth:

Source: Thomson Reuters I/B/E/S and Factset data
First quarter earnings could be a little stronger than expected given that share repurchases might be accelerated given the early February ’18 correction.
Compare the Excel spreadsheet with the actual sector returns YTD found below.
Thomson Reuters data (by the numbers)
- Fwd 4-qtr est: $158.14
- P.E ratio: 16.7x
- PEG ratio: 0.81x
- S&P 500 earnings yield: 5.99%
- year-over-year growth of fwd est: +20.74%
Source: This Week in Earnings dated 3/29/18
Conclusion: little has changed regarding the numbers around the S&P 500 forward estimates. Earnings growth of 20% for the S&P is HUGE (sorry for the hyperbole) but a lot of it is likely already in the market. Revenue growth is slowly accelerating but is still sluggish and aided by the weaker dollar.
The big difference this year is that the S&P 500 is more volatile, with the benchmark having its first negative quarter in 9 quarters, and the first negative first quarter, since 2009.
What’s fascinating to me is sectors like Energy: down 7% YTD in 2018 thus far but look at the trends in 2018 EPS and revenue estimates. Energy underperformed in 2017 too, despite a decent 2h ’17 rally. It is why ive always hated commodity investing. Ive been burned so many times investing in commodity stocks where the numbers look great, but the stocks go nowhere or head south and by “numbers” i mean forward estimates and valuation work.
Exxon Mobil (NYSE:XOM) could be having an undue influence on the sector too. Vitaliy Katsenelson wrote what I thought was a good perspective on Exxon in the last month here. XOM is 23% of the market cap of the Energy Select Sector SPDR (NYSE:XLE) and is still the 8th largest stock by market cap in the S&P 500. Interesting that XOM’s revenue revisions have been positive for the last few months and the stock has gone nowhere.
Here is the detail of sector Q1 ’18 returns (source Bespoke, S&P):
- Tech +4.3%
- Consumer Discretionary: +3.6%
- Financials: -1%
- S&P 500 -1.1%
- Health Care: -1.5%
- Industrials: -2.6%
- Basic Materials: –5.5%
- Utilities: -5.6%
- Energy: -7%
- Real Estate: -7.3%
- Consumer Staples: -9.8%
- Telecom: -10%
Tech and Consumer Discretionary are essentially one sector since Amazon (NASDAQ:AMZN) and Netflix (NASDAQ:NFLX) are Discretionary’s two largest sector weights at 28% of the Consumer Discretionary Select Sector SPDR (NYSE:XLY) (Consumer Discretionary ETF).
I still think Financials are the sector to be this year especially of the 2-10’s Treasury spread can widen, which it hasn’t since early February ’18.
These are merely opinions, not advice or predictions.
