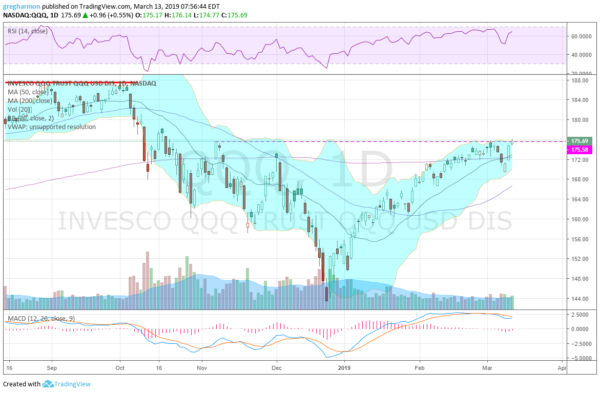
A series of higher highs and higher lows’ this is what defines a trend higher in stock prices and it is exactly what is happening in the Nasdaq 100. Since making a bottom in December, the Index has made a series of higher highs and higher lows on its run higher. A great thing to be a part of but in February the story got even more interesting.
Using the Nasdaq 100 ETF, QQQ, you can see why. As the price crossed the 200 day SMA in the middle of the month, it was also approaching its first chance to make a major new high. And before the month was over it had closed above the December 3rd high bounce. No longer just the brief uptrend from the Christmas Eve bottom.

It did not hold up for long, pulling back to another higher low last week. The reversal from there reached another plateau Tuesday. It closed above the November 7th high, a second major higher high. The next milestone for the Index is the October 17th high and then the new all-time highs.
As always there is no guarantee that it will get there, but the Index has momentum on its side. The RSI is bullish and rising while the MACD is positive and turning back higher.
The information in this blog post represents my own opinions and does not contain a recommendation for any particular security or investment. I or my affiliates may hold positions or other interests in securities mentioned in the Blog, please see my Disclaimer page for my full disclaimer.
