The S&P 500 had a phenomenal 2017 and then an even better start to 2018 rising over over 7% at one point in January. The first half of February has been a different story. That 3, 5 or 10% correction that has been anticipated by the perma-bear community since the last rally began in February 2016 finally appeared. A 10% pullback, a spike in volatility and we all started to read a lot of “I told you it was coming” stories.
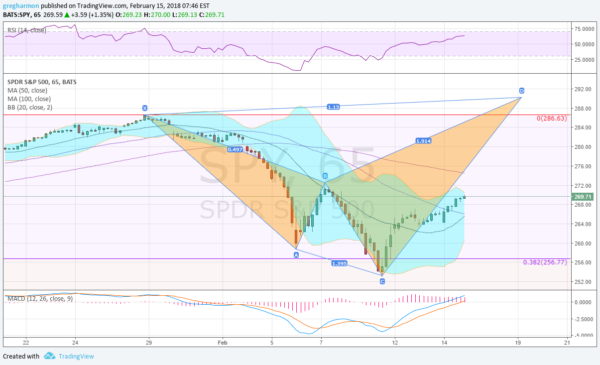
This week the S&P 500 has shown some strength though, not the follow through to the downside. But in some aspects that strength is still lacking. The chart below of the last month of price action in the SPDR S&P 500 (NYSE:SPY) can explain the good and bad. This chart is using 65 minute candlesticks to equally break up the trading day and show a bit more granularity.
First note the possible double bottom on February 9th had retraced just over 38.2% of the move higher since the Trump election bottom. A reversal with strength here would be a good indication of a strong longer term trend. Next, the harmonic Shark pattern that may be forming would give one target to over 290, a new all-time high. Momentum has also been positive and rising. Finally the price action moving higher is a plus.
But what this move is lacking so far is a higher high. The definition of a trend is a series of higher highs and higher lows. And this move has yet to produce one. The pre-market action Thursday suggest it may come today. And it if does it will carry significance. It will confirm that Shark harmonic, it will confirm a nascent uptrend, providing the building blocks for a more significant move higher. Right now it is time to pay closer attention to the short term picture.
The information in this blog post represents my own opinions and does not contain a recommendation for any particular security or investment. I or my affiliates may hold positions or other interests in securities mentioned in the Blog, please see my Disclaimer page for my full disclaimer.

