🐂 Not all bull runs are created equal. November’s AI picks include 5 stocks up +20% eachUnlock Stocks

Here's Why Another Volatility Spike May Be On The Way

Published 11/20/2018, 12:17 AM
Updated 07/09/2023, 06:31 AM
US500
-
US2YT=X
-
US10YT=X
-
VIX
-

In early October, when the U.S. stock market had reached an all-time high and investor sentiment was extremely complacent, I published a warning in Forbes called “Why Another Market Volatility Surge Is Likely Ahead.” I showed three indicators that I believed pointed to an imminent volatility spike, most likely as a result of a bearish market movement.

Sure enough, that volatility spike came just a couple of days later as the U.S. stock market corrected very sharply. Since peaking in early-October, market volatility (as measured by the VIX Volatility Index) has calmed down a bit as U.S. stock indices staged a bounce. Unfortunately, I am concerned that this most recent period of relative calm may result in yet another volatility spike, provided there is proper technical confirmation.

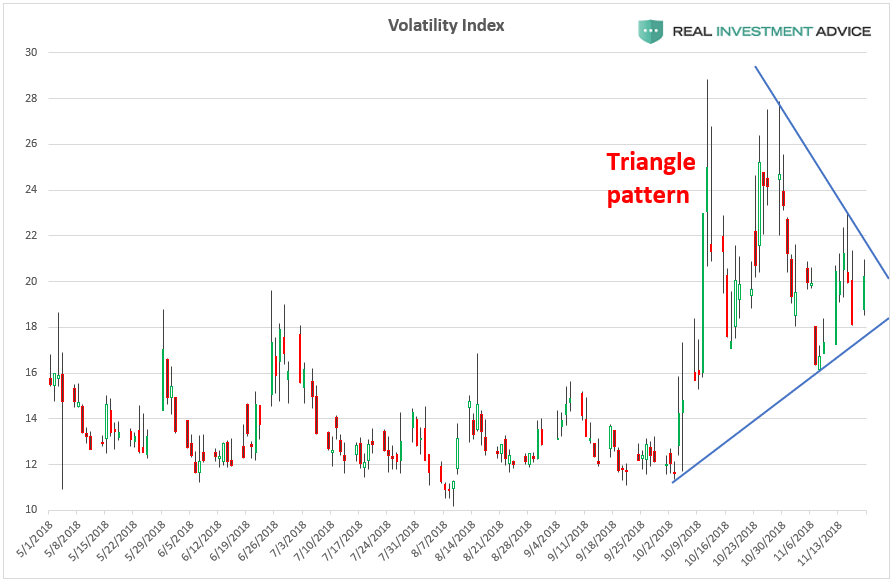
The chart below shows the VIX Volatility Index, which appears to be forming a triangle pattern that may indicate that another big move is ahead. If the VIX breaks out of this pattern in a convincing manner, it would likely lead to even higher volatility and fear (which would correspond with another leg down in the stock market). On the other hand, if the VIX breaks down from this pattern, it could be the sign of a more extended market bounce or Santa Claus rally ahead.

VIX YTD 2018

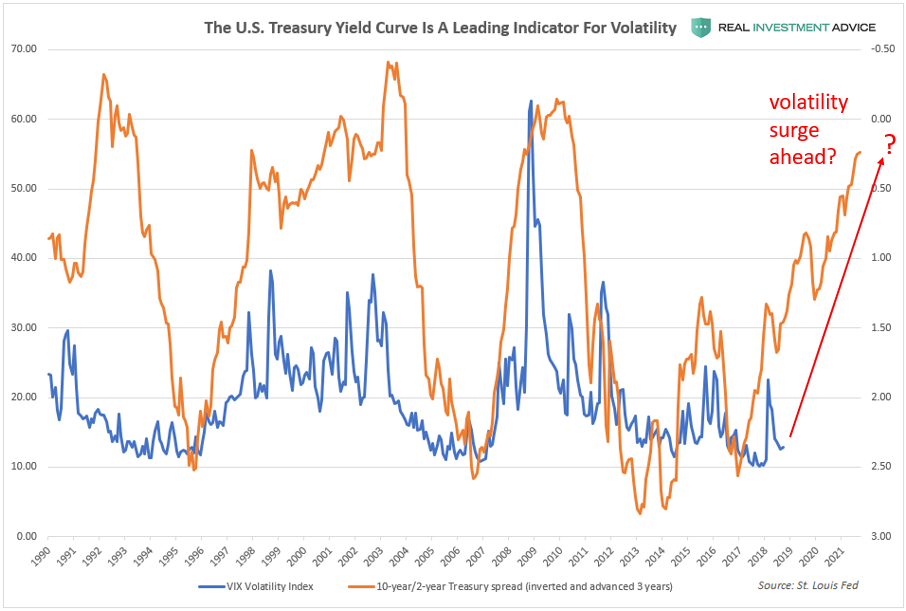
In my early-October volatility warning, one of the charts I showed was the inverted 10-year/2-year Treasury spread and how it leads the VIX by approximately three years. According to this logic, the January and October volatility spikes were only the beginning of a much larger bullish volatility cycle (ie., one that accompanies a full-blown bear market).

UST Yield Curve 1990-2018

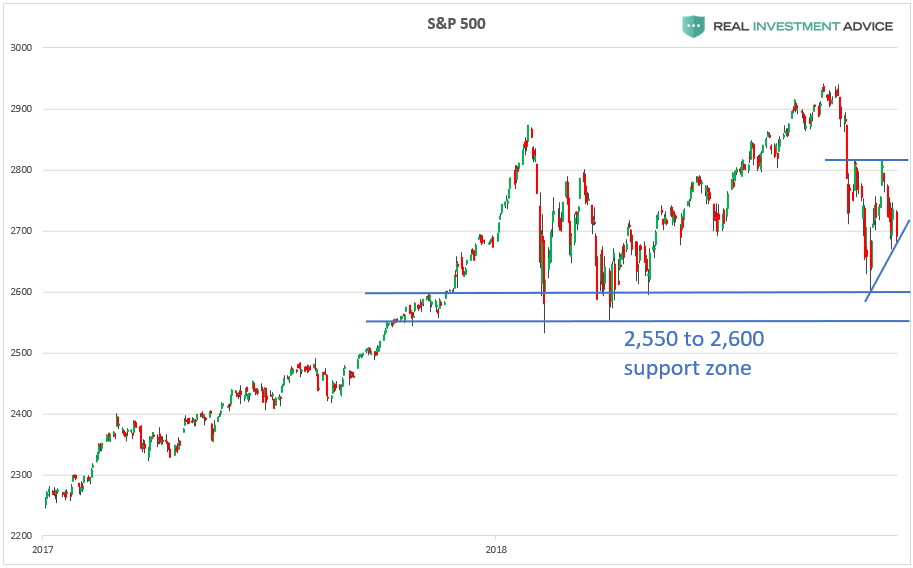
If the VIX breaks to the upside, it would coincide with the S&P 500 testing its 2,550 to 2,600 support zone that formed at the early-2018 lows. As I’ve said in the past, if the S&P 500 breaks that support zone in a convincing manner, an even more extensive bearish move is likely to occur.

SPX 2017-2018

For now, I am watching which way the S&P 500 and VIX break out for confirmation.

Latest comments

Loading next article…
Risk Disclosure: Trading in financial instruments and/or cryptocurrencies involves high risks including the risk of losing some, or all, of your investment amount, and may not be suitable for all investors. Prices of cryptocurrencies are extremely volatile and may be affected by external factors such as financial, regulatory or political events. Trading on margin increases the financial risks.
Before deciding to trade in financial instrument or cryptocurrencies you should be fully informed of the risks and costs associated with trading the financial markets, carefully consider your investment objectives, level of experience, and risk appetite, and seek professional advice where needed.
Fusion Media would like to remind you that the data contained in this website is not necessarily real-time nor accurate. The data and prices on the website are not necessarily provided by any market or exchange, but may be provided by market makers, and so prices may not be accurate and may differ from the actual price at any given market, meaning prices are indicative and not appropriate for trading purposes. Fusion Media and any provider of the data contained in this website will not accept liability for any loss or damage as a result of your trading, or your reliance on the information contained within this website.
It is prohibited to use, store, reproduce, display, modify, transmit or distribute the data contained in this website without the explicit prior written permission of Fusion Media and/or the data provider. All intellectual property rights are reserved by the providers and/or the exchange providing the data contained in this website.
Fusion Media may be compensated by the advertisers that appear on the website, based on your interaction with the advertisements or advertisers.
© 2007-2024 - Fusion Media Limited. All Rights Reserved.