Summary
- True passive investing cannot result from an index fund whose components are changed regularly.
- The committees that decide what stocks constitute their index change their minds actively and regularly.
- This is not buy-and-hold investing. It is buy and let someone else determine what you will continue to own.
- That’s OK as long as you know what you are getting into.
From dictionary.com / thesaurus.com:
"Illusion is an impression that, though false, is entertained provisionally on the recommendation of the senses or the imagination, but awaits full acceptance and may not influence action.
… delusion is a belief that, though false, has been surrendered to and accepted by the whole mind as a truth."
I've been in this business through more market cycles than I care to remember. And I can tell you from experience that every time a bull market has been in evidence for a number of years, index investing is always touted by the big mutual fund and ETF companies (usually one and the same) that offer such products as well as most new-to-the-business financial journalists.
Their reasoning seems convincing at first: "Why try to beat the market?" "Only 20% of all active mutual funds or investment advisors beat the market." (Or 25% or 30% or whatever the most recent scholarly tome reports.) "Active funds charge higher fees than passive index funds." Etc.
The presumption underlying these statements is that it is best to sit quietly in the back seat of the car and let the adults of the investing world do your driving for you. I see three problems with this approach.
Problem #1: Index funds are managed by a committee in order to be "reflective" of the current economy and the sectors that drive it. Stocks that don't perform are often dumped and newer companies with greater momentum are added by the indexes' holdings committees. As long as companies perform, they stay in. If they don't, they are sold. Examples below.
Problem #2: In a bull market, passive investors in the most popular index funds are actually chasing momentum. With every passing day in the life of the bull, a capitalization-weighted index like the S&P 500 inevitably places more emphasis on the most popular companies. As more buyers buy those most popular and raise the price of the component companies, the index fund is increasingly composed of high P/E, high Price/Book and high Price/Sales firms. We can call it passive but it is neither value-driven nor conservative at this point.
Problem #3: The biggest problem I see with passive index investing is that it's sole goal is to equal the market. That may be laudable in a rising market but unless you want to ride the roller coaster right back down again in a bear market, you need to make the active decision about when to get out. Is this decline a head fake? Is this one the real thing? Should I hold until it hits 20% down or take my cash out today? Or just hold and watch the gains evaporate?
The first goal of successful investing should not be "to beat the market" but rather to make steady progress in reaching your goals. From October 2007 to March 2009, when the market declined 50% you "beat the market" if you were down only 48%. This is a goal??? Who could possibly be happy losing less than the 50% decline index funds endured...but still losing nearly half your invested net worth?
Yet investors are told by the "experts" to just hang in there because the market always comes back and no one can time it. "If you miss the 5 best days blah blah blah…" It's true, it always does come back—just maybe not in your lifetime!
That's the problem with the academic studies the experts tout to get you to stay fully invested all the time, they typically cover a 20 to 40 year period in order to encompass one or more market cycles of bull and bear. Academic rigor demands that viewpoint—but what if you can't wait 20 years? What if you will need to begin withdrawing funds in 10 years? Or five?
At least, if you are going stay passively invested as it goes up, then down, hoping you don't need the money until it goes back up again (and it will go back up… someday), at least know what is happening while you are holding. Here's what is really going on with your passive index fund:
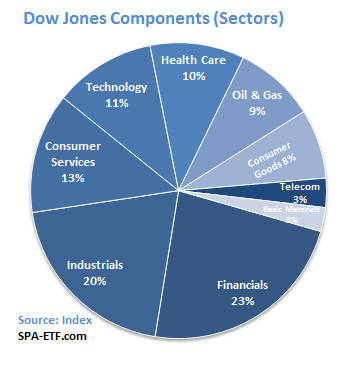
Price-weighted indexes like the DJI—the Dow Jones Industrials—are unscientific, but certainly well-followed! The DJI is "unscientific" in that the selection of issues that compose it is completely arbitrary. As a result, every time the market begins to falter, it's amazing how new "market leaders" tend to get inserted for older, tired companies which were once the hottest things in the index. Additionally, since it is price-weighted, a move by those stocks within the index that have low market capitalization—but a high stock price—can have an effect on the "Dow" that's out of proportion to their true weighting.
If a high-priced stock roars ahead, it adds a huge amount to the DJI increase for the day. If a low-priced stock roars ahead, however, no matter how massive its market capitalization, it's a ho-hummer for the Dow that day.
But the DJI has been around for well over 100 years and we like to see the squiggles, so squiggle on. Just be aware that if you hear that the General Electric (NYSE:GE) shares in your 401k were up 5%, you need to check to see what IBM (NYSE:IBM), Goldman (NYSE:GS) and Boeing (NYSE:BA) (the three currently highest-priced stocks) did that day before celebrating the "gain" in your index fund, which could as easily be down for the day.
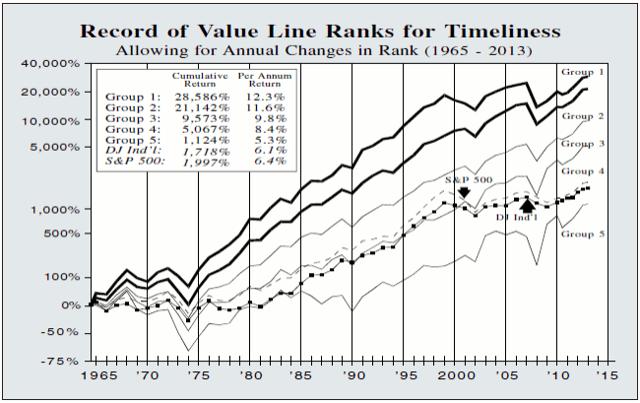
Equal-weighted indexes, like Value Line's, are unweighted geometric indexes. Value Line's index began on June 30, 1961 and includes the approximately 1700 companies followed by the Value Line Investment Survey.
Be aware that, because the index is equal-weighted, if a $10 stock goes from $10 to $12, it has the same effect on the index as if a $100 stock had gone from $100 to $120, meaning that when a $100 stock goes to $102, it's a non-event as far as the index is concerned, but when a $10 stock goes to $12, it's a big deal. You'd certainly feel the same if it were your own portfolio, so this makes a certain sense, as opposed to the way the Dow is computed.
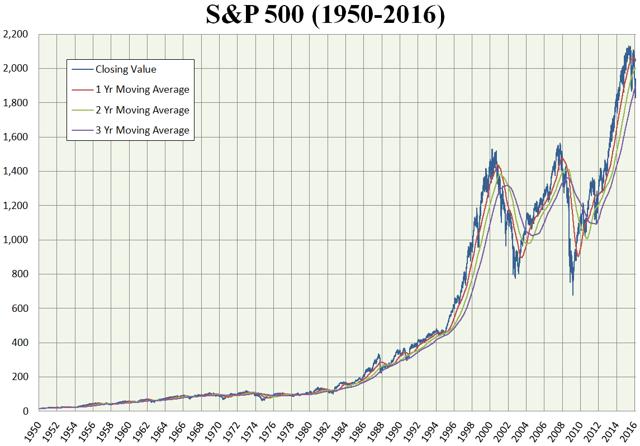
The most popular indexes for passive investing, Capitalization-weighted indexes like the S&P 500, take into account not just price, but price multiplied by the number of shares outstanding. The S&P is an index composed of the 500 largest corporations in the U.S. by market capitalization. It was begun (in its present style) in 1923, but the base period used now is 1941-1943, averaging the index at that time to a base of 10. When the S&P was at 1400 in 2000, that tells you that the value of the 500 biggest companies in America had increased 140 times in value in the 57 years from 1943 to 2000.
Using the same base, the S&P 500's close this past Friday at 2351 shows that the 500 stocks (but not the same 500 stocks used in earlier iterations—more on that below) had now risen 235 times in 74 years, a fine showing, albeit a bit below par in the more recent years from 2000 to 2017.
Since this index is cap-weighted, more than half the value of the S&P 500 come from its 50 biggest companies. So, if you bought $100,000 worth of an S&P 500 index mutual fund in, say, 1998, nearly $3000 would have gone to buy shares in GE, the largest stock in terms of market capitalization, while just $10 would have been placed in Shoney's restaurants, which was then #500 on the list.
If you had placed $100,000 with a passive S&P 500 index fund on Friday, February 17, 2017, $3572 of it would have been invested in Apple (NASDAQ:NASDAQ:AAPL) as the biggest in market cap and $73 would have gone to News Corp (NASDAQ:NWSA) (NASDAQ:NWS), #500 on the current S&P 500.
In fact, just under $20,000 of your $100,000 would be invested in the 11 stocks below:
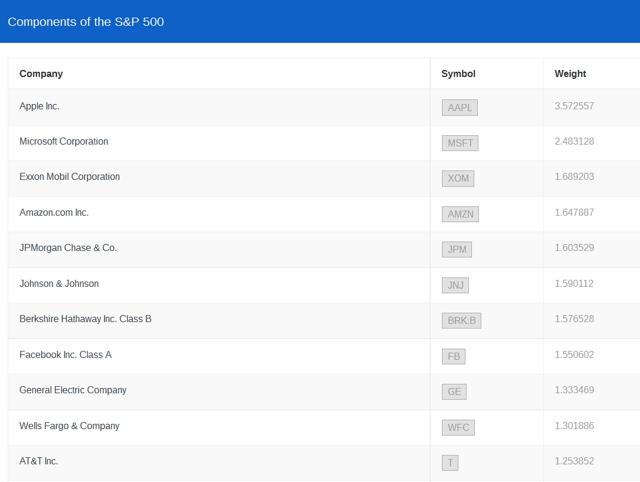
There are some great names here, all of which I believe in the "long run" will amply reward investors. But as someone with a fiduciary duty to my clients, I have to think about the "what-ifs" every day. And, frankly, if there is a correction anytime soon I don't want to own Facebook (NASDAQ:FB), Apple, Amazon (NASDAQ:AMZN) and others that have already had such a strong run this past couple of years.
Indexing "the market" when the index is capitalization-weighted means putting most of your money in a relative handful of stocks.
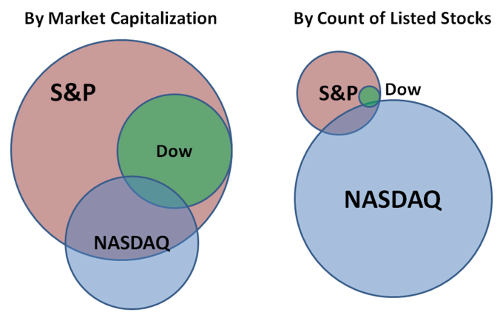
Even though most investors' money flows into the DJI and S&P index funds ($8 trillion at last count for the S&P) there are a couple of other index funds I should touch on for those readers that prefer them.
The NYSE Index is a capitalization-weighted index that includes all common stocks listed on the NYSE. This effectively creates a benchmark of the market value (price per share times total shares) of the NYSE. The NYSE Index was started the last day of 1965 with an arbitrary "value" of 50. So, at 500, the NYSE Index would have gone up 10 times since December 31, 1965. This is a fairly broad representation of American industry, with the various issues in the Index comprising nearly 2/3 of the value of all public companies.
The Wilshire Index is a capitalization-weighted index of the 5000 biggest companies in the US. These 5000 companies represent more than 95% of the market value of all 40,000 companies trading in America today. They are at the core of any investing strategy. If you can't find fine companies from within this universe, you just aren't looking.
Both of these latter indexes are probably a better gauge of "the market" than the DJI or other narrower gauges of value but they are used mostly by institutional rather than retail clients, who grew up with "the Dow" and the S&P and stick with them as benchmarks of value.
When we talk about market capitalization, by the way—the value of a single share of a company's stock times the total number of shares outstanding—delineating what "cap" a company's stock represents is both a moving target and subject to opinion. Different indexes use different cut-off points, but as a rough frame of reference small-cap stocks are usually thought of as those with a market cap of $300 million to as much as $2 billion.
Mid-cap stocks are most often considered those with a market cap of $2 billion to $10 billion. Anything above that is considered large-cap although, these days, with company's valuations so high, Morningstar and many others have added "giant-cap" or "mega-cap" to their analysis. These are typically companies with a market cap of $100 billion or more. Market cap, like beauty, is often in the eye of the beholder...or the index committees.
When reviewing any index, remember that all indexes change over time as the U.S. changes. We often think the powerhouses of our generation are invincible—but in a nation where individual initiative flourishes and people invent whole new industries in less than a decade, progress comes fast and from unexpected directions. Think Amazon or Microsoft (NASDAQ:MSFT) are invincible? Or Facebook, Apple or Intel (NASDAQ:INTC)?
Even one of my favorite industries for the next 10-20 years, oil and gas, will one day be supplanted by advances in alternative energy sources, and particularly in photovoltaics. (Don't despair for those poor displaced Middle Eastern despots just yet. If there's one thing they have more of than oil over there, it's broiling sunshine.)
Of the 100 biggest companies in the U.S. 100 years ago, in 1917, only 15 survive as members of the top 100 today. The others were either absorbed by other companies, went bankrupt or, in many cases, are still thriving, though not as members of the S&P 500.
I combed through the most recent changes to the S&P 500 index over the last 16 months. Below are the results.
I've listed them alphabetically with those companies represented in red having been deleted from the index and those in green having been added:
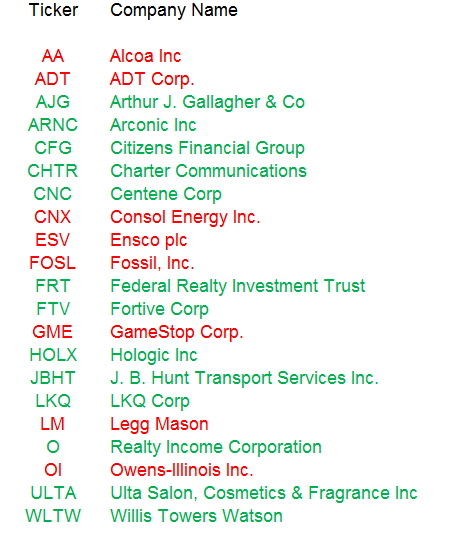
You'll note there are more additions than deletions. That's because I didn't include companies that were acquired by another firm. Again, all these changes occurred over just the past 16 months. And no matter what rolling period you select, you will find similar active investment decision-making on this allegedly passive index!
Case Study: How We Do It
All that said, here's how we've recently handled changes to the S&P 500:
I and some clients have long owned Alcoa (NYSE:AA). When they spun off Arconic (NYSE:ARNC), the higher-growth part of the company at the end of October, I not only traded all our Alcoa holdings but added a boatload more of Arconic the week of the spinoff and as it dipped during the following couple weeks. Since it is now up just over 50% I no longer recommend it for purchase and have, in fact, placed a tight 5% trailing stop on it.
Please understand I am not trying to discourage anyone from purchasing a passive index fund - I just think you should know what you are getting into before you do.
In fact, while I am very much an active investor and manager, I use certain asset classes as passive investments. For instance, as a counterweight to some of our more aggressive stocks, I own smart beta funds and what I call "un-fixed income," funds that give us a capital gain kicker as well as income.
The least of these, so far, is a boring merger and arbitrage mutual fund (Vivaldi Merger Arbitrage - VARAX). It has done nothing, zilch, bupkus for months. But I know that even in a market decline, companies still carry through on their acquisitions, and in a severe market decline companies that have borrowed at 2% and are flush with cash will be seeking more acquisitions, not fewer. This will keep VARAX rock steady while other funds are declining or plummeting.
Another category of quasi-passive is our portfolio of preferred shares such as NextEra Energy 5% (NYSE:NEE_pr J). As long as they have a combination of low price and a great dividend when we buy them, I often find they may well be called for early redemption. If we buy a $25 preferred for $22, we are getting increased yield and the possibility of a capital gain. Many of ours have already been called. The ones still in our various portfolios we consider "passive" even though they were actively selected based upon price and quality.
We also own some floating rate mutual funds and ETFs, like Federated Floating Rate (MUTF:FFRSX) and T Rowe Price Floating Rate (MUTF:PRFRX). President Trump may have built a business empire on debt and may prefer low rates, but low rates are not kind to "savers" as opposed to risk-takers. The Fed has made it clear that the runway lights are on for a raise and I imagine it won't be the last this year. These, too, we consider passive investments. Set 'em and forget 'em until rates are well above their current levels.
However, when it comes to what is still our greatest market exposure—the long REITs and US and foreign stock portions of our portfolios—I decide which companies deserve our investment dollars, not some committee whose charter insists they stay "reflective" of the markets. (FYI, I've personally made more money over the years buying those firms that are unpopular for whatever reason than chasing those that already constitute the biggest part of the S&P 500.)
Of our long portfolio selections, some are components of an index, some are not. I try to buy the shares of companies I believe have the best combination of balance sheet, management, and value as represented by share price and the valuation ratios we use. For instance Cerner (NASDAQ:NASDAQ:CERN) is in the S&P 500 index, Franco-Nevada (NYSE:FNV) is not. Yet I view both as equally attractive, with the long-term edge going to non-index component FNV.
Disclaimer: I encourage you to do your own due diligence on issues I discuss to see if they might be of value in your own investing. Past performance is no guarantee of future results. Even our 18-year track record of success does not guarantee continued success. Good luck or other factors could have played a role. You are welcome to contact me at joe@stanfordwealth.com with any questions or to see our current model portfolio.
