Check out this week’s Danger Zone interview with Chuck Jaffe of Money Life.
As outlined in our Sector Ratings for ETFs and Mutual Funds report, Health Care’s 3Q17 sector ranking fell two spots to eighth out of ten sectors. The sector’s risk-reward rating was downgraded to Unattractive, which is based on an aggregation of ratings across 106 Health Care sector ETFs and mutual funds under coverage. The Healthcare sector ranked sixth and received a Neutral rating last quarter and one year ago.
While our sector ratings are based on ETFs and mutual funds, the 86 Health Care mutual funds are responsible for the sector’s Unattractive rating. 70% of Health Care mutual funds receive an Unattractive-or-worse rating, while only 4% receive an Attractive-or-better rating and meet our liquidity requirements. The passive ETF benchmark (XLV) is an attractive option versus this crowded field that is unlikely to justify its “active” fees.
In light of the factors above, Health Care sector mutual funds are in the Danger Zone this week. We strongly recommend investors avoid the five worst-rated mutual funds from our Heath Care Sector Best and Worst: 3Q17 report, especially the $2.3 billion AUM Prudential Jennison Health Sciences Fund, which ranks last.
Holdings Analysis Reveals High-Risk Capital Allocation
The only justification for a mutual fund to charge higher fees than its passive ETF benchmark is “active” management that leads to outperformance. A fund is most likely to outperform if it has higher quality holdings than its benchmark.
Figure 1 displays allocations of risk-reward ratings for the holdings of the Prudential (LON:PRU) Jennison Health Sciences Fund (PHLAX-Very Unattractive) and the Health Care Select Sector SPDR Fund (NYSE:XLV) (Attractive), the sector’s passively managed ETF benchmark. The deviation in holdings quality between PHLAX and the benchmark is significant but not unique among Health Care sector mutual funds (see Figure 3).
Figure 1: Worst-Rated Health Care Sector Mutual Fund (PHLAX) vs. Passive ETF Benchmark (XLV)

Sources: New Constructs, LLC and company filings
PHLAX allocates only 2% of its value to Attractive-or-better-rated stocks while XLV allocates 27%. Further, PHLAX allocates 50% of its value to Unattractive-or-worse-rated stocks while XLV allocates 24%. PHLAX also allocates 25% of its value to unrated holdings, many of which are early-stage or speculative companies that lack profits or even meaningful revenue.
PHLAX’s top-10 holdings comprise 41% of the fund and contain no Attractive-or-better rated stocks, six Unattractive-rated stocks and four Neutral-rated stocks. The funds only Attractive-rated holding is a 2% position in Bristol Myers (BMY).
Given the unfavorable distribution of Attractive vs. Unattractive allocations relative to the benchmark, PHLAX appears poorly positioned to capture upside potential while minimizing downside risk. This skewed risk-reward profile lowers the chance of generating the outperformance required to justify PHLAX’s high fees.
PHLAX Allocates Capital to Overvalued, Speculative Stocks
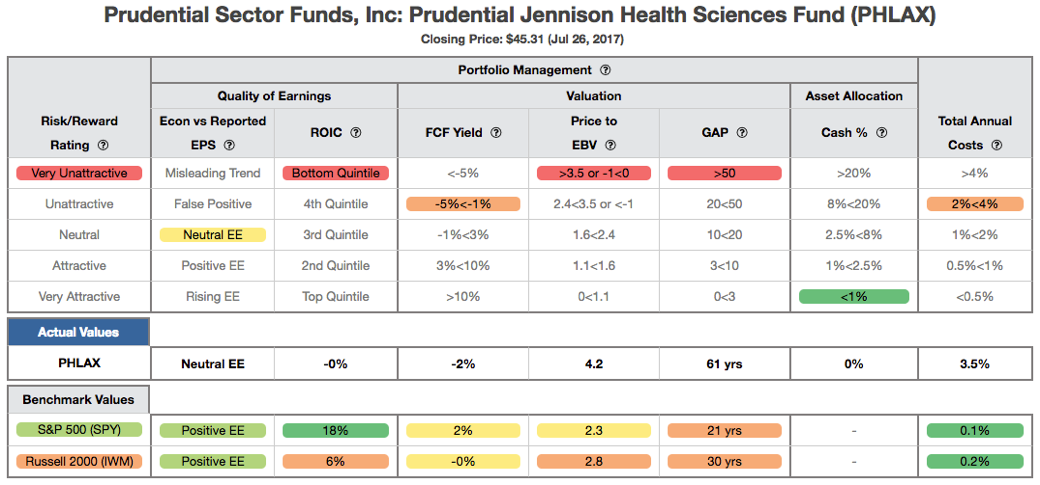
Figure 2 displays the details behind our rating for PHLAX. Our fund rating methodology is very similar to our Stock Rating Methodology, because the performance of a fund’s holdings equals the performance of a fund. To earn an Attractive-or-better rating, a fund must have high quality holdings and low costs. PHLAX falls short on both counts. The fund’s managers have selected overvalued stocks with no meaningful profits and negative free cash flow (FCF), while charging above average fees to do so.
Figure 2: Prudential Jennison Health Sciences Fund (PHLAX) Rating Breakdown

Sources: New Constructs, LLC and company filings
Return on invested capital (ROIC) for PHLAX’s holdings is 0%, far below the healthy levels earned by S&P 500 (18%) and XLV holdings (13%). Given the lack of profits, PHLAX’s companies are burning through cash. PHLAX’s holdings have a -2% FCF yield compared to +2% for S&P 500 and XLV holdings.
The price to economic book value (PEBV) ratio for PHLAX holdings is 4.2 compared to 2.3 for the S&P 500 and 2.2 for the XLV. This ratio means the market expects the after-tax profits of PHLAX holdings to increase 420% vs. 230% and 220%, respectively, for S&P 500 and XLV holdings.
Lastly, our discounted cash flow analysis of fund holdings reveals a market implied growth appreciation period (GAP) of 61 years for TSNAX compared to 21 years for the S&P 500 and 22 years for XLV. In other words, companies held by PHLAX have to grow economic earnings for nearly three decades longer than those in the S&P 500 or XLV to justify their current stock prices.
The combination of challenging fundamentals and high profit growth expectations implies a speculative level of investment risk. Excess risk taking makes long-term outperformance vs. the benchmark less likely.
PHLAX is More Rule than Exception Among Health Care Funds
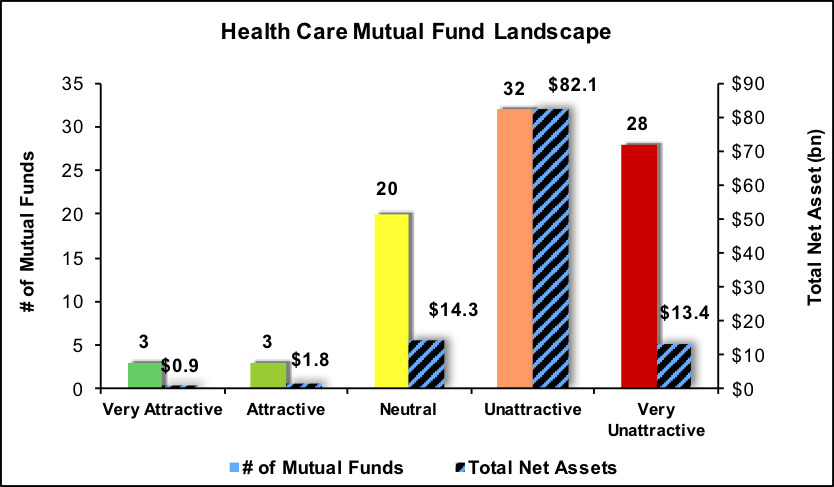
The adverse deviation in PHLAX’s holdings quality from the benchmark is more the rule than the exception for Health Care sector mutual funds. Per Figure 3, 85% of assets in Health Care sector mutual funds are in funds that receive an Unattractive-or-worse rating. Furthermore, all 22 Health Care sector ETFs, even those with Very Unattractive ratings, rank better than the five worst-rated Health Care sector mutual funds.
Figure 3: Health Care Mutual Fund Landscape – Separating the Best from the Worst

Sources: New Constructs, LLC and company filings
High Fees Could Impede Outperformance
At a lofty 3.5%, PHLAX’s total annual costs (TAC) are higher than 81% of all sector mutual funds under coverage and 86% of all Health Care sector mutual funds under coverage. Figure 4 displays how much the fund’s TAC exceeds the stated expense ratio for the three open share classes of the fund (PHLAX, PHLBX and PHLCX), all of which earn a Very Unattractive rating. For comparison, the average TAC of all sector mutual funds under coverage is 2.09%, the weighted average is 1.31% and the benchmark (XLV) has a TAC of 0.15%.
Figure 4: Prudential Jennison Health Sciences Fund (PHLAX) Cost Overview

Sources: New Constructs, LLC and company filings
To justify its higher fees, the Prudential Jennison Health Sciences Fund must outperform its benchmark (XLV) by the following over three years:
- PHLAX must outperform by an average of 3.3% annually.
- PHLBX must outperform by an average of 2.8% annually.
- PHLCX must outperform by an average of 2.0% annually.
Favorable Long Term Track Record Proving Difficult to Replicate
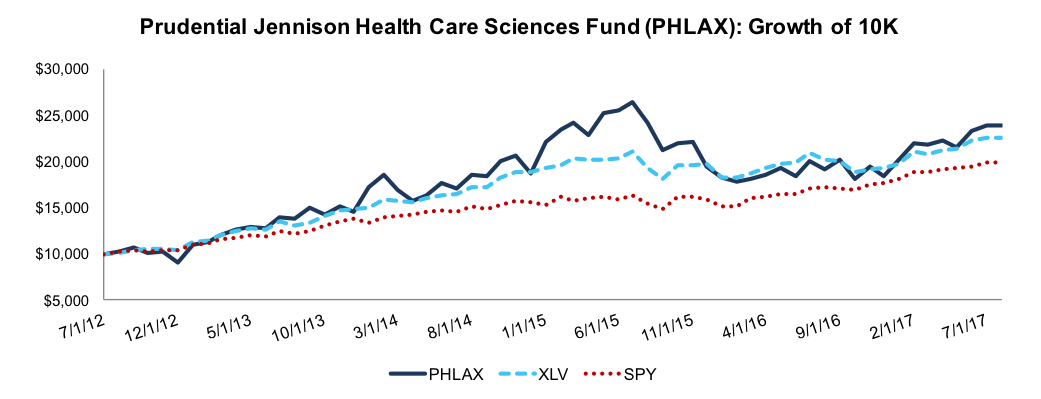
PHLAX’s long-term track record is impressive. Over the past ten years, PHLAX has generated a 15% annualized total return compared to 11% for the XLV and 8% for the S&P 500 (represented by SPY (NYSE:SPY)). However, most of the fund’s long-term outperformance was generated in the earlier half of the past decade, and the fund’s relative performance over the past five-year and three-year periods has been far more pedestrian.
Per Figure 5, PHLAX has only narrowly outperformed its benchmark over the past five years, returning 19% annually compared to 18% for the XLV and 15% for the SPY. Over the past three years, PHLAX’s outperformance gap disappears completely. The fund has returned 9% annually, which matches the performance of the XLV and SPY, despite meaningful outperformance by PHLAX over the past twelve months.
In PHALX, we see a fund that is charging high fees based on past performance that the managers are having an increasingly difficult time replicating. When taking into account the speculative nature of the fund’s holdings, it appears that the fund’s managers are taking on higher risk in search of higher returns. As such, we currently prefer the benchmark XLV and think investors should approach this fund with caution.
Figure 5: Prudential Jennison Health Sciences Fund vs. XLV & SPY

Sources: New Constructs, LLC and company filings
Importance of Holdings-Based Fund Analysis
Diligence is required to make informed decisions when choosing between the wide array of ETFs and mutual funds. Truly “passive” investors selecting funds solely on sector, style or expense ratio are exposing themselves to unnecessary risks. We think advisors and investors focused on prudent investment decisions should include analysis of fund holdings in their research process for ETFs and mutual funds.
Disclosure: David Trainer, Kenneth James, and Kyle Guske II receive no compensation to write about any specific stock, sector, style, or theme.
