Another wild, down-up session overnight in the US certainly is keeping things interesting for the indices day traders on our book!
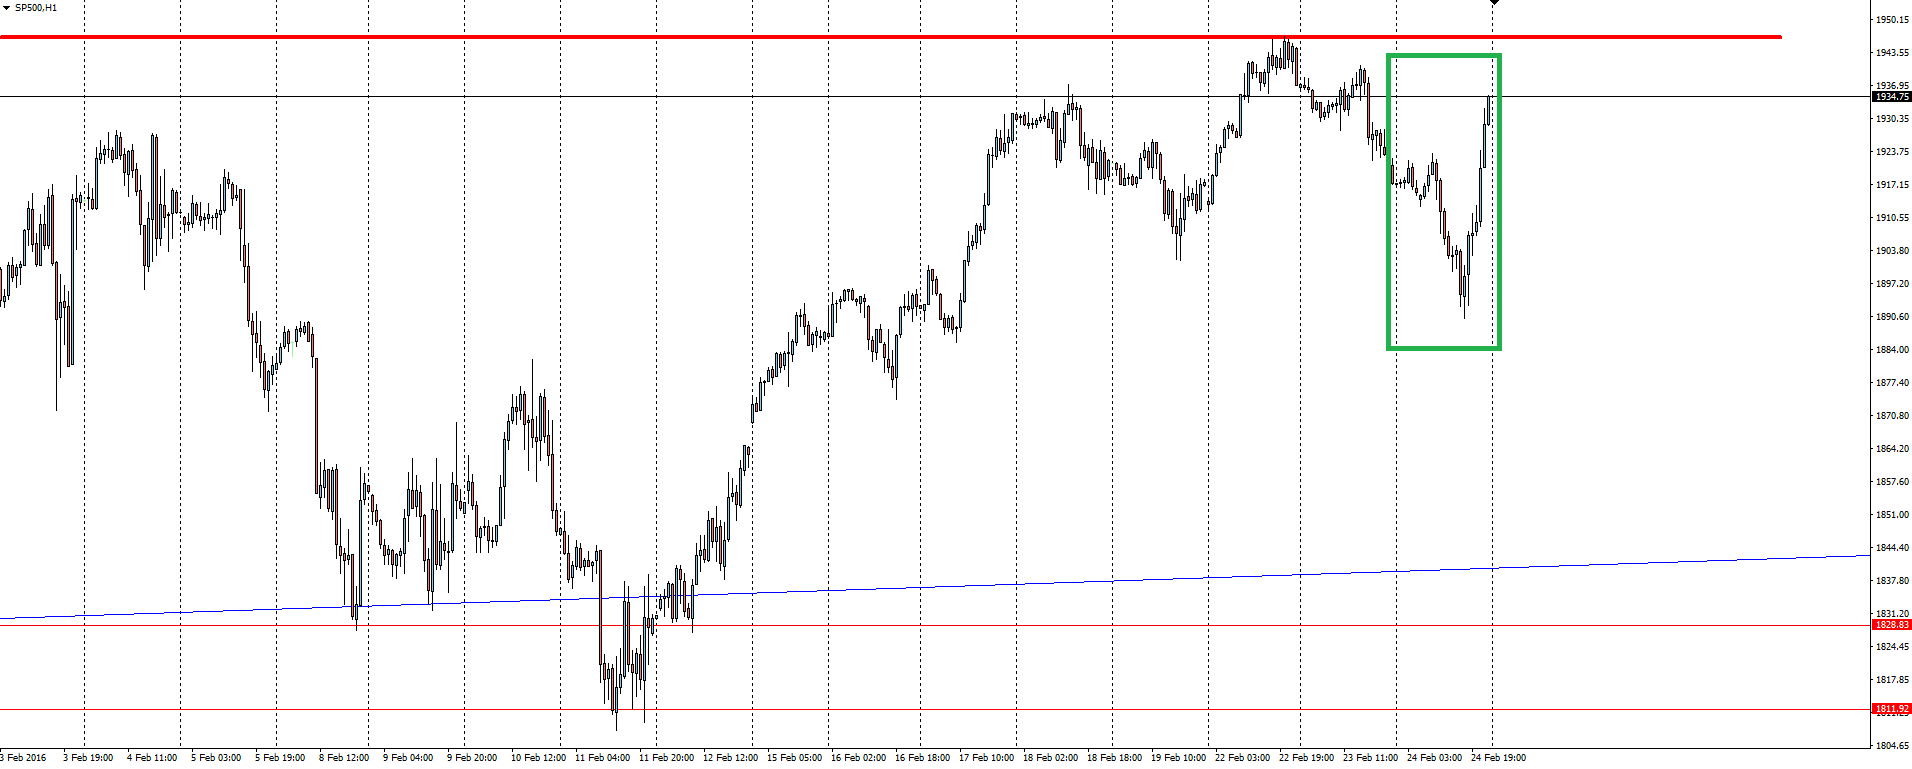
S&P 500 Hourly:
With the day’s trading highlighted on the above hourly chart, you can see the uncertainty around markets reflected in the price swings that we’re seeing right now in stocks.
But as for having some sort of link to market confidence as some of the headlines may have you believe, that is just rubbish.
With no technical damage done to either the S&P 500 or oil charts, just make sure you’re not getting caught out by sensationalised headlines.
Some headlines move markets but ‘breaking news’ that stocks rallied to end a single session into short term resistance isn’t one of them!
Chart of the Day:
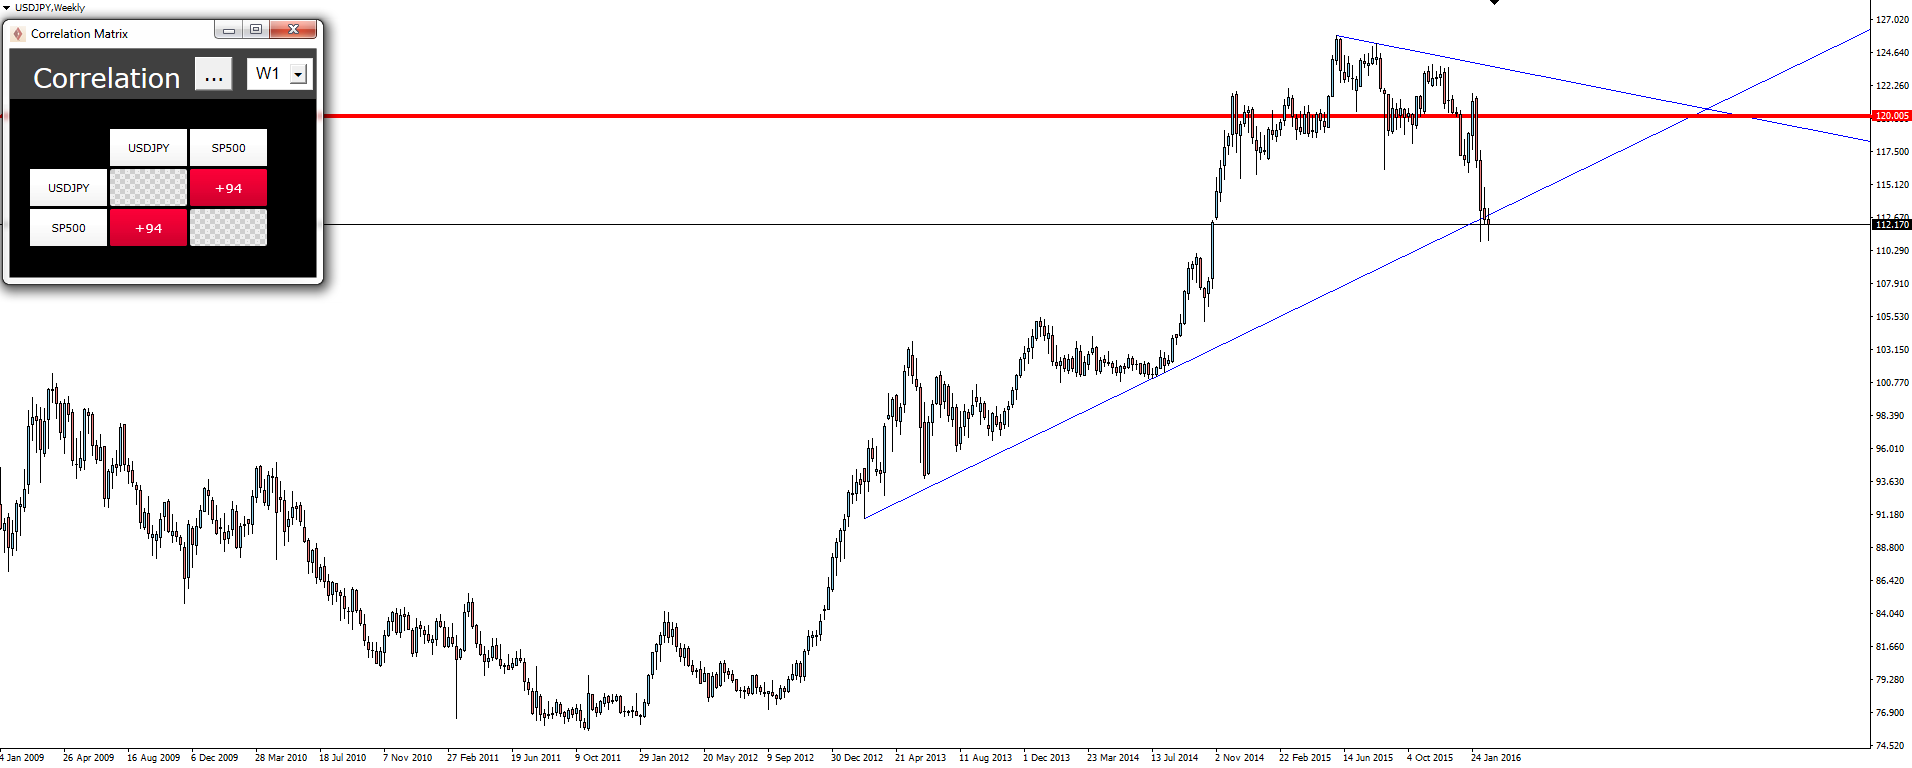
Today’s chart of the day goes a little deeper than just the one chart, initially taking a look at USD/JPY but then comparing it to the S&P 500 indices chart.
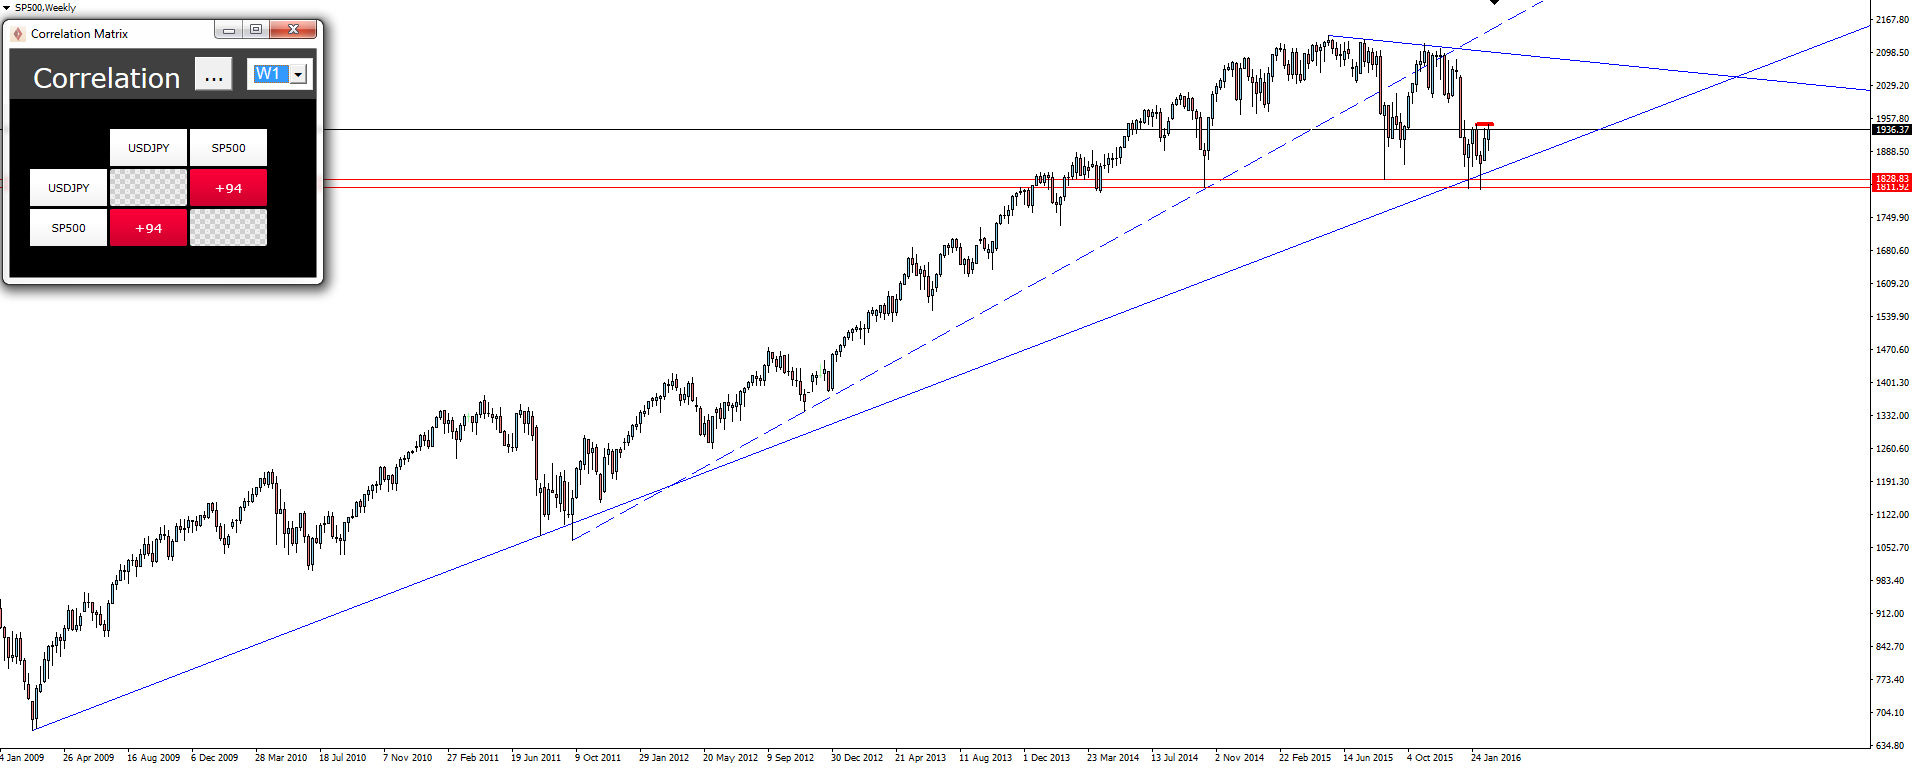
S&P 500 Weekly:
Look familiar?
Using the ‘Correlation Matrix’ on the MT4 SmartTrader Tools package, we can see that the higher the time-frame, the higher the correlation between USD/JPY and the S&P 500 indices markets.
Even with its own fundamental drivers pushing the pair lower, the highly correlated USD/JPY just can’t sustain a break on its own while the major trend line support across indices holds firm.
Yes it may look like the pair has broken support, but the longer these weekly trend lines run, the more I like to treat them as a ‘zone’ rather than a hard level and this is a perfect example here.
That’s not a break out.
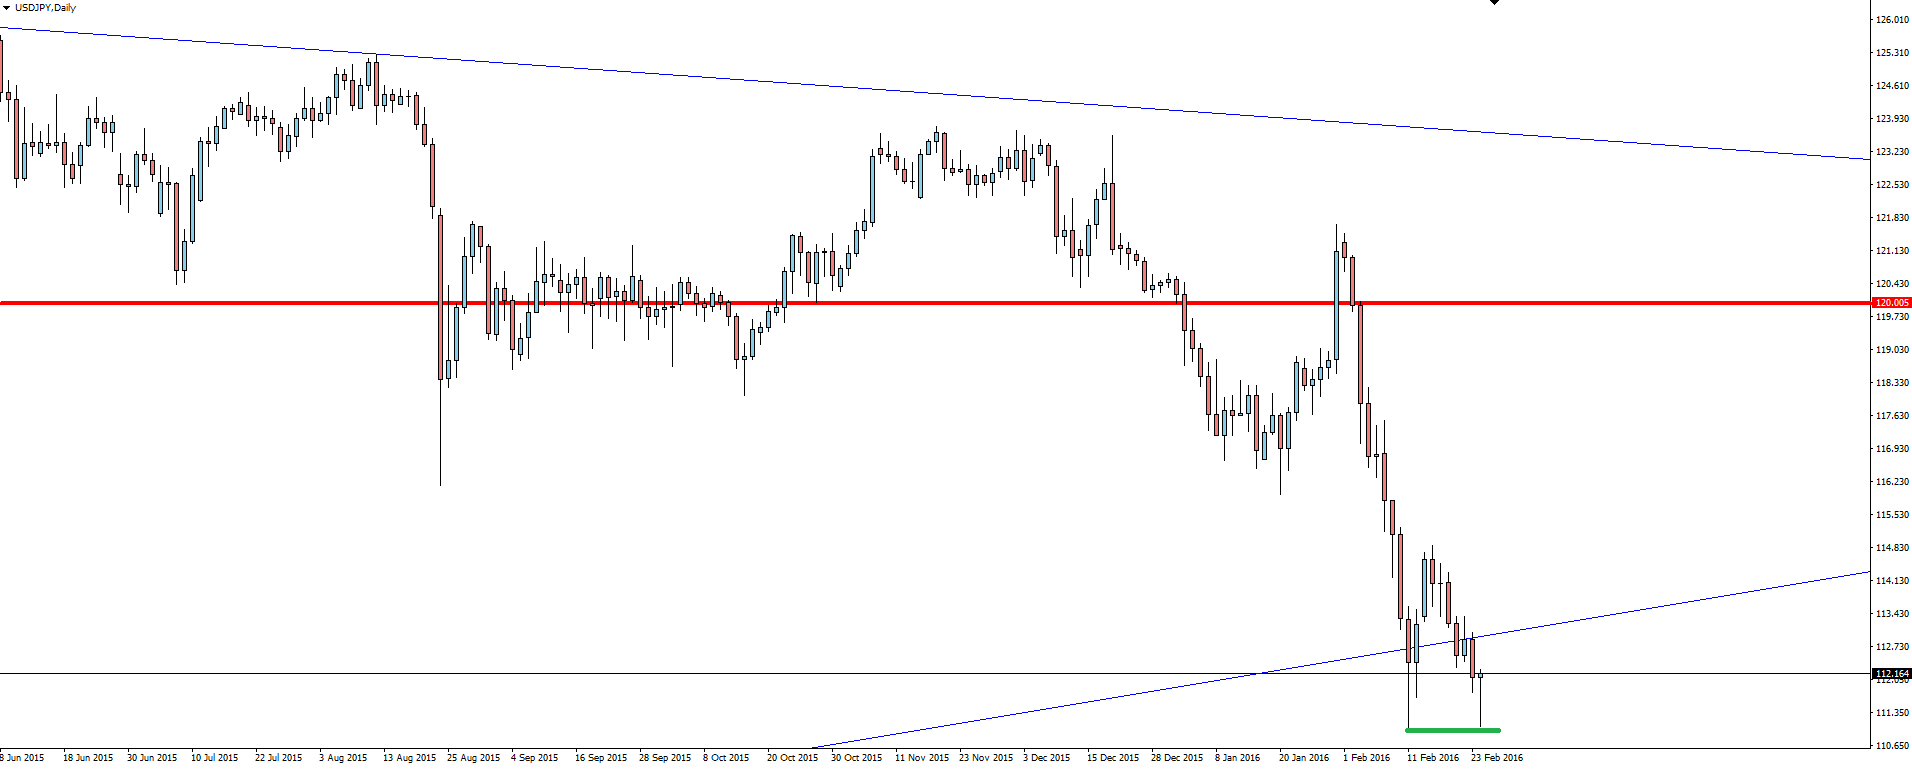
USD/JPY Daily:
The daily shows price chopping through it, but no lower low has managed to form and the two long wicked rejections could even be forming a double bottom here.
What’s your opinion on the S&P 500 weekly support level and what effect it’s having on forex markets?
On the Calendar Thursday:
AUD Private Capital Expenditure q/q
GBP Second Estimate GDP q/q
USD Core Durable Goods Orders m/m
USD Unemployment Claims
Do you see opportunity trading correlations between Indices and forex?
Risk Disclosure: In addition to the website disclaimer below, the material on this page prepared by Forex broker Vantage FX Pty Ltd does not contain a record of our prices or solicitation to trade. All opinions, news, research, prices or other information is provided as general news and marketing communication – not as investment advice. Consequently any person acting on it does so entirely at their own risk. The experts writers express their personal opinions and will not assume any responsibility whatsoever for the actions of the reader. We always aim for maximum accuracy and timeliness, and MT4 Forex broker Vantage FX shall not be liable for any loss or damage, consequential or otherwise, which may arise from the use or reliance on this service and its content, inaccurate information or typos. No representation is being made that any results discussed within the report will be achieved, and past performance is not indicative of future performance.

