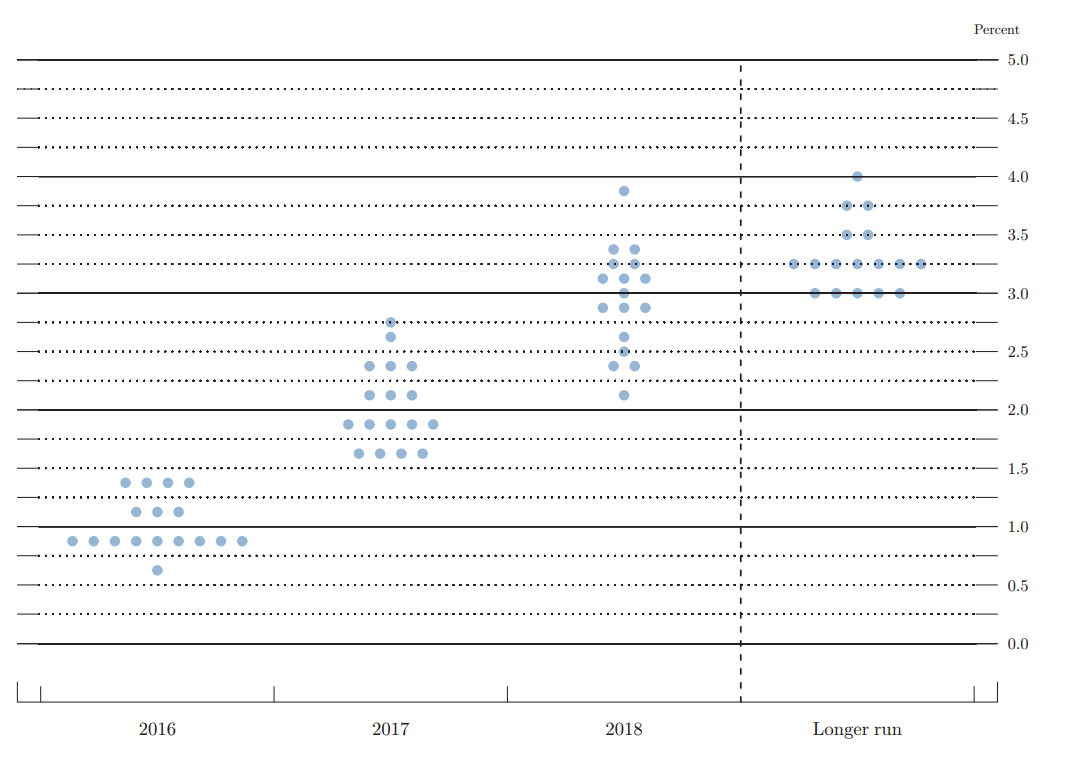
The May 18th FOMC Meeting Minutes contains direct references to a potential rate hike at the next June 14 – 15 FOMC meeting. Recall in March meeting, the Fed Dot Plot chart (see below) suggests that Fed believes two rate hikes this year is the likeliest outcome, albeit with the usual data dependent clause.
Since the beginning of the year, market participants are trying to assess if U.S. data justifies more rate hikes and if so, which month. U.S. data this year has been rather mixed. Labor market conditions have continued to improve although growth in GDP appeared to have slowed. U.S CPI in April increased to 3 year high of 0.4%, up from 0.1% increase in March, due to the rise in gasoline and food prices. Overall, with market stabilizing since the beginning of the year, and economic data continues to paint a consistent slow recovery, the Fed is still on the path to tighten the monetary policy.
In regards to timing, there’s another potential big market moving event in June 23rd. The UK Referendum is going to decide whether the British people want to stay in or outside of the European Union. Initially, it was believed that the Fed likely would not make a rate hike move this June before getting clarity on the outcome of the U.K referendum. Thus, the month of July is more favorable for a rate hike.
However, the May 18th FOMC minutes suggests that rate hike as early as June is not off the table. Further interviews with several Fed members since last week also suggest that June rate hike is possible. St. Louis Fed President James Bullard specifically says that the UK referendum will not affect the Fed’s upcoming decision on rates. Fed Funds future has since snapped higher to 36% from just 12%, indicating increased rate hike expectation for the upcoming June meeting. With a hawkish Fed and US rate hike expectations rose sharply, global equities may continue lower in the next 1 or 2 months.
Technical Analysis

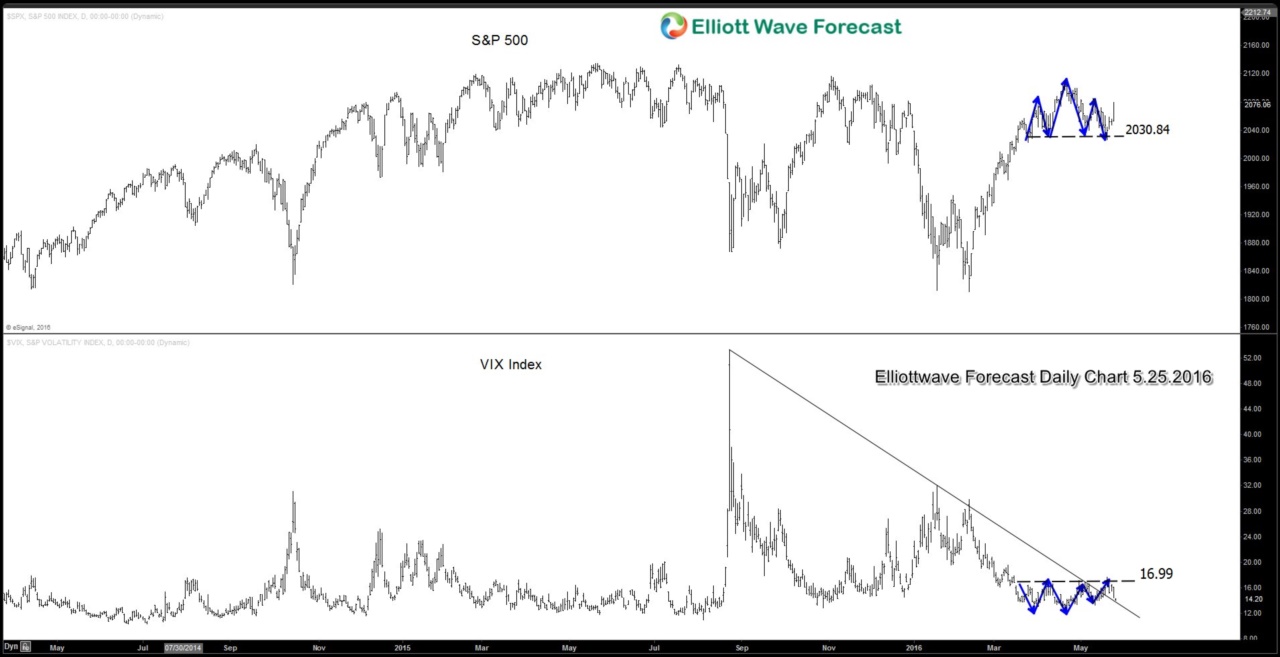
VIX Index is looking to form a low. The Index has broken the trend line from 8/24/2015 peak and showing a possible inverse head and shoulder pattern. A break and close above 17 may suggest a significant rise in volatility, and it’s likely accompanied with S&P 500 breaking below 2030 .
