Interest Rates are Sharply Higher on Reflation/Inflation Concerns
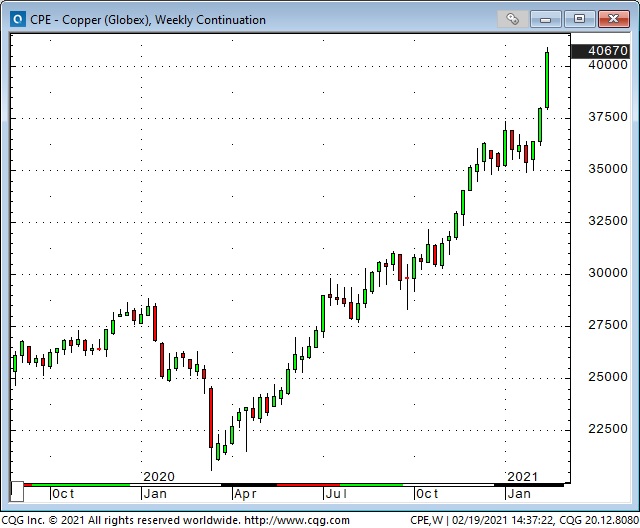
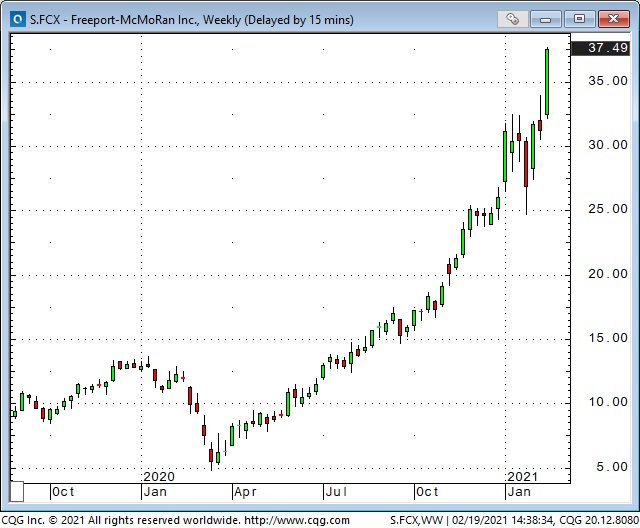
Copper is at a 10-year high and has doubled in the last 11 months. Half of those gains came since the Nov. 3 elections. Freeport-McMoRan (NYSE:FCX) is up ~600% from last year’s lows.
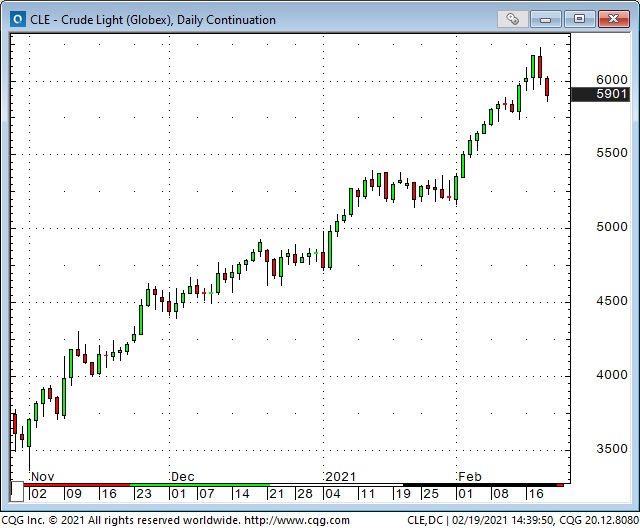
Crude oil (WTI) has jumped over 80% since the November elections.
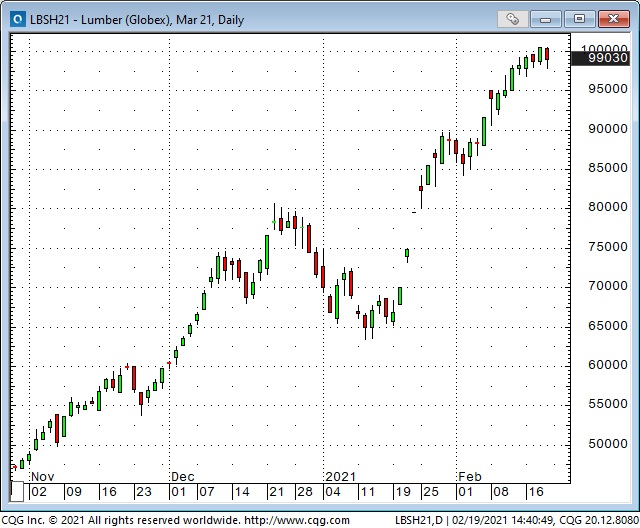
Lumber has quadrupled from last year’s lows, doubled since early November.
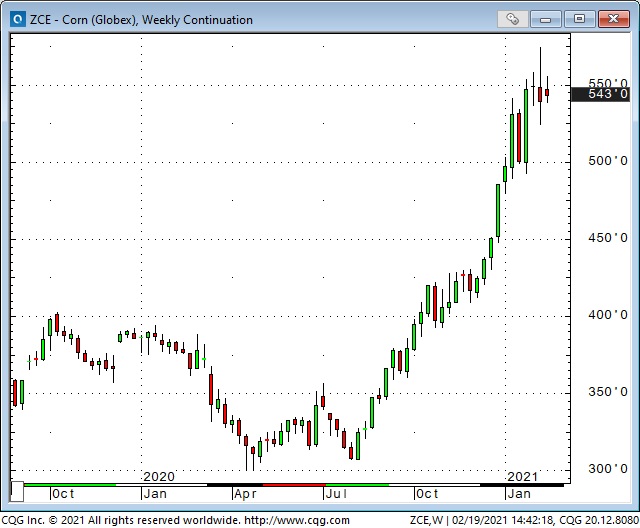
Corn jumped 90% in the last 7 months.
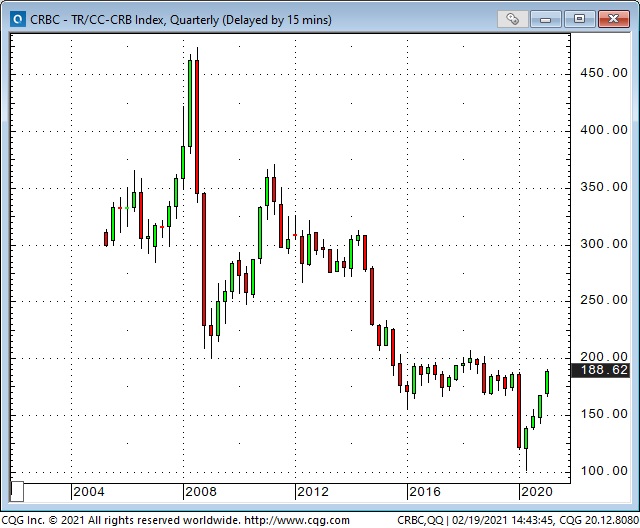
The major commodity indices hit 28 month highs this week.
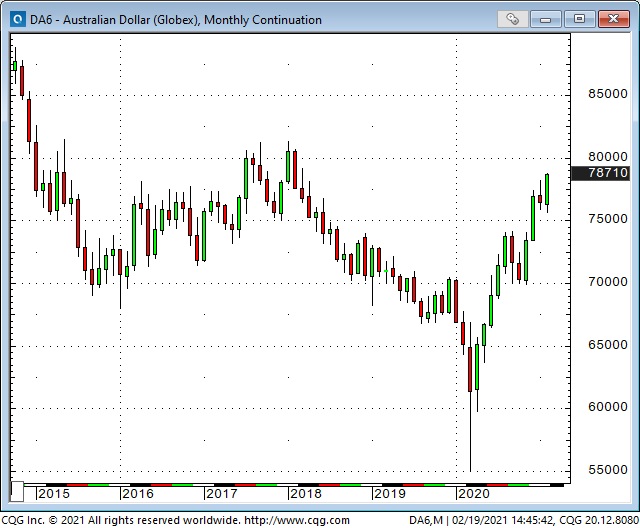
The Australian dollar closed at a 3-year high this week—the CAD and the NZD/USD were close behind. Commodity currencies are rocking.
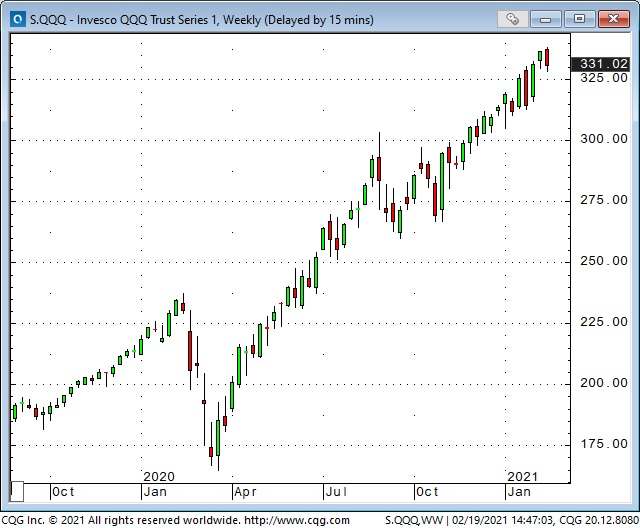
The NASDAQ ETF (QQQ) hit all time highs this week up ~105% from last year’s lows.
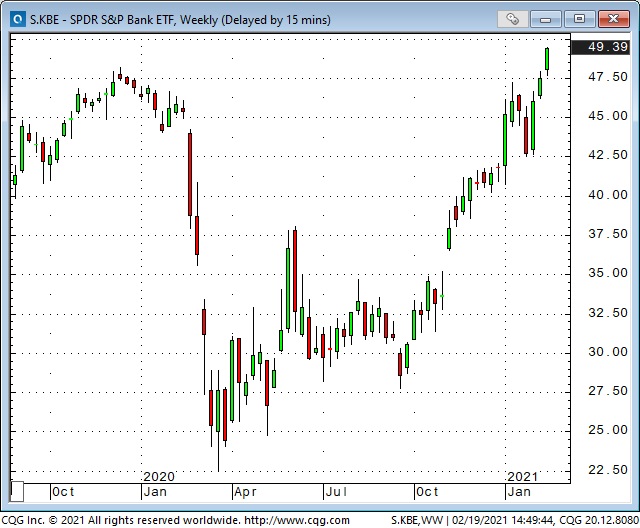
The bank shares ETF (KBE) is up nearly 50% since President Joseph Biden’s election. Bank shares love rising interest rates.
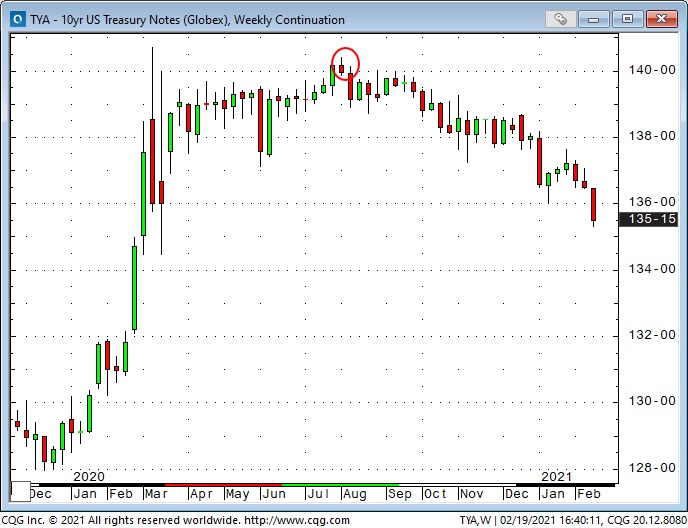
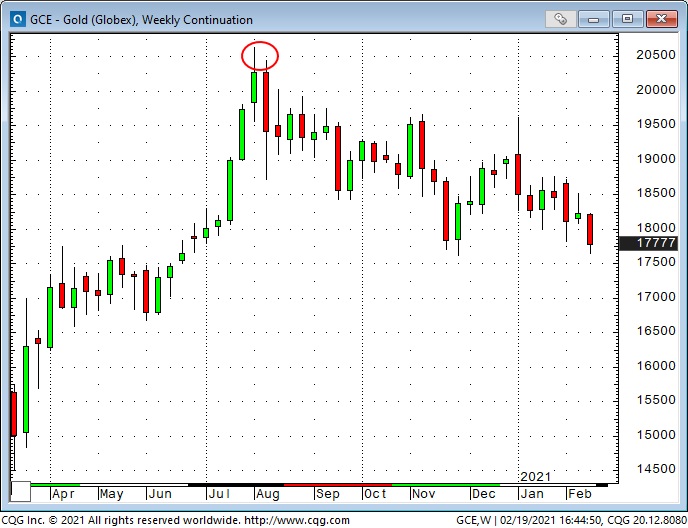
The 10-year US Treasury bond yield has been trending higher since last August and touched 1.35% Friday. 10-year bond futures prices (which fall as rates rise) are near a 1-year low. (BTW: Both bonds and gold reached a high last August and started to fall from there.)
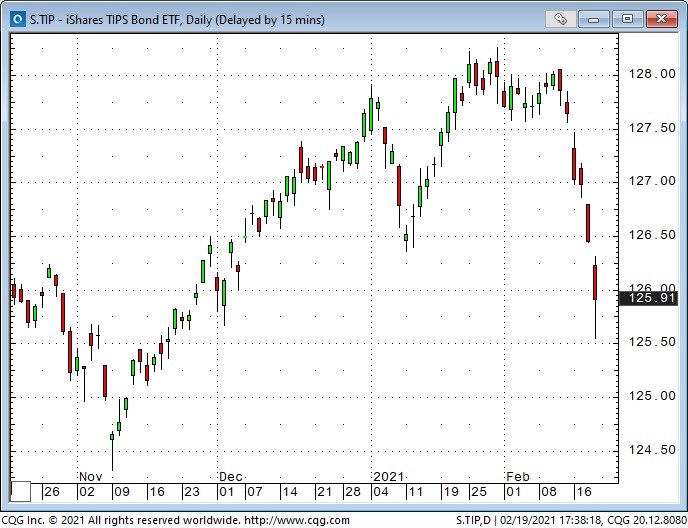
Real yields on the 10-year Treasury hit record lows in late January around negative 1.07% but have risen sharply this week to around negative 0.84%.
Is The Fed Behind the Curve?
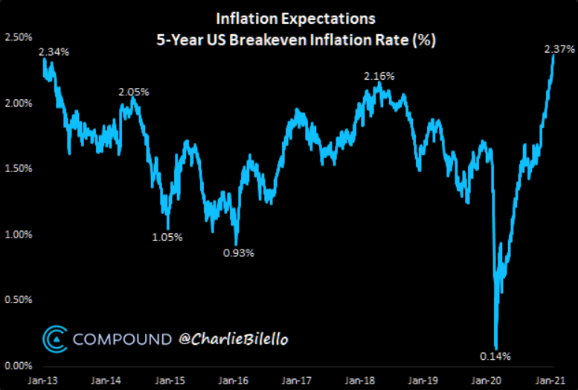
The market is betting on higher inflation, but the Fed (and the Biden administration) seems to think that the economy is still struggling and needs HUGE monetary and fiscal support. If the Fed/Treasury continue/expand stimulative actions (as the market expects) inflation concerns will increase.
The Eurodollar strip shows that the market has now 'pulled forward' the anticipated first Fed interest rate INCREASE from around Spring 2024 to Summer 2023. If inflation concerns intensify I expect the market to keep pulling that anticipated increase forward.
The Fed knows that Y-O-Y inflation numbers will come in hot the next few months due to the virus tanking the economy last spring. Fed Chair Jerome Powell has made it clear that the Fed is willing to let inflation 'run a little hot.' This sounds like an ideal opportunity for a new generation of Bond Market Vigilantes to earn their spurs.
Has the New Commodity Super Cycle Started?
The short answer is, yes. I posted the PowerPoint slides (and extra charts and commentary) of my 'New Commodity Bull Market' presentation last week. The thesis I have been developing over the past few months is that a multi-year commodity bull market started when the major commodity indices reversed from multi-year lows last April.
The three main reasons I think commodities go higher are 1) currency debasement/inflation, 2) supply shortages in the face of strong demand, and 3) capital will flow from richly priced stocks and bonds to cheaply priced commodities.
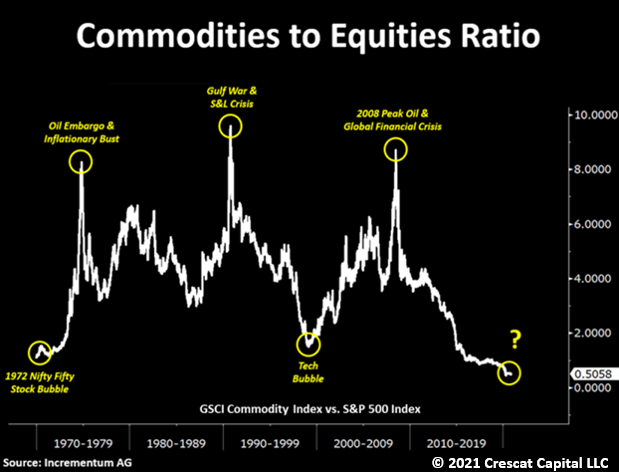
We currently have ideal conditions for a commodity bull market, and I spell out those conditions in my presentation. The only 'second thoughts' I have about the presentation is that I expected to see a correction to the red hot commodity markets to provide a great long-term buying opportunity. So far there has been no correction, but I still think one is over-due!
Timing the Commodity Bull Market Trade
I’ve been blown away by the strength, speed and duration of some of the 'momentum' moves we’ve seen in different markets over the last year (and especially since early November.) I feel like I’m wearing rubber boots in Canadian hockey terms, and the markets are all wearing skates.
As a trader I have to ask myself why I’ve missed those amazing moves. My short answer is that I’ve been 'held back' by my Old School valuation bias and by risk management considerations. I just couldn’t bring myself to 'chase' runaway markets.
I have not truly understood that there are WAY MORE people 'out there' with WAY MORE cheap money than I could possibly imagine chasing everything that is going up.
My saving grace as a trader has been all about Risk Management. I haven’t made huge profits but I haven’t suffered huge losses either because I will not 'chase' a runaway market and I will not short something just because I think it is 'too high.'
I must have a very good reason to think something will fall before I go short. One of the best reasons to think something is going to fall is that it is already falling. If a market appears to have topped out (short term chart patterns) after a strong uptrend I will only get short in small size with tight stops.
My Short Term Trading
Stock Market Trade
The small-cap Russell 2000 index has soared relative to the other major US stock indices, especially since Biden’s election, and I thought buying the DJIA against the Russell 2000 (RTY) might be a good way to fade the reflation trade. I calculated shorting 4 RTY emini contracts against long 3 DJIA emini contracts would be close to an equal-dollar weighted spread.
RTY hit an all time high last week ~2315, sold off a bit, and when it rallied back after the long weekend, it rolled over just before making a new high. (I like a failed attempt to make a new high as a short signal—especially if I see confirmation in other markets.)
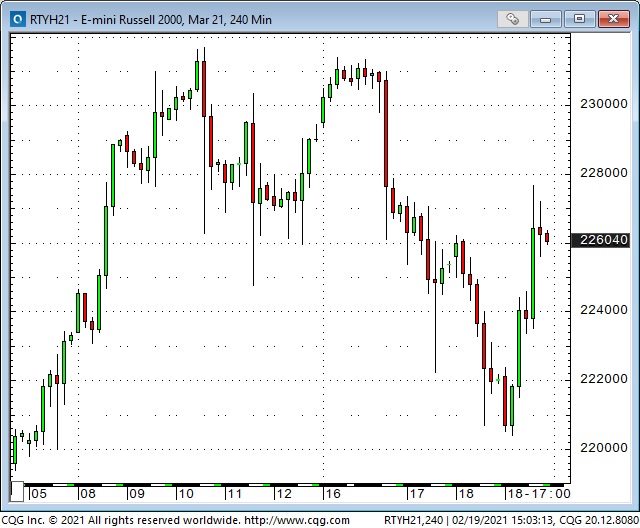
I shorted RTY on the first break and then added another position later. My idea was to leg into the spread—to short RTY and then buy DJI later. I moved my stops lower as RTY fell. RTY rallied ahead of the Friday floor session and I was stopped for a small loss.
Currency Trade
Shorting the CAD seemed like a good way to fade the reflationary trade. Over the past few months the two main positive correlations with a rising CAD have been, 1) the rising stock market, and 2) rising commodities, especially crude oil. The main negative correlation has been the falling USD. I’ve previously described rising stocks and commodities and a falling USD as 3 legs of the pro-risk reflation trade. I’ve thought all three of those things were due for a reversal.
The CAD traded to a 2 year high in January but quickly fell back. (First circle on chart.) Right after the long weekend it spiked above 79 cents and once again got rejected (2nd circle.) I saw this as an opportunity to get short with an apparent 'lid' on the market. The trade looked good Wednesday and I lowered my stop. The CAD crept higher Thursday and I was stopped out overnight Thursday for a tiny loss, which was a good thing because the CAD rallied to close Friday at a 2 year high.
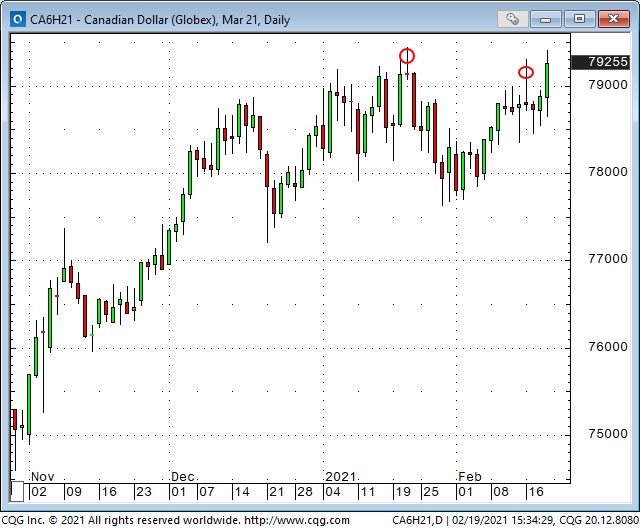
If a market moves in my favor after I establish a position I try to reduce my risk on the trade by moving my stop close to breakeven as soon as possible. Sometimes I regret doing that but my main goal is to protect my trading capital. No individual trade is 'special' in any way—it’s just a trade!
Crude Oil Trade
WTI has rallied >80% in the past 3 1/2 months with open interest up ~25%. Typically rising prices with rising open interest is bullish. I think OIL is telling us that a lot of speculators are buying WTI (and Brent) as a bullish play on the reflation/commodity supercycle narrative. This week WTI traded to a 13 month high on events in Texas. I thought that might be a blow-off top.
Instead of shorting WTI outright, I put on a bearish calendar spread—buying August, selling June. In the chart below, you can see that in November (when front-month WTI was ~$34BBL), August traded at a premium of ~15 cents over June—a contango spread. This week August closed at $1.14 under June after being as much as $1.45 under Thursday. (When a deferred contract trades at a discount to a more nearby contract, it is called a backwardation market—which often signifies a market that is short of supplies for near-term delivery.)
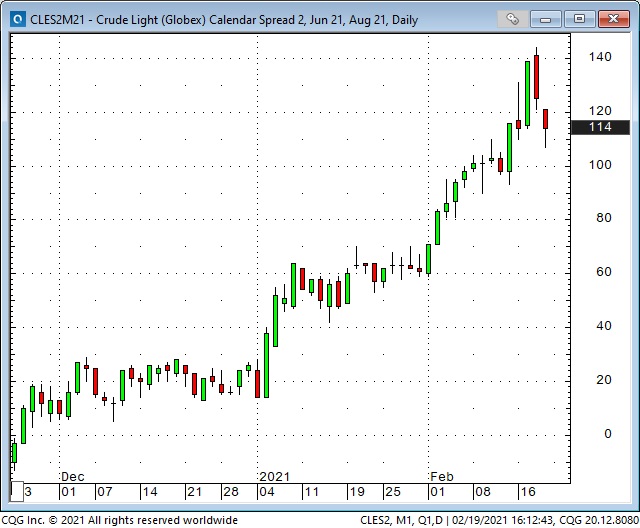
I like to trade WTI calendar spreads because they are WAY less emotional than the outright futures contracts and they have HUGE size on the bid/offer spreads (they are extremely liquid.) I can choose a level of risk exposure by the amount of time between the legs of the spread. (A two month spread like mine is 'kissing your sister' compared to a 12 month spread.) Also if a geopolitical event causes the market to rip higher overnight I have WAY less exposure than being outright short.
If WTI falls ~$10 BBL ($10,000 per contract) each 2-month spread should gain ~$700 – $800.
