As the new year begins, gold continues to gain respect as the ultimate investment asset. Unfortunately, the same cannot be said for the U.S. dollar.
Most investors tend to view the dollar as a “safe haven,” but the big bank forex traders that really move the currency market view the dollar as a risk-on asset class.
They view gold and the Japanese yen as the main risk-off assets. So, when the dollar falls against the yen and gold as the U.S. stock market rises, all may not be quite as it seems to investors.
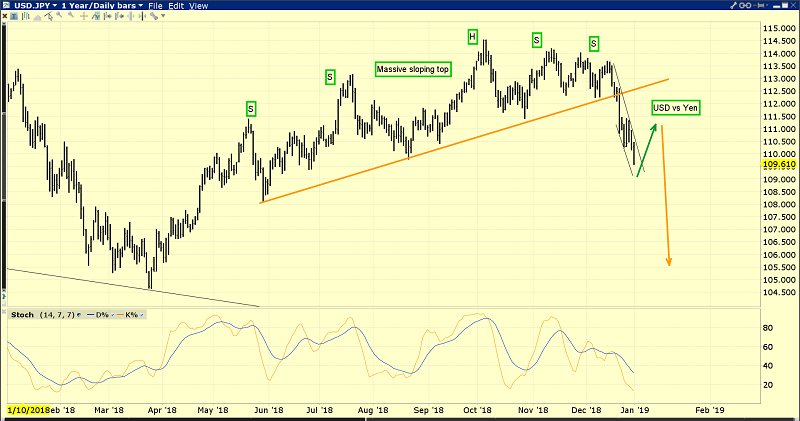
After building an immense sloping H&S top pattern, the dollar has collapsed against the yen and is now almost in “free fall.”
That top pattern is technically a “head and shoulders (top) bear consolidation pattern,” and its implications are ominous.
I’m short the dollar versus the yen (and short the dollar versus the yuan) in the forex market. Traders are making solid profits on these anti-dollar trades.
We’re also long Direxion Daily Gold Miners Bull 3X Shares (NYSE:NUGT) and Barrick Gold Corporation (NYSE:ABX). With John Thornton and Mark Bristow at Barrick’s helm, I now have a $200 long-term price target for Barrick. The NYSE stock symbol is set to change from ABX to GOLD tomorrow, and that’s positive news.
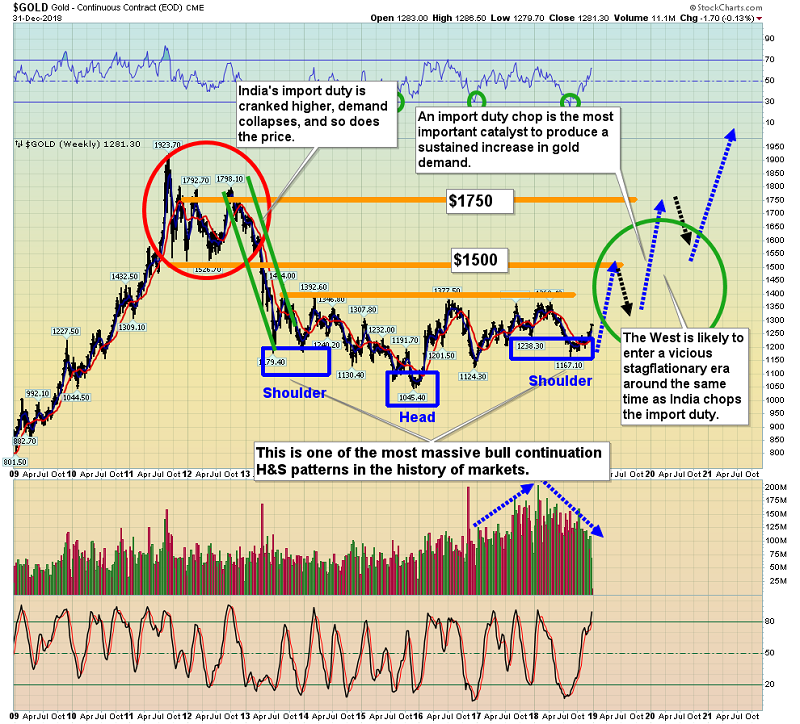
As 2019 begins, investors need to think hard about whether it’s more important to predict a late cycle rally for the U.S. stock market, or a much better idea to focus on the spectacularly bullish price action taking place on the long-term gold chart.
India’s government is launching a new pro-gold policy within a few weeks. That will see gold become endorsed as a respected investment asset class by the government. A significant chop in the import duty will likely follow, and discussions are already underway with Russian entities about duty-free imports.
In the U.S., the current collapse in the dollar comes late in the business cycle. The big bank forex departments are almost universally negative on the dollar, and rightly so.
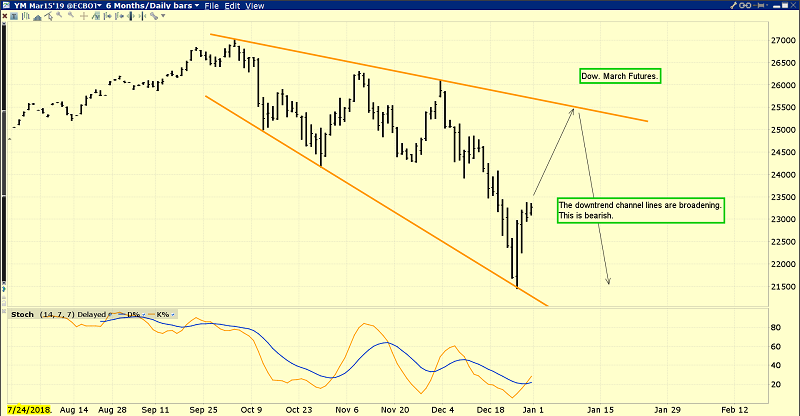
The dollar melt-down against the yen is happening as the U.S. stock market trades lower on ramped-up quantitative tightening that Fed chair Powell now says is on “auto pilot.” Investors who ignore quantitative tightening in the late stage of the U.S. business cycle are making as big a mistake as ignoring quantitative easing at the 2009 trough of the cycle.
Also, a Dow Theory sell signal could take place in 2019 if both the Transports and the Industrials cannot make new daily closing highs and then break the current lows.
I’m long the Dow now via (NYSE:UDOW), but that’s just a technical swing trade, albeit a winner already. In the big picture, investors need to think about only one thing in 2019 and that is gold.
While the job market is officially very tight, a lot of that tightness can be explained by a large number of part-time jobs. The labor department counts one worker working two part-time jobs as two people working. That’s arguably fraudulent accounting. Regardless, the huge number of part-time jobs is the main cause of the slow growth in wage inflation.
Having said that, as the full-time jobs market tightens significantly in 2019, much more wage inflation will appear… and it will do so as corporate earnings fade towards the single digits growth range.
In a nutshell: Welcome America, to the rebirth of Stagflation!
I’ve predicted that investors are making a mistake if they sit around and wait for Trump to “make things great” while the U.S. government debt rises ever-higher in the late stage of the business cycle. It’s an understandable mistake that comes from frustration with the hideous socialist and war-mongering policies of past U.S. administrations. The murderous war-mongering has been financed with gargantuan debt, making it even more vile.
Regardless, the much wiser plan of action is to use Trump’s incredible work ethic and business acumen as personal inspiration to take professional action in the gold and silver market.
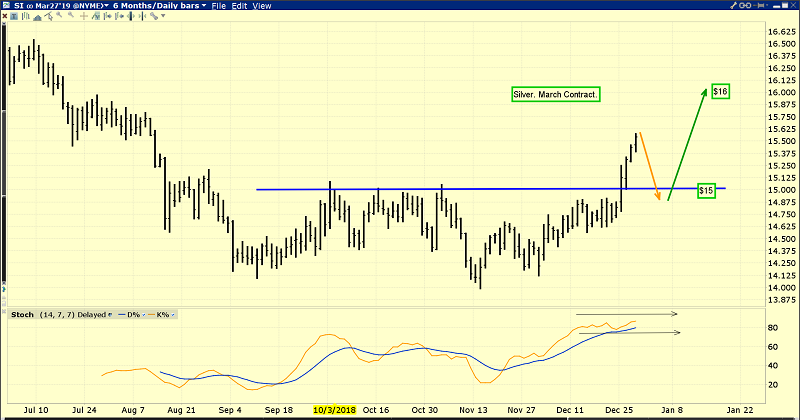
This is the awesome silver chart. I wanted to see a three-day close over $15.20, a Friday close over that same price, and I also hoped to see that “cake” iced with a 2018 year-end close above $15.20.
All three technical events occurred. While the short-term target is the decent price area at $16, I am projecting much higher prices over the 2019-2022 time frame. It’s important that all precious metals investors understand that while gold soared above its 1980 high in 2010-2011, silver barely made it back to its 1980 high of about $50. That’s because the world has been in a general deflationary (lower rates) cycle since about 1980.
Now, stagflation and higher rates over the long-term (like occurred in America in 1966 -1980) are beginning. When silver barely made it back to its 1980 high after 30 years, the price action was not “parabolic” like it was in the late 1970s. It was more of a modest blip related to gold dragging silver modestly higher in an overall risk-off play. What’s coming for silver now is much different than what happened in 2011. It will be parabolic (as stagflation reaches a crescendo, years from now), but it’s only barely beginning.
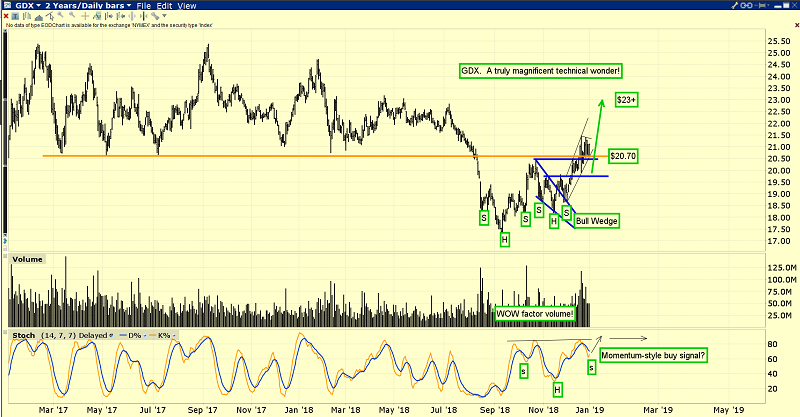
I’ve boldly referred to GDX (NYSE:GDX) as “Prince of Assets GDX” and called the entire $23 - $18 price zone the most important investor accumulation zone in the history of markets.
With maverick money managers like Ray Dalio calling for a U.S. inflationary depression while amateur investors try to gamble on the late stage of the stock market cycle, I predict there’s a 90% chance that I’m proven correct.
On this GDX chart, I’d like investors to note the bullish action, the enormous volume, and also take a close look at the $21.67 resistance area that GDX has already closed above repeatedly since arriving there. All the price action is positive, and it’s poised to become much more positive as January trading gets underway. Perhaps I should let “Queen Gold” and “King Silver” have the final word as 2019 begins, which is: Happy New Year to the entire world gold community!
