
Analysts have made their predictions. Now it’s time for the actual results. Energy infrastructure provider Kinder Morgan Inc. (NYSE:KMI) kicked off the energy earnings season when it reported second quarter results yesterday after the market close.
Now, it’s the turn of the oil services companies – providers of technical products and services to drillers of oil and gas wells – to come out with Apr-Jun numbers, which are likely to provide a better understanding of the sector’s prospects in the near future. In particular, key oil services earnings scheduled for release over this week and the next, including Schlumberger Ltd. (NYSE:SLB) and Halliburton Co. (NYSE:HAL) , assume greater significance.
The world’s largest oilfield services provider Schlumberger is scheduled to report on Jul 21, while smaller rival Halliburton will release its second quarter earnings report on Monday, Jul 24. As such, this may be a good time to consider which of these is a better stock. Both of them carry a Zacks Rank #3 (Hold). You can see the complete list of today’s Zacks #1 Rank (Strong Buy) stocks here.
Let’s dive in.
Schlumberger and Halliburton are both major players in the Oil and Gas - Field Services industry, which is ranked a lowly 208 out of the 256 industries in our coverage (bottom 19%). The broader Oil-Energy sector of which it is a part, is also staring down the barrel - currently sitting at the bottom of the Zacks Sector Rank (16 out of 16). (To learn more visit: About Zacks Industry Rank.)
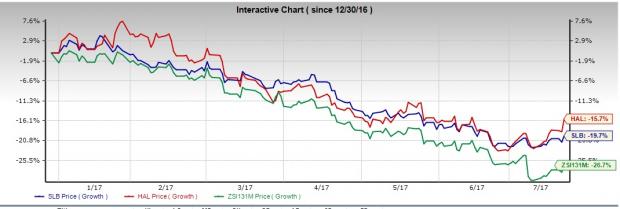
Price Performance
Schlumberger and Halliburton shares have suffered this year, as have shares of all oil-related companies, to reflect the commodity's price slide and uneven outlook. That said, both have done better than their peers. While the Zacks Oil and Gas – Field Services Industry has lost -28.4%, Halliburton is down by just -15.7% year to date and Schlumberger has witnessed its share price decrease by -19.7% since Jan.
Earnings History and ESP
Halliburton has an incredible history when it comes to beating earnings estimates. Investors should note that Halliburton hasn’t missed earnings estimates since mid-2014. As far as recent history is concerned, the TX-based firm delivered earnings beat in each of the trailing four quarters, with an average positive earnings surprise of 68.49%. On the other hand, Schlumberger has delivered positive surprises in just two of the prior four quarters with an average earnings surprise of a modest 4.55%.
The situation does not change when considering Earnings ESP values as well, with Halliburton clocking in at +15.79% while Schlumberger’s reading stands at +3.33%. You can uncover the best stocks to buy or sell before they’re reported with our Earnings ESP Filter.
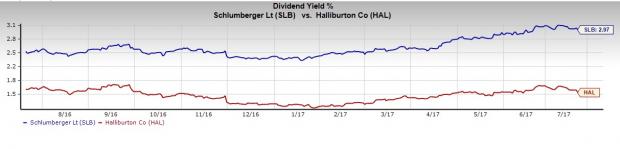
Dividend Yield
Schlumberger’s dividend yield over the last one-year period is 2.97%, higher than the broader industry’s figure of 2.12%. With a dividend yield of 1.58% Halliburton shareholders earn significantly lower dividend yield than Schlumberger as well as the industry at large.
Valuation
Compared with the S&P 500, the Oil and Gas – Field Services industry is undervalued. This implies that the industry has the potential to gain in the near future. The industry has an average trailing 12-month EV/EBITDA (enterprise value to earnings before interest, tax, depreciation and amortization) ratio – which is often used to value oil and gas stocks, given their significant debt levels and high depreciation and amortization expenses – of 8.56, which is below the S&P 500 average of 11.01. Hence, it might be a good idea not to stay away from stocks belonging to this industry.

Coming to the two stocks under consideration, with an EV/EBITDA ratio of 34.16 Halliburton is overvalued compared to the S&P 500 and the industry. However, though Schlumberger also looks pricey compared to the industry and the S&P 500, with an EV/EBITDA ratio of 11.69, it defeats Halliburton decisively.

Investment Style
According to the Zacks style score system, Halliburton has a Value Score of D, Growth Score of A and Momentum Score of A. This stock is therefore most suitable for growth and momentum investors.
Schlumberger has a Value Score of D, Growth Score of C and Momentum Score of F, which means that the stock is best avoided.
Other Metrics
Schlumberger’s expected EPS growth for (3–5 years) is 16.10%. This is better than Halliburton’s growth rate of 8.00%.
Also, beta for Schlumberger is 1.02, which shows marginally less volatility than Halliburton’s beta of 1.04.
Net profit margin for Schlumberger is 4.95%. This is way better than Halliburton’s net profit margin of -0.29%.
Also, Schlumberger has a lower leverage as evident by its debt-to-equity ratio of 0.40 compared with Halliburton’s ratio of 1.20.
Conclusion
The comparative analysis shows Halliburton has witnessed a more favorable share price movement throughout the year, possesses a fantastic surprise history, which means it is more predictable, and boasts of a better style score. Additionally, it carries a much higher ESP reading of +15.79%, as against Schlumberger’s figure of +3.33%
However, Schlumberger is superior when considering dividend yield and valuation. Moreover, when considering EPS growth, profit margin and debt load, Schlumberger is clearly a better stock.
3 Top Picks to Ride the Hottest Tech Trend
Zacks just released a Special Report to guide you through a space that has already begun to transform our entire economy... Last year, it was generating $8 billion in global revenues. By 2020, it's predicted to blast through the roof to $47 billion. Famed investor Mark Cuban says it will produce "the world's first trillionaires," but that should still leave plenty of money for those who make the right trades early. Download Report with 3 Top Tech Stocks >>
Schlumberger N.V. (SLB): Free Stock Analysis Report
Halliburton Company (HAL): Free Stock Analysis Report
Kinder Morgan, Inc. (KMI): Free Stock Analysis Report
Original post
Zacks Investment Research