- The Guggenheim Invest Defensive Equity ETF (N:DEF), at first glance, looks like the perfect ETF, positioned within the right sectors and with an investment strategy that seems logical to hedge against economic downturns.
- However, the ETF did very poorly during the current market turmoil, plunging 6.4% in the past month.
- What went wrong with this ETF which seems to tick all the right boxes? In order to understand what went wrong we have to dig a little deeper.
As equity markets are crashing all over the planet, more conservative players look to play defense by considering defensive investments and related exchange traded funds to hedge against the current correction.
Defensive Stocks and Sectors
During market downturns, high volatility and economic uncertainties, many investors use a risk aversion strategy by rotating to defensive sectors through buying defensive stocks and ETFs to shelter from the storm. Defensive Stocks and Sectors are those deemed non-cyclical and not very dependent on the overall economic cycle. The traditional sectors considered defensive are utilities, consumer staples and healthcare. After all, consumers cannot easily manage without gas and electricity, soap and toothpaste and of course their medicine. Other sectors deemed defensive are the telecom sector and the US real estate REIT sectors.
Part of what makes defensive stocks and sectors appealing is their relatively higher and "safer" dividend which caters to investors wanting equity exposure but less risk.
DEF Fund Description
The Guggenheim Defensive Equity ETF (NYSEARCA:DEF) seeks investment results that correspond to the performance, before the Fund's fees and expenses, of the Sabrient Defensive Equity Index (the "Defensive Equity Index"). The Fund invests at least 90% of its total assets in US common stocks, American depositary receipts ("ADRs") and master limited partnerships ("MLPs"). Guggenheim Funds Investment Advisors, LLC (the "Investment Adviser") seeks to replicate the performance of the Defensive Equity Index which is comprised of approximately 100 securities selected from a broad universe of global stocks, generally including securities with market capitalizations in excess of $1 billion. For more information about this ETF click here.
ETF methodology and Sector Allocation
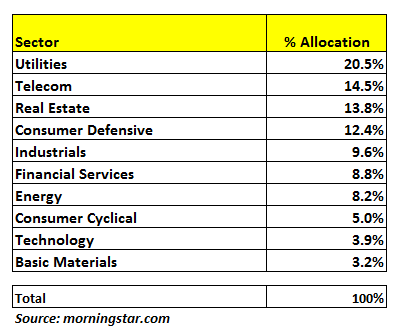
Index selection methodology is designed to identify companies with potentially superior risk/return profiles to outperform during periods of weakness in the markets and/or in the American economy overall. The Index is designed to actively select securities with low relative valuations, conservative accounting, dividend payments and a history of outperformance during bearish market periods. The Index constituents are well-diversified and supposed to represent a "defensive" portfolio. The sector allocation of this ETF is as follows:

DEF Dividend and Fees
DEF pays a respectable dividend of 3.31% and charges an acceptable management fee of 0.65%.
The Perfect Defensive ETF?
At first glance, DEF looks like a pretty diversified ETF, positioned within the right sectors to hedge against economic downturns in its focus on traditional defensive stocks, including utilities, real estate and consumer defensive. With its highly regarded investment advisor Guggenheim and an investment strategy that seems logical, DEF might even look like the perfect defensive ETF, as its name suggest, but is it really?
Performance of DEF in the past 30 days
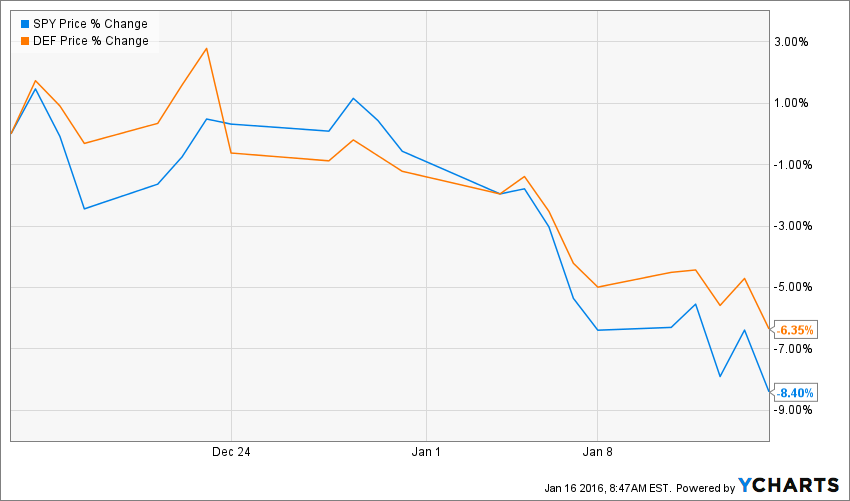
The following chart depicts the performance of DEF against the S&P 500 index tracked by the SPDR S&P 500 ETF (NYSEARCA:N:SPY) during the past 30 days ending Friday January 15, 2016:

Source ycharts.com
As noted on the chart above, DEF utterly failed as a defensive ETF as it tumbled 6.4% when the S&P 500 Index fell 8.4%.
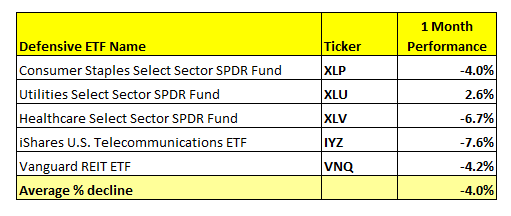
Let us compare the performance of DEF against the average performance of the five defensive sectors: 
The failure of DEF is even more evident based on the above table as DEF tumbled by 6.4% against an average decline of 4% for the five main sectors considered to be defensive.
So what went wrong with this ETF which seems to tick all the right boxes? In order to understand what went wrong we have to dig a little deeper.
Three reasons DEF failed to do its job as a defensive ETF
1- Geographical allocation issues:
- A high 9.3% geographical exposure to the Asian market, of which about one-third relating to emerging markets. The allocations include countries such as Singapore, Taiwan, Japan and Asian emerging markets, all of which are very sensitive to China and took a large hit from the Chinese stock market crash. Stocks in this category include Telekomunik Indonesia (N:TLK), Japan's Nippon Telegraph & Telephone (NYSE:N:NTT), and Korea's SK Telecom (NYSE:N:SKM).
- Direct exposure to China (China Mobile (N:CHL), China Petroleum & Chemicals (NYSE:N:SNP), and Chunghwa Telecom (NYSE:N:CHT)).
- About 2% is allocated to South American markets which are highly dependent on commodities and tend to be more sensitive to economic and market volatility and uncertainty. Stocks in this category include Banco De Chile-ADR (N:BCH) and Mexican Grupo Aeroportuario PAC-ADR (N:PAC).
2- Sector Allocation issues:
- The Fund has a high 8.2% exposure to the energy sector including oil and gas Master Limited Partnerships. These sectors got hammered the past month. DEF holds indeed high risk stocks for the current environment, such as National Oilwell Varco (NYSE:N:NOV) and Targa Resources Partners (N:NGLS).
- A 3.2% exposure to the basic material sector which has been diving for the past two years, as commodity prices reached multi-year lows on concerns of a China slowdown. Stocks in the ETF include AGL Resources (N:GAS) and Syngenta AG (VX:SYNN).
- A very high exposure of 14.5% to the telecom sector proved to be too much for a defensive ETF, as the sector plunged 7.6% to become one of the ugliest defensive plays for the past month. Stocks in the ETF include Verizon (N:VZ), Frontier Communications (NASDAQ:O:FTR), NTT DOCOMO (N:DCM) and Vodafone (NASDAQ:L:VOD).
3- Passive Investing Strategy:
The most notable problem with DEF Fund lays in the fact that it uses a "passive" or "indexing" investment approach which makes it vulnerable as economic conditions change. DEF does not have a dynamic system in place to exclude currently risky sectors which once used to be considered safe, such as the oil sector and commodities sector, or to limit exposure to disfavored regions and countries.
Conclusion
Guggenheim Defensive Equity DEF - don't get fooled by its name! The same can be said about other Defensive ETFs which may seem right at first glance. Investors should still do their due diligence and closely examine how the underlying assets are invested before putting money at work.
