Stocks continue to hold up but aren’t acting strong by any-means.
I remain in an all cash position as we may still be setting up for a try into new all-time highs in the S&P, but at the same time, we may see some volume come in to push us lower in the week ahead, which would force my hand into some short trades.
The metals, mainly gold, were strong and continue to act great as the trend higher becomes more and more solid, but it’s still in the very early stages.
Let’s take a look at the charts who are trending nicely higher.

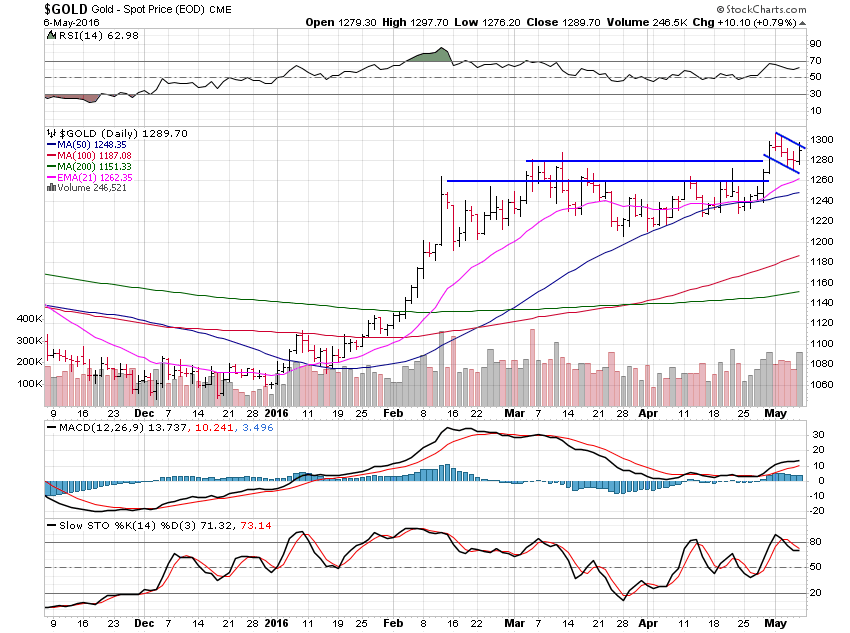
Gold just gained 0.40% this past week but it held key support and setup a nice pattern to now move higher out of.
Great action for gold as it tested the key $1,280 breakout level and is now set to break above the bull flag.
Gold is acting great and dips can be bought as this newly changed dominant trend to up is now in full force.
This new leg of strength should last at least 3 years, so I’d consider this a long-term trade.
Gold has heavier resistance overhead at the $1,310 then $1,420 in time.

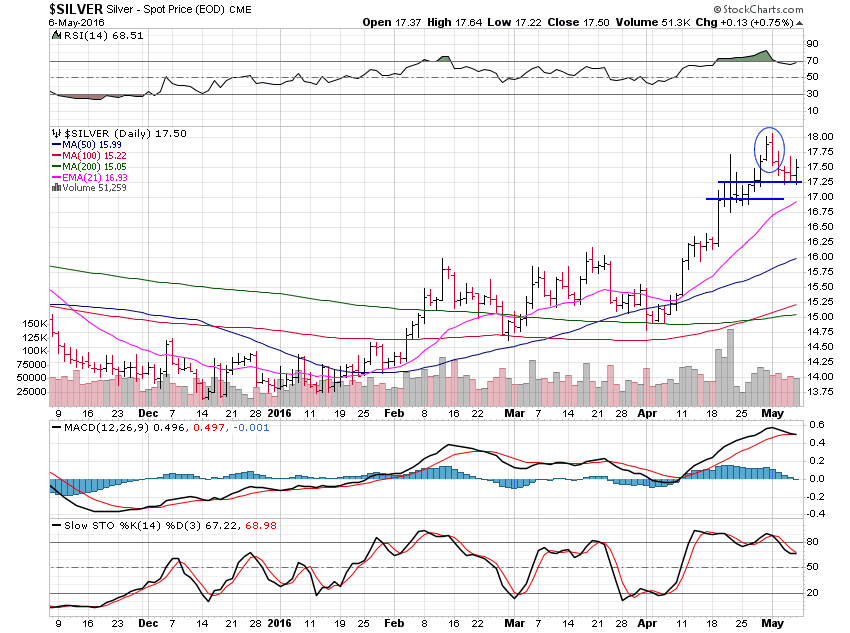
Silver lost 2.15% for the week and is looking a bit weak here with a 2 day top early in the week but $17 is a decent support area still so I’m not looking for much more downside.
$18.50 has been a target on the upside now for weeks and we are nearly there.
The bull market has resumed and looks great for the next few years with new highs above the $50 area all but certain.
I’d look at buying dips and holding until we see another blowoff type of spike top such as we saw back in 2010.
After $18.50 we have to look up to $22, then $26 as major resistance areas but they will take some time to hit.

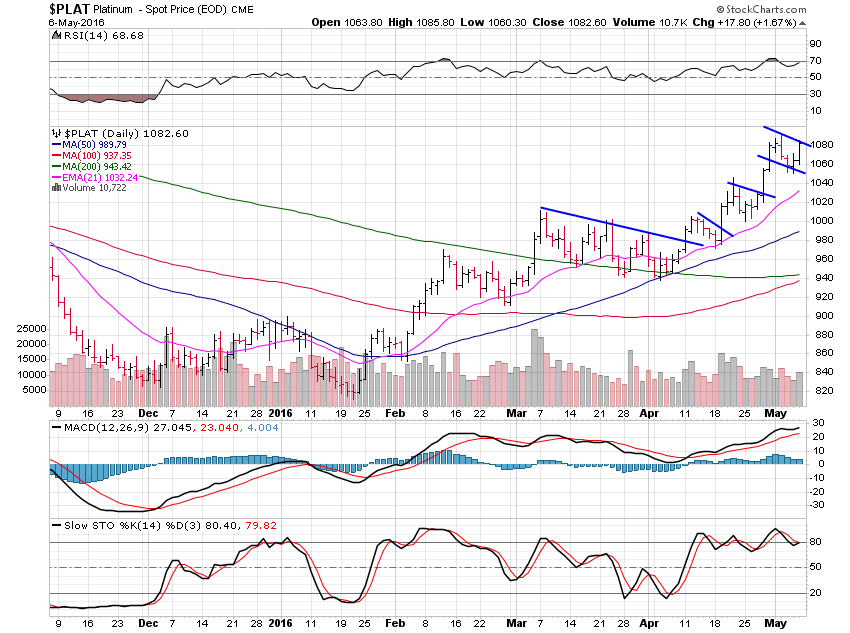
Platinum gained 0.26% this past week as it continues to move higher with small consolidation periods along the way.
This $1,080 area is resistance on the weekly charts so a little more consolidation around here would be fine and then once we breakout above $1,080 we have to look to $1,180 as the next resistance level on the weekly chart.

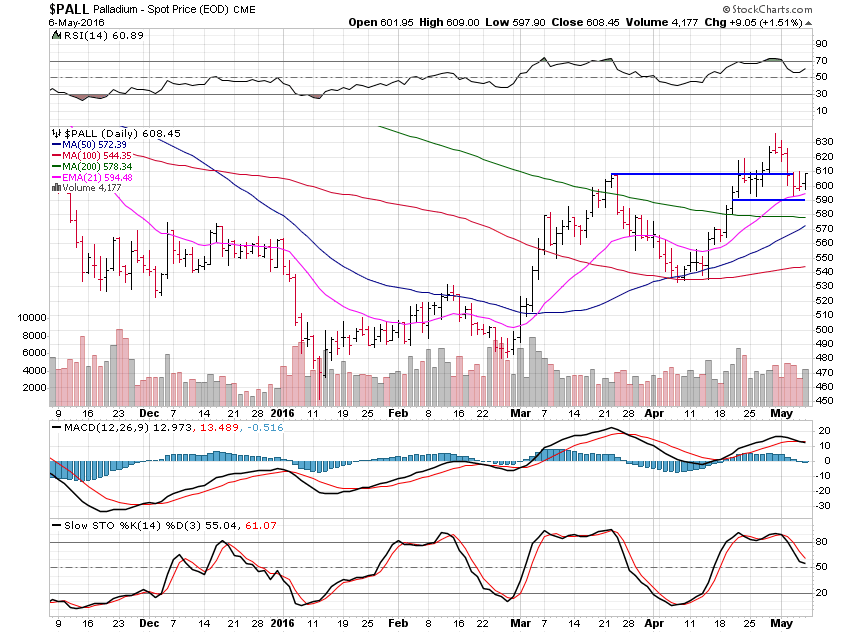
Palladium lost 2.35% this past week and may rest a bit more before continuing higher.
We may see palladium retrace back to $570 but the trend is nicely up now.
$580 is also nice support when I look at the weekly chart so more consolidation around here would be positive.
Also, on the weekly chart we have to look way up to $685 as the next resistance level to target, in time.
All in all, not a bad week for the metals while stocks are acting weaker but still not breaking lower with much force.
It’s a nice time to be in cash, as I am, and also a good time to begin to buy the metals using weakness.