Besides death and taxes – whose ultimatums we continue to try and cheat - the only two things you can truly depend on showing up on a regular basis are gravity and greed. Over the past week, the two collided in the equity markets in rather spectacular fashion, with gravity taking the day.
Granted, it’s been a while since equity traders felt the strange sensation of gravity. So long has it been, that once pressures arose, there weren’t many on deck even capable of lifting a hand.
Cue Mrs. Fletcher’s late 80’s desperate plea into the night, “I’ve fallen, and I can’t get up!” Unfortunately, the markets own LifeCall system also went down, as thousands of volatility shorts were crushed in the scramble, sending the VIX on its largest one-day spike ever.
For some of us, it’s only when gravity starts to take over that we begin to think critically about our bodies. Where did that gut even come from – and more importantly – what might it imply about our underlying health?
For stocks, the usual suspects will point out a healthy US economy growing at a decent clip, with blue-chip American companies wielding strengthening market power – essentially providing outsized earnings in a cheap capital and business friendly market environment. Throw in a healthy dose of global synchronized growth and the appetite to market and consume equities has been enormous.
Never mind that we’ve been feeding heavily from the trough for historically longer than nearly all previous equity cycles, even the typically prudent Jeremy Grantham and Ray Dalio’s of the world have recently suggested a nice finishing course of gluttony awaits us.
Dalio’s blunt suggestion merely two days before the rally peaked – “If you’re holding cash, you’re going to feel pretty stupid”, is another way of implying – to hell with regret, come join the party. Of course in classic fashion at pivotal moments the market gods don’t discriminate between maven and monkey. In their eyes – we are all mortal.
Speaking of mortality and reflection, the Bitcoin and crypto bandwagon that carried frenzied speculators up a rickety and near vertical ascent last year, now appears to be on the backside of the move, where the dominant hand of god – i.e. gravity, can exert its indiscriminate influence.
Considering the elevation and means of transportation taken by these speculative pioneers, the road back may prove treacherous – if not fatal (see XIV “traders”).
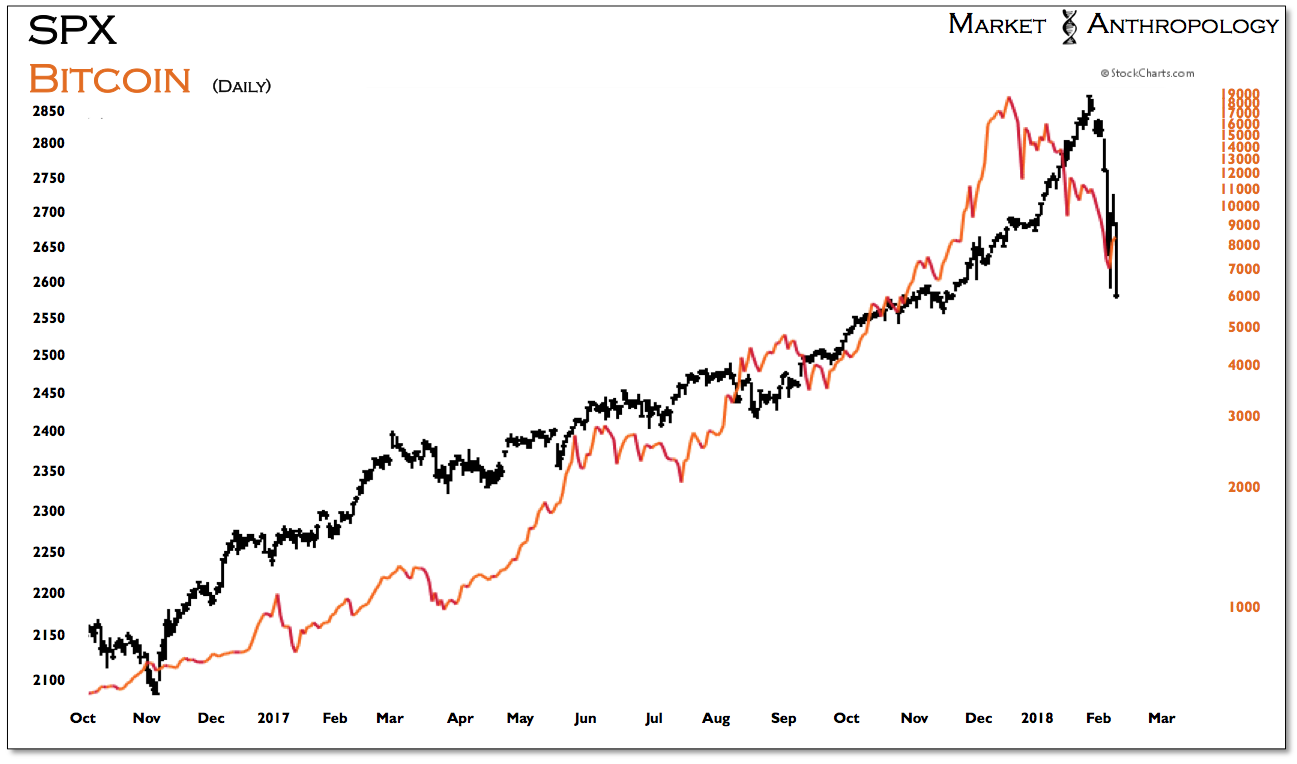
For equity investors, the violent breakdown in the crypto market at the end of December was in hindsight (as well in foresight…) the leading speculative wave that broke first.
Although equity gains were a mere pittance when compared to various crypto markets last year, the parabolic structures of the moves were quite similar, leading us to believe both markets may have put in their respective highs for some time – regardless of the benevolent economic backdrop that stocks still trade against today.
This is largely because of the inherent nature of parabolic trends, in that once the spell of a buying mania has broken, the unbridled chase that had carried the market without pause beyond more typical expectations, can not rekindle the same degree of momentum required to reestablish the uptrend.
Eventually, through the markets subsequent failures to reestablish upside momentum with higher-highs, larger and more sophisticated capital looses trust and sells, thus reinforcing the markets now negative trading dynamics.
From this perspective – and considering our most recent thoughts towards equities long-term prospects, we will be looking for a lower retracement high and eventually a lower low in the coming weeks and months.
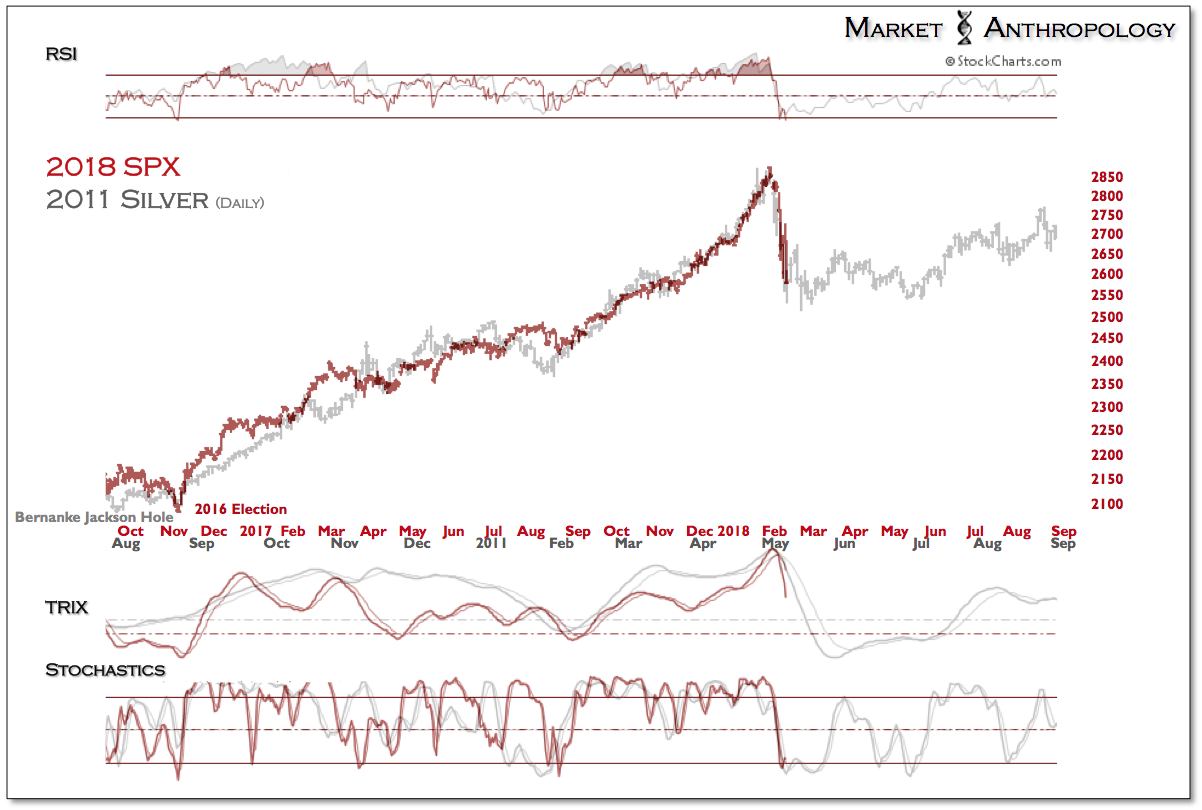
We say eventually a lower low, keeping in mind we suspect the current breakdown leg that began just last week has yet to find an interim tradable low. Sizing up the move relative to more recent parabolic breakdowns (e.g. silver , circa 5/2011), gives us a target range in the S&P 500 between 2500 and 2550.
As expected, the 10-year yield continued to climb above the highs from last year, which corresponded with the broader breakdown in equities last week. With the 10-year yield now flirting below our upside target range ~ 3 percent, longer-term Treasuries again have entered an attractive window for longs, as we suspect demand will return as the Fed ultimately defers to equity market weakness – rather than further hawkish leanings tied to potential inflationary concerns.
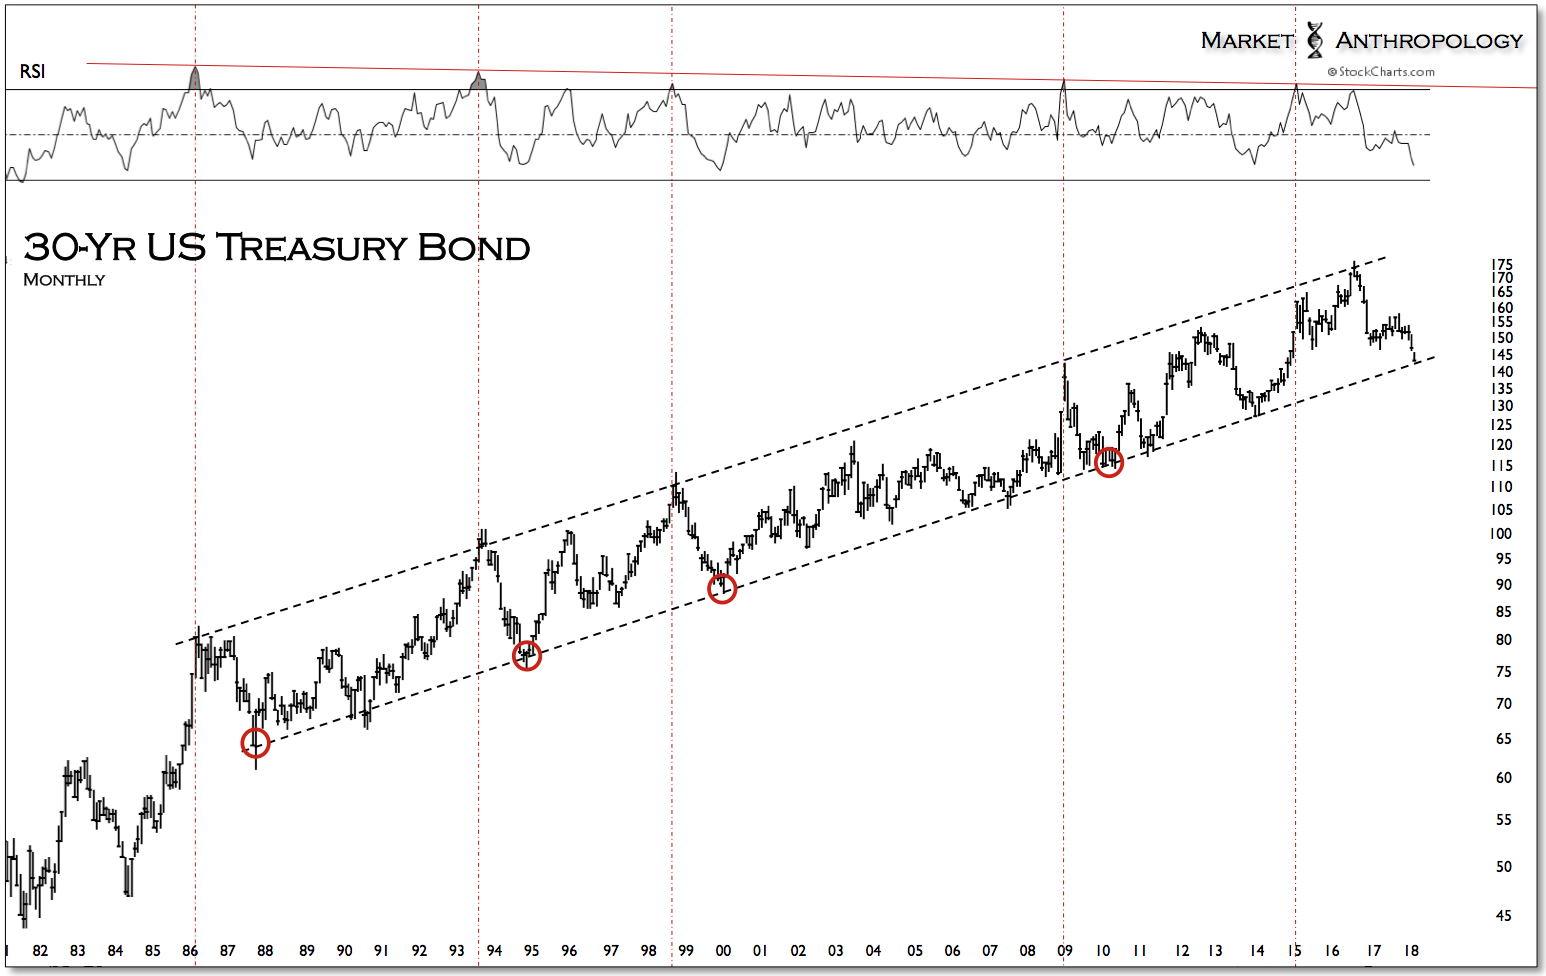
Moreover, looking back at our long-term chart of the 30-year Treasury bond, the most recent leg lower, now trades near long-term trend line support – a possible target we have been on the lookout for over the past two years.
That said, yields could continue to overshoot over the near-term, before the market becomes more confident that the Fed will restrain from further tightening.
We would guess that in this scenario, the risk of a swifter break lower below our initial target range in the S&P 500 would increase if yields continue to rise, as it did coming into the fall of 1987 when Treasuries took their final leg lower.
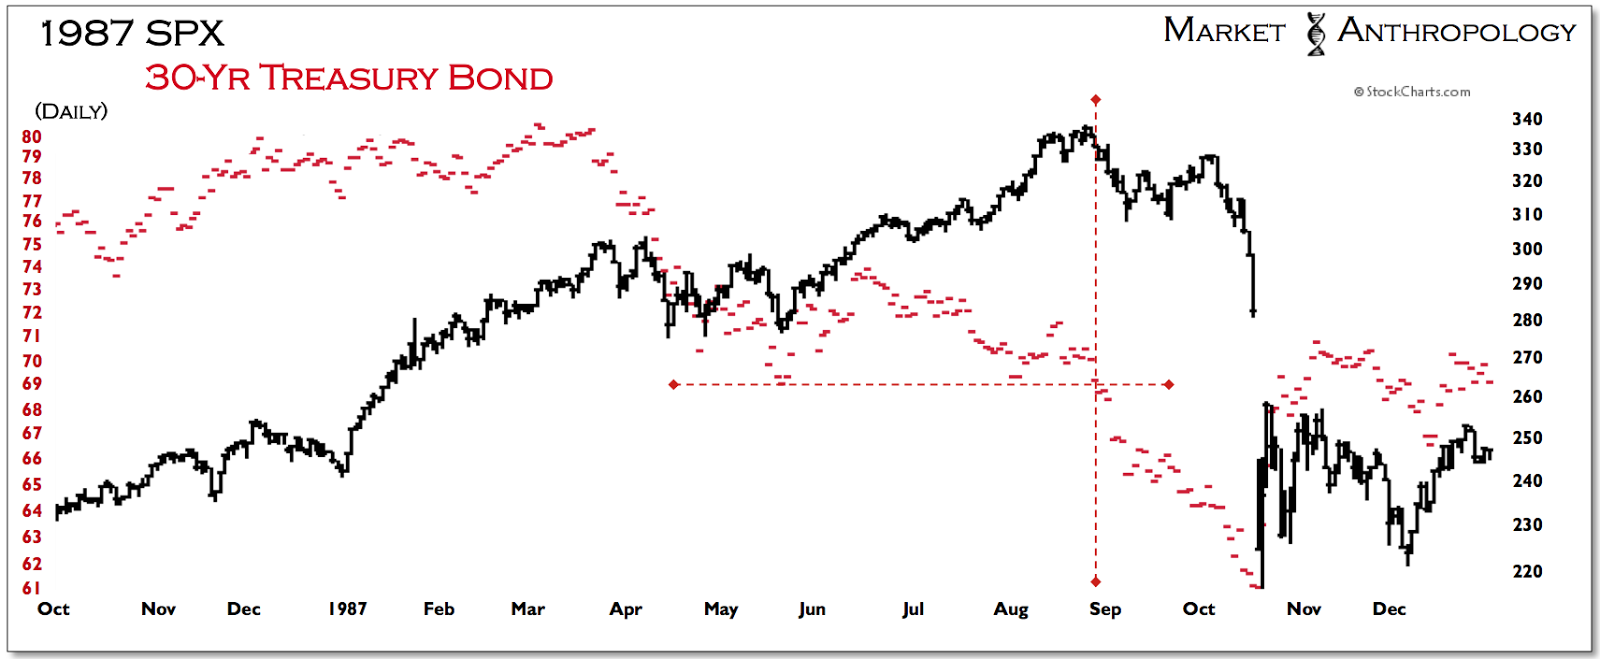
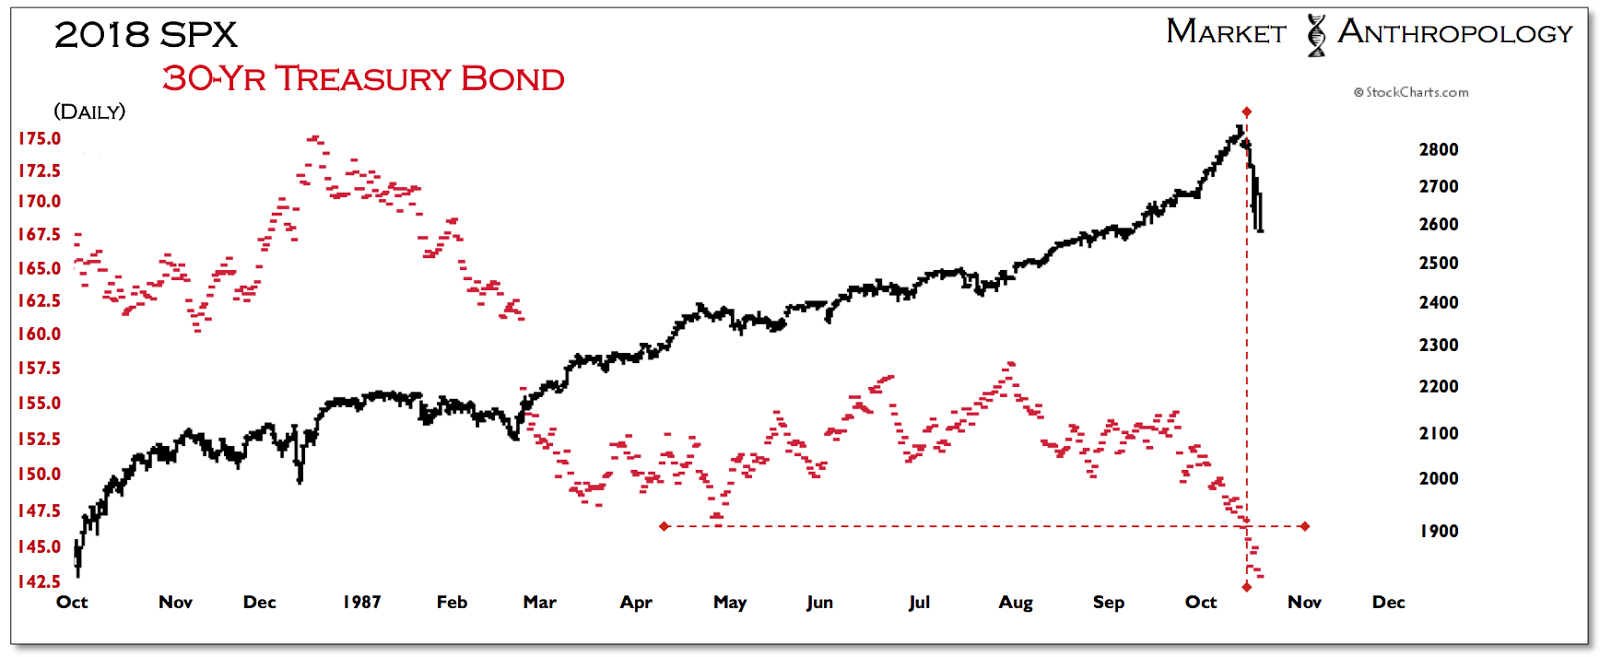
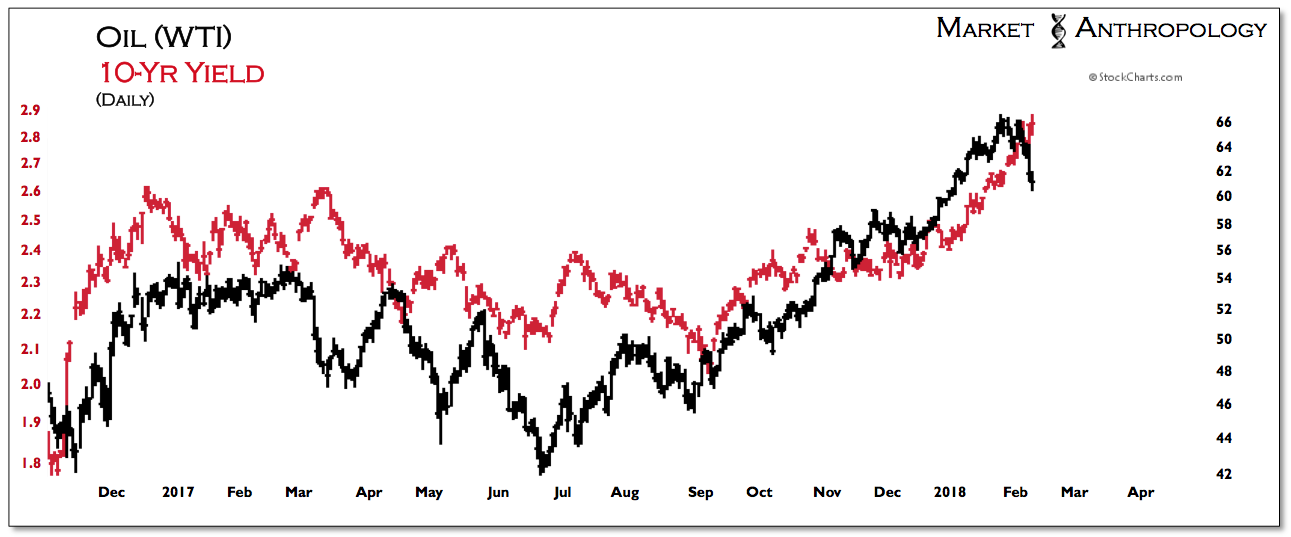
Peaking around at other markets – a word of caution towards those dip-buyers in oil today. Should yields again trade lower, it’s a decent bet that crude would mimic the trend, as it has over the past year.
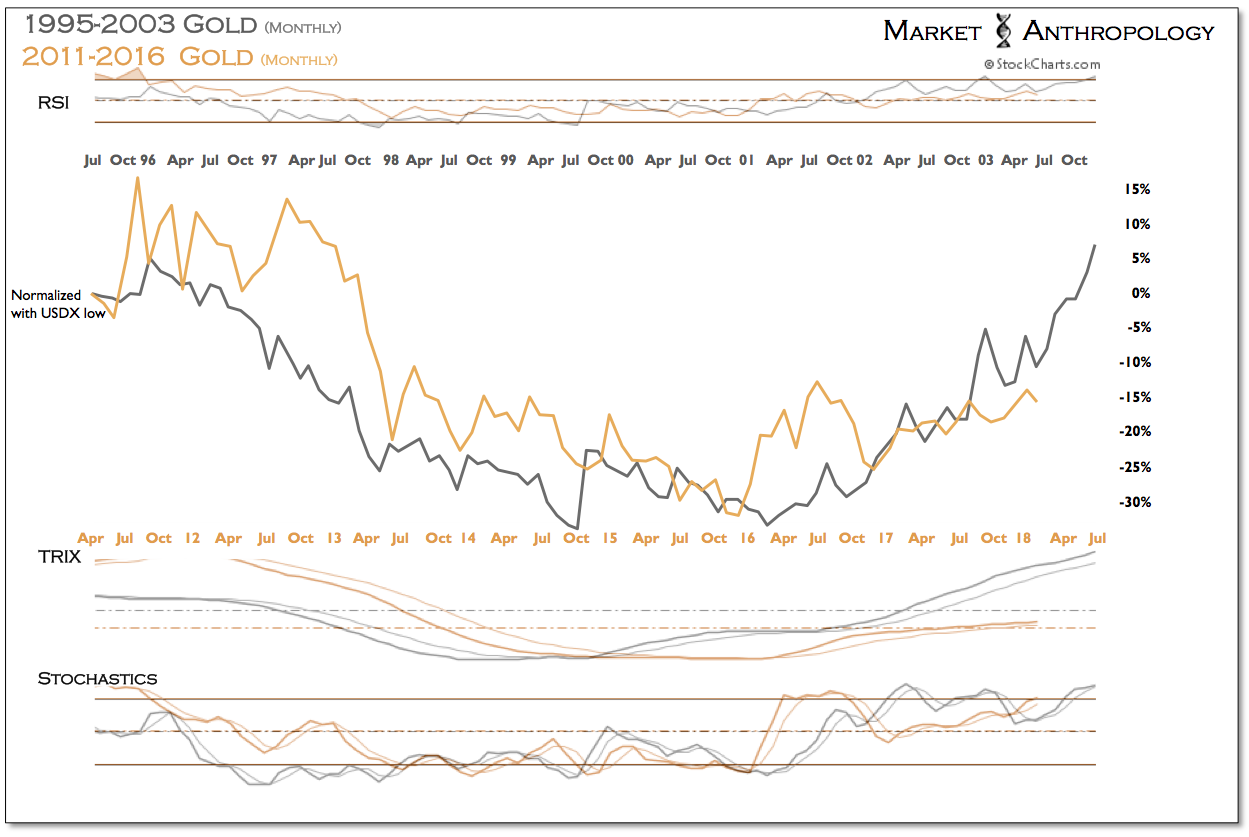
Although gold failed to capitalize on equity market weakness and break above its current cycle highs from July 2016, the modest retracement bounce in the dollar was largely at fault.
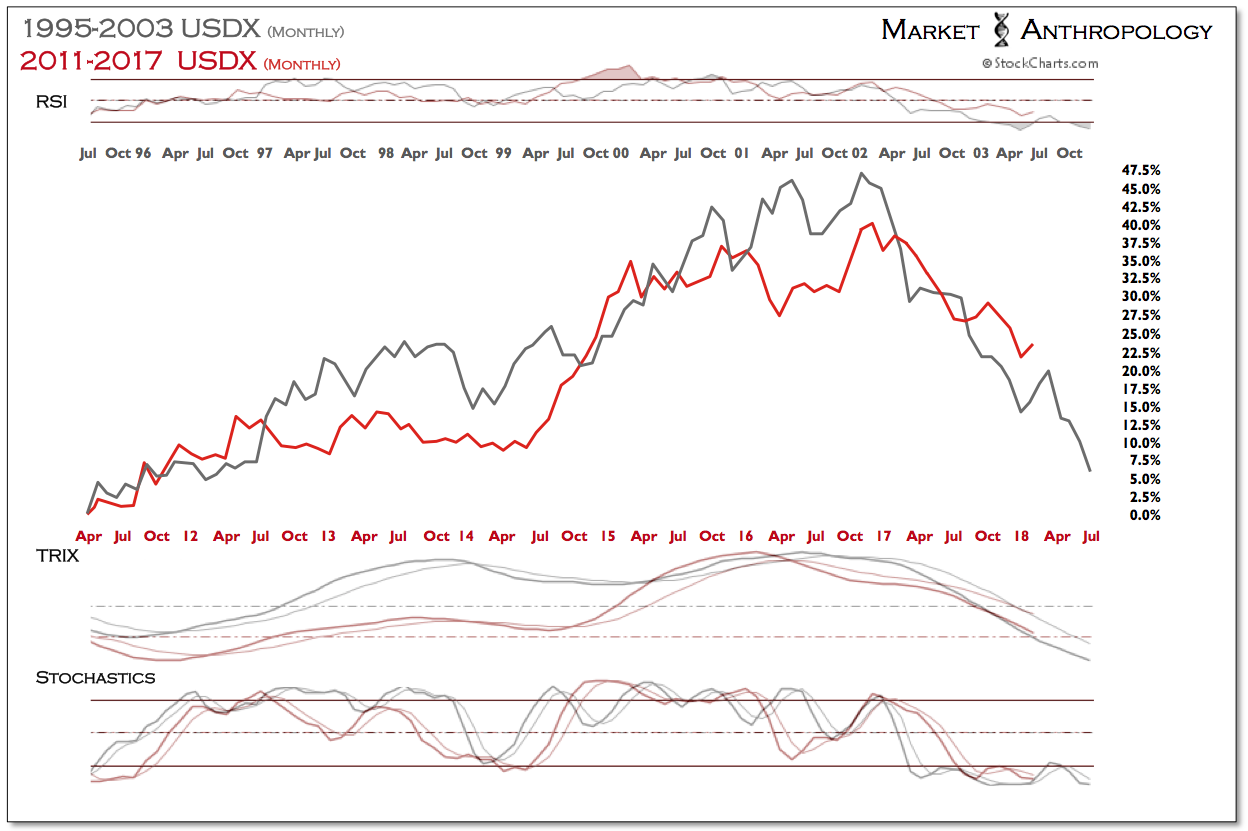
Generally speaking, the cyclical unwind in the dollar continues to make progressively negative momentum (RSI) lows, an indication technically that further weakness is still unfurling, before a more tradable interim low is reached with likely a positive momentum divergence (e.g gold, circa 7/2013).
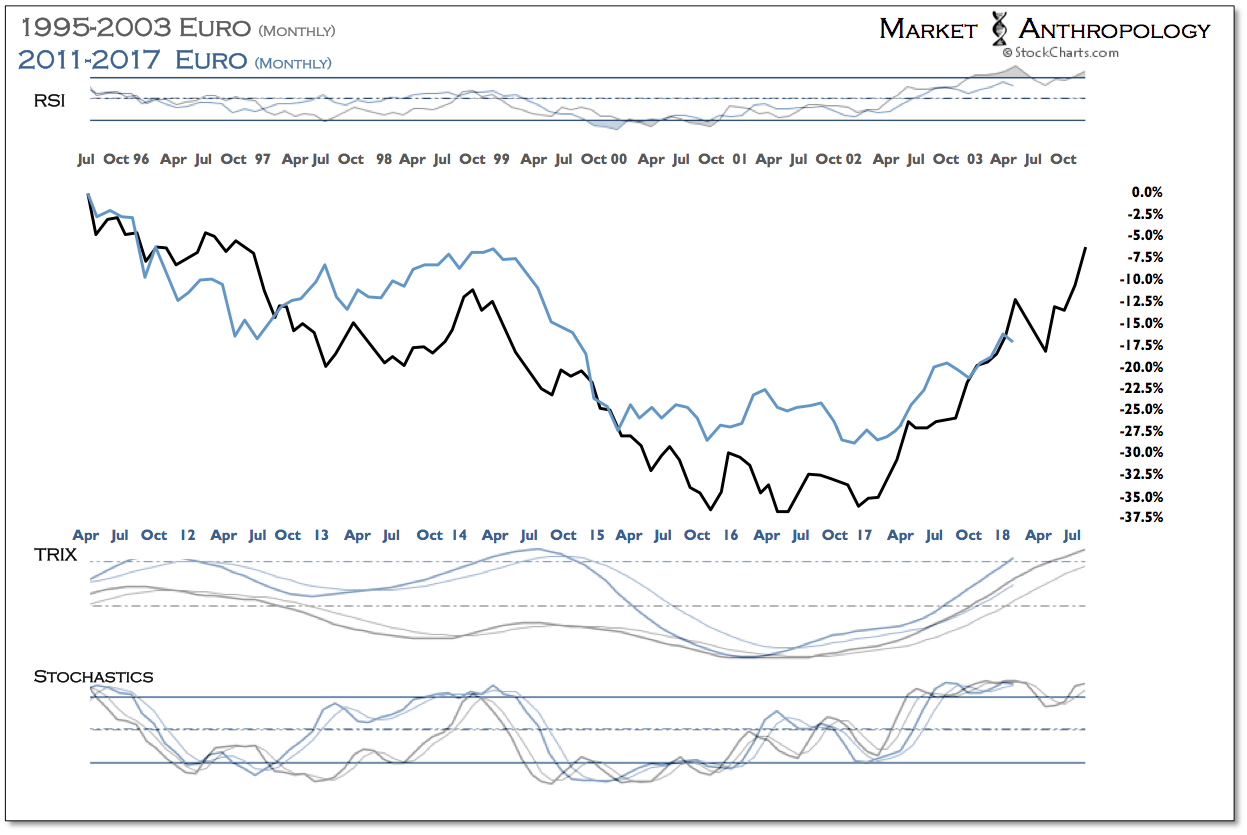
Cyclically, the dollar continues to loosely follow the previous cycle decline, which remains inherently bullish for the euro and gold.
