Amidst the earliest musings for The Gold Update of a couple of missives back, at which time the yellow metal was in a mild upward tilt whilst still entrapped in the 1280-1240 support zone, I swerved into a loyal and valued reader who remarked that the real story was the miners being en route to surpassing the performance of Gold itself on the upside. This is, of course, the wont for the shares of mining and royalty companies -- and as all engaged precious metal equities investors know -- sadly 'tis the same when on the downside. Live by the volatility, and at minimum, have a near-death experience by it: "Another gold stocks investor, Nurse Assay? ... Yes Dr. Lode, the ER is teeming with them."
Then reminding the reader whilst I am not a stocks follower per se, (beyond our various S&P 500 valuation and ranking categories as displayed at the website), that nevertheless come month's end we'll post the usual year-over-year track of Gold's percentage performance vs. those of its precious metal equities brethren, thereby vindicating such real story volatility notion. So with but one trading session left in June, let's go for it, the following chart featuring Gold itself, the HUI (ARCA Gold Bugs), the XAU (Philly Exchange Precious Metals Index), Market Vectors Gold Miners (ARCA:GDX) (the exchange-traded fund of miners) and Royal Gold Inc (NASDAQ:RGLD) (the royalty company Royal Gold):
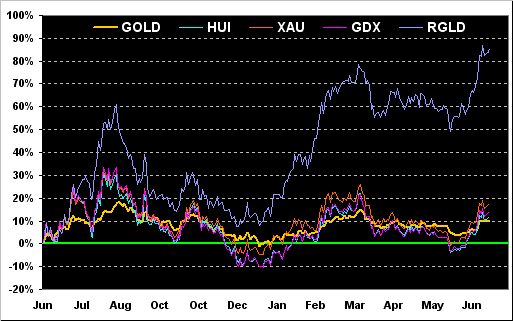
Quite the changed picture from those posted these many months, as now all of that SpringTime selling from 2013 has moved off of the chart. What is notably striking in the above view is the more volatile amplitude of the equities indices in oscillating 'round either side of Gold, as it essentially snakes through the center of them. Then, of course, there's RGLD: oh my word...
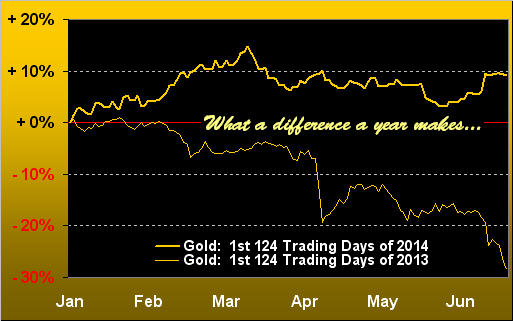
And as we displayed at the end of Q1, 'tis time again to bring up the comparative tracks of Gold year-to-date through Q2 for both 2013 and 2014. +10% surely trumps -30%, this year's broad consolidation lending more confidence to the worst as having passed:
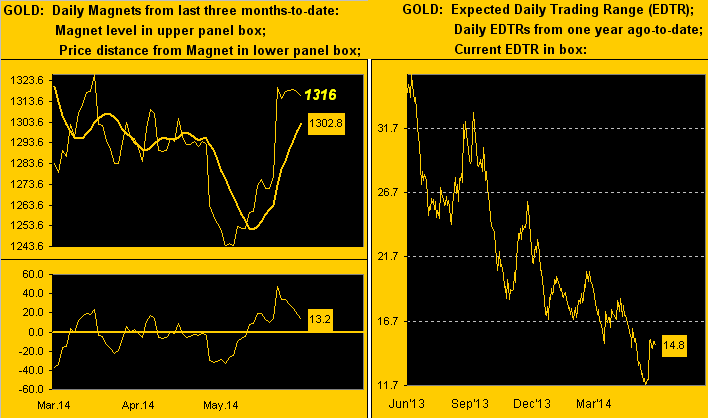
Now as for Gold's currently enjoying "the pause that refreshes", it shows stark and rightly justified per the following two panel graphic. On the left in a three-month view we've Gold's settle yesterday (Friday) at 1316, price almost childlike in curling back toward the rising Magnet as if to say, "C'mon on Mummy I beat you!" On the right in a 12-month view is further evidence of price's recent racing away so as to increase Gold's expected daily trading range between low and high to almost 15 points. Summer is heating up:
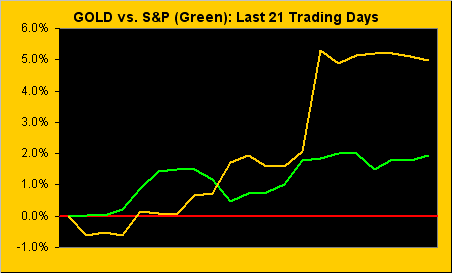
Here, too, we've Gold's pause in view, and yet in marked contrast to the chronic complacency of the ever-upward, meandering S&P, their comparative percentage tracks for the last month as follows:
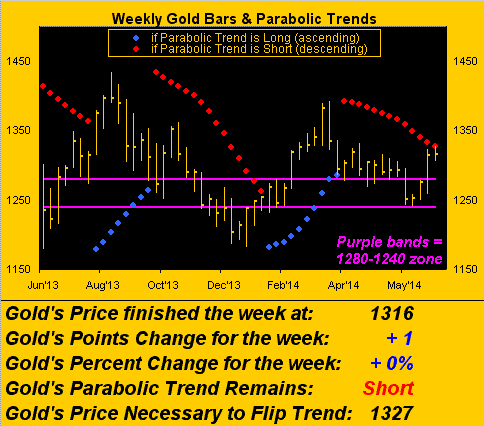
Next in turning to Gold's weekly bars -- and contrary to having penned a week ago that the parabolic trend would flip from Short to Long at 1332 -- we "missed it by that much" as Gold only reached 1326, (again having gotten too far ahead of Mummy). But as shown below, trading through 1327 in the ensuing week ought trip the flip, in turn lending support to the Daily Oscillator's already Long stance (as described a week ago) for Gold's then making the run up to 1384:
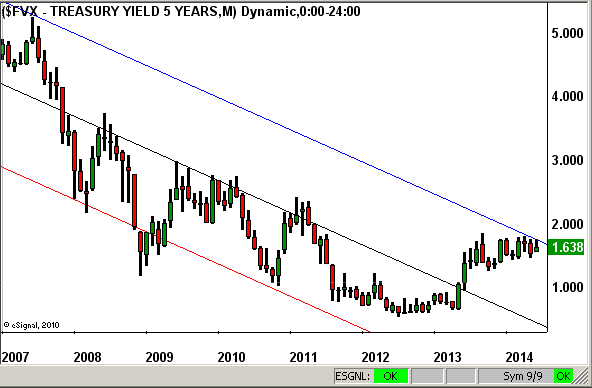
As for the state of interest rates, St. Louis' FRB president James Bullard on Thursday put forth the notion of their rising sooner than later, an arguably inflationary Gold positive. To be sure, our CPI certainly has been increasing year-to-date, the just-reported +0.4% increase for May being the largest monthly rise since last June's +0.5%. Indeed as we approach the celebration of our StateSide once-had Independence, 'tis reported that prices for hot dogs, fireworks and gasoline are at their highest levels since 2008, (the latter alone averaging $3.68/gallon -- for which here in San Francisco we'd certainly relish, having just filled up for $4.79/gallon, albeit still a bargain given France's $8/gallon). Nonetheless with such digression in mind, conversely here below we've the yield on the five-year Treasury Note since its 5.241% peak during 2007, (monthly bars-to-date). The current level of 1.638% yield for such five-year dough hardly makes its T-Note worth purchasing. But the three descending lines drawn upon the chart depict the yield's regression trend channels such as to raise an eyebrow in noting that such lowly rate may be poised for an upside breakout per the rightmost area of the graphic as the upper blue line is tested:
But then again, maybe not, the Dollar dropping to its lowest level in five weeks, at least against the ¥en, given StateSide signs of an "uneven recovery" which we deem a Gold positive. Let's look at both the Dollar and the Economic Barometer.
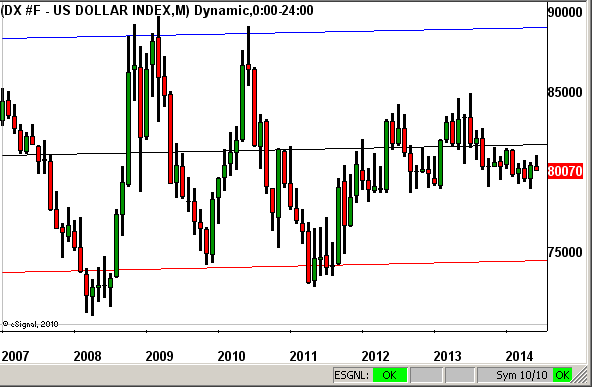
First here's the Dollar Index with the same charting presentation as used above for the T-Note yield, (monthly bars from 2007-to-date and regression trend channels). Give or take a few points, the Dollar's valuation is right around where 'twas back in '07, the overall trend being essentially "choppy-flat" with range notably narrowing:
"But how can that be, mmb? Our money supply is up almost 40% since then!"
A perfectly logical deduction that, Squire, but allow me to very loosely state: "so is everybody else's". Which is why we oft say that Gold plays no currency favourites. Moreover, the total mined Gold supply since 2007 is up just a wee two-tenths of one percent, (assuming some 165,000 total metric tons on the planet, increasing at a paltry pace of just 50 metric tons per year). Reason enough for Gold to already be hovering about $2,000/oz., (depending upon the starting point from where one measures). Still, with respect to the prior interest rate graphic, there is quite the disconnect with the Dollar, such as to opine that either the former rise, else the latter dive. Either way, through these years of quantitative easing both StateSide and 'round the world, there's been a heckova lot more accounting units of currency created than physical units of Gold.
Second given that notion of our economy's "uneven recovery", here again is the Econ Baro having just gracefully recovered from stepping into a pothole borne of April/May reportings for weakness in Industrial Production, Capacity Utilization, the NAHB Housing Index, Consumer Sentiment and Leading Economic Indicators, albeit those and other surveys have since righted themselves a bit, (at least for the present):
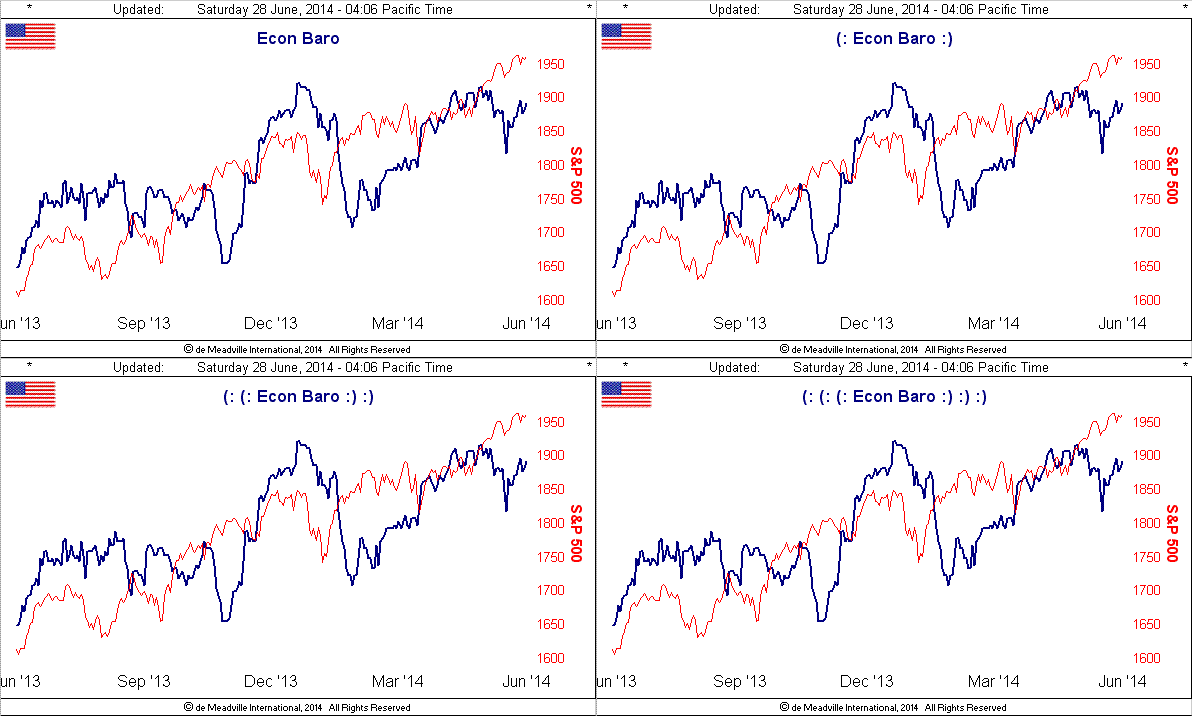
Indeed the S&P, which continues to climb within the context of such "uneven recovery", is apparently simply expecting interest rates to remain at almost nil levels with, at some point, a return to more "free QE".
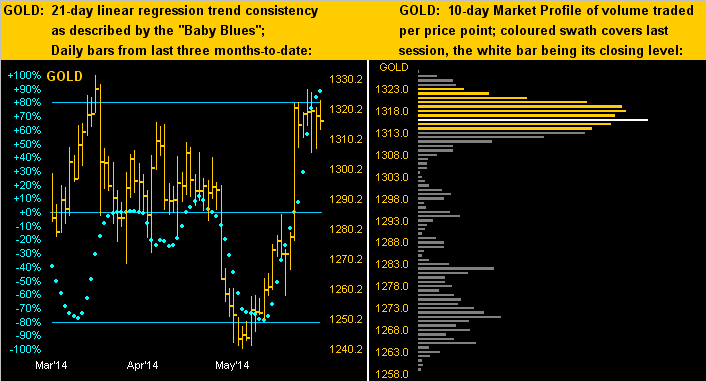
We maintain that Gold sees such ultimately debasing realities as well. Others of course do not, as evidenced per certain analysts' quotes by which we breezed during the week, collectively as “... the surge in gold can’t sustain itself ... it was a temporary spike because of a confluence of events ... people are leaving gold in search of something better ... you’ve had a bit of safe-haven demand and a bit of inflation-hedge demand ... the view doesn’t change on gold, because this is temporary ..." Same old negative nabob pap. I'd say the following two panel graphic looks quite healthy for Gold going forward.
On the left, the "Baby Blues" have done it! Those blue dots of 21-day linear regression trend consistency having surpassed their +80% level now confirms such trend as up, (duh!). Last July, upon eclipsing the +80% level, Gold traded higher by 100 additional points within five weeks. Then similarly this past January, upon eclipsing the +80% level, Gold traded higher by 110 additional points in some six weeks. A repeat performance from here thus puts Gold into the 1400s. Go Blues! On the right, FRiday's settle (1316) is spot on the longest bar in Gold's Market Profile, meaning that more Gold contracts have traded at 1316 than at any other price in the last 10-trading days (two weeks). Should the aforementioned parabolic weekly trend indeed flip to Long in the new week and the daily Price Oscillator study's Market Rhythm target of 1384 remain in tact, that large clump of trading in these low 1300s ought be brilliant support toward the run to higher levels and a year's new high above 1392:
In wrapping it up for this week, and again with the spectre of higher interest rates lurking about in the minds of some, one has to wonder what the dear Old Lady of Threadneedle Street must think after having been referred to as an "unreliable boyfriend" by Parliamentary Treasury Committee member Pat McFadden, the target of course being Mark Carney. To summarily paraphrase The Guv: "Rates may riser soon than expected ... but not really". 'Tis similar to our StateSide confusion as herein noted via Mr. Bullard's suggestion that rates may rise sooner than later, only to be offset by others pointing to the economy's "uneven recovery". Certain central bank figures may well make for strange bedfellows, but to drag in the Old Lady, indeed question her very gender, is quite deserved of reproach by polite society, wouldn't you say? Ghastly...