All institutional analyst eyes are on this week’s central bank announcements from Japan and America. Most gold community analysts seem to have a difficult time grasping the idea that Japan’s fiat currency is viewed by top forex money managers as a safe haven, albeit less of one than gold.
The Japanese government is a huge debtor, but the citizens are even bigger creditors,and the bottom line is that the weakness of the debtors is superseded by the strength of the creditors.
It’s possible that the Bank of Japan fires a “bazooka” this week, but how that will affect the Japanese stock market, the dollar-yen trade, and gold… is unknown.
Goldman Sachs analysts believe that a Kuroda bazooka shot will strengthen the dollar and make the Japanese stock market surge higher.
In contrast, Morgan Stanley believes the bazooka shot will have the opposite effect; the Japanese stock market rally will fail, and the dollar will fall against the yen.
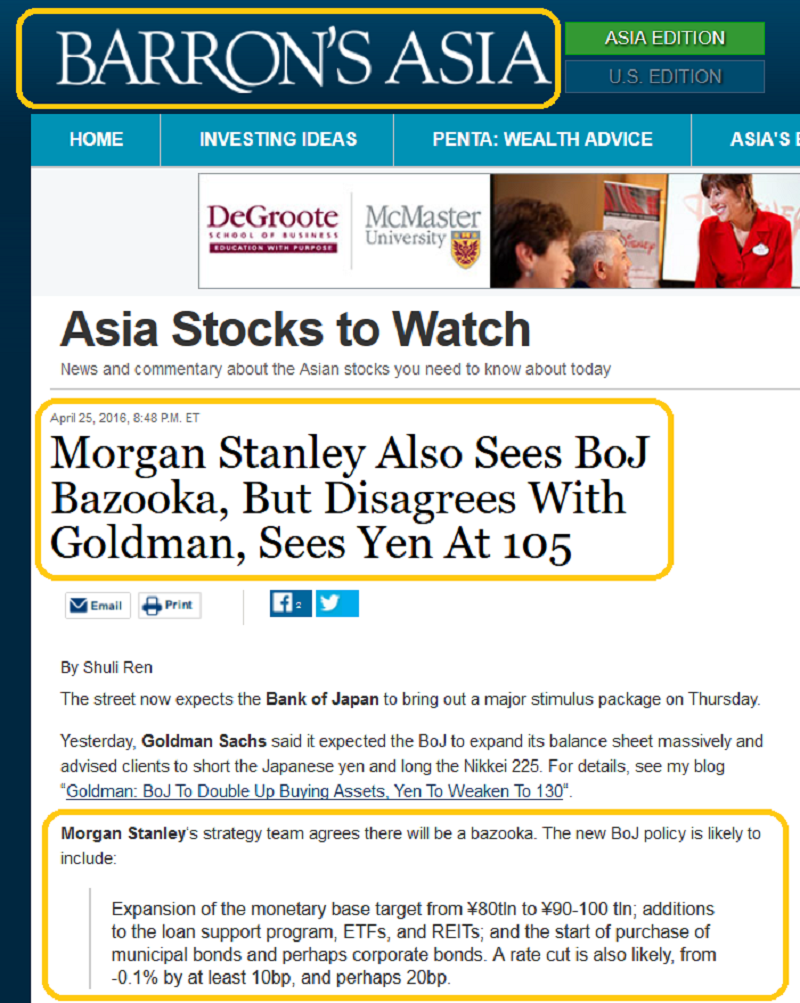
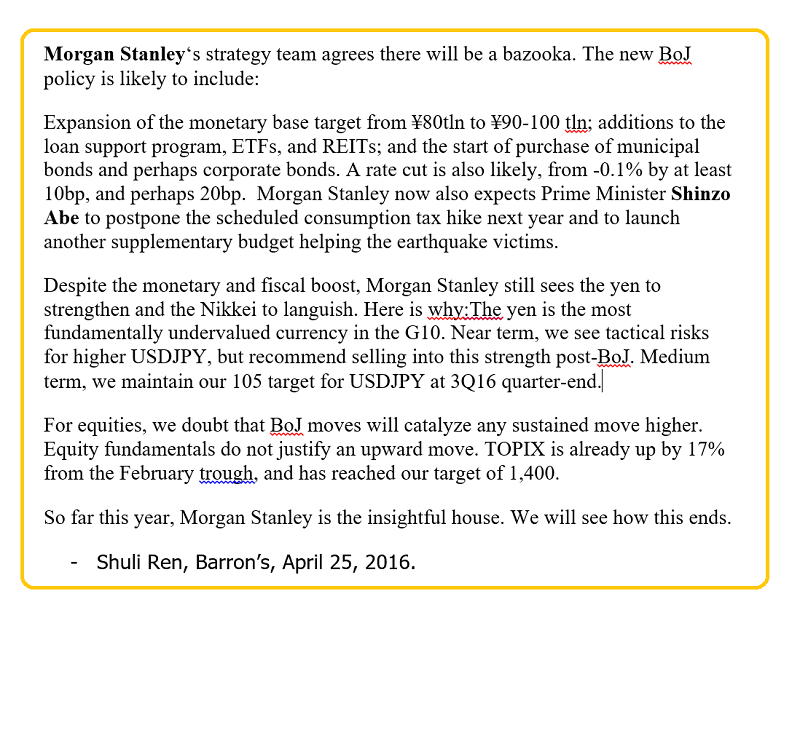
I think Morgan Stanley’s team will likely prevail. Here’s why:
Kuroda is attempting to send the stock market higher just as the seasonally weak month of May arrives, and that’s a tall order, especially when powerful money managers at Morgan Stanley (NYSE:MS) are going to use any strength to exit the market.
The US central bank is also in an interesting position right now. The NIRP policies adopted by Japan and Europe are viewed as failures by more and more top money managers around the world, yet just one small US rate hike caused a huge global stock market sell-off, and a safe haven surge into the yen and gold.
If Janet Yellen raises rates at any time this year, an even bigger global stock market tumble than the last one is likely. If she leaves rates unchanged, or joins “Team NIRP” and actually cuts rates, it could cause a loss of confidence event with central banks in general, and an enormous institutional gold buying binge is quite likely to happen.
In terms of the fear trade, gold is clearly sitting in the best win-win position of many years.
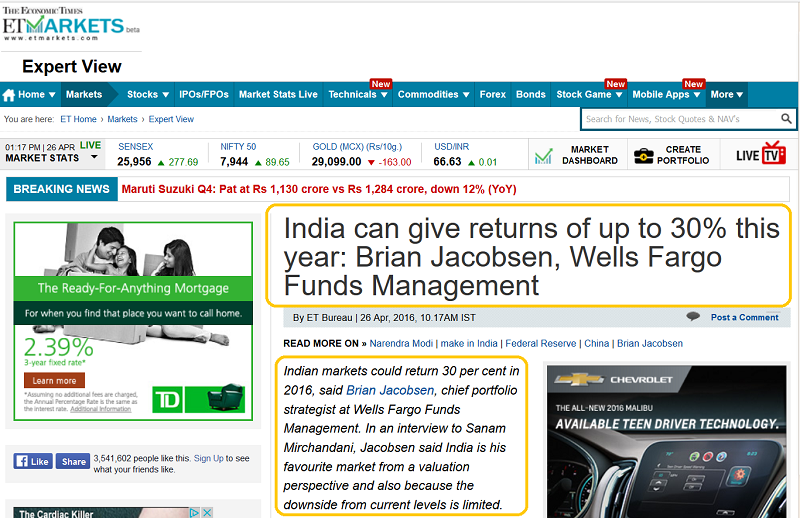
I’ve been emphatic that India is entering a one hundred year “gold-oriented bull era”. Stock market enthusiasts in the Western gold community should focus on Indian stock market ETFs, rather than on “hail Mary” plays with the aging empire of America.
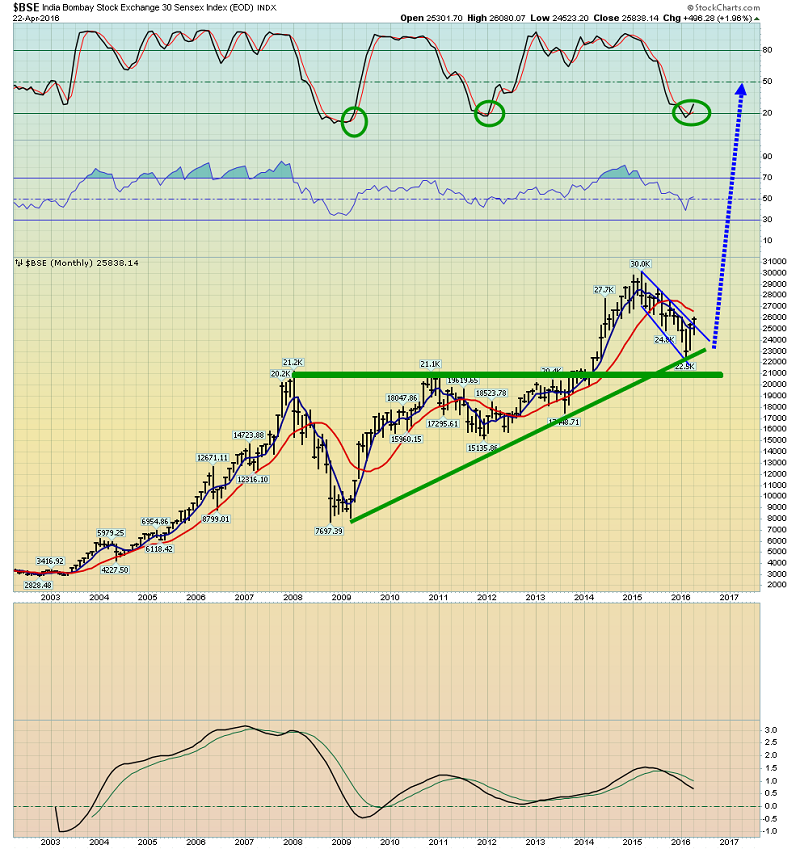
From a technical perspective, the Bombay Stock Exchange (BSE) index looks truly spectacular.
I think the BSE is likely beginning the greatest bull move in the history of global stock markets. Eager investors can use INDA-NYSE to get in on the upside action.
Interestingly, as Indian markets soar, the US stock market rally is likely to drift aimlessly, and a crash to below the 2009 lows cannot be ruled out.
That’s because US stock buybacks have massively distorted price/earnings ratios, and without the QE lifeline, large money managers are showing real concern about being invested in American markets.
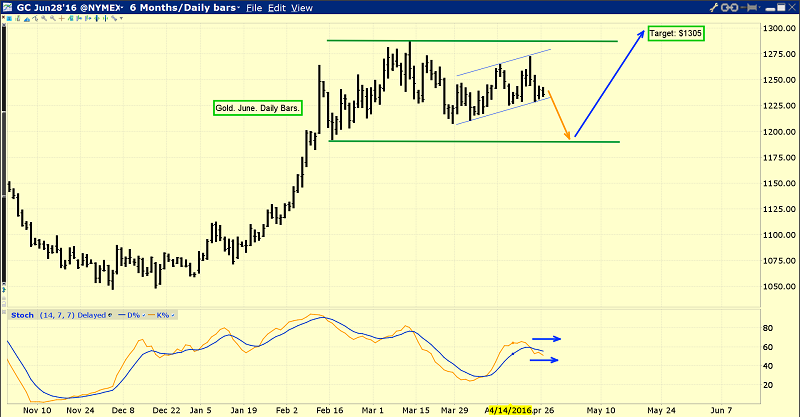
Gold is the world’s ultimate asset, and it’s showcasing a beautiful rectangular consolidation pattern against the dollar, on this daily chart.
Sizable volatility is likely as the Fed and the BOJ make their announcements. After a likely pullback towards $1190, gold should rise towards my $1305 target price, and then onto $1320, $1350, and $1380.
Fear needs to be tossed aside. Short term pullbacks offer superb entry points for all ultimate asset enthusiasts!
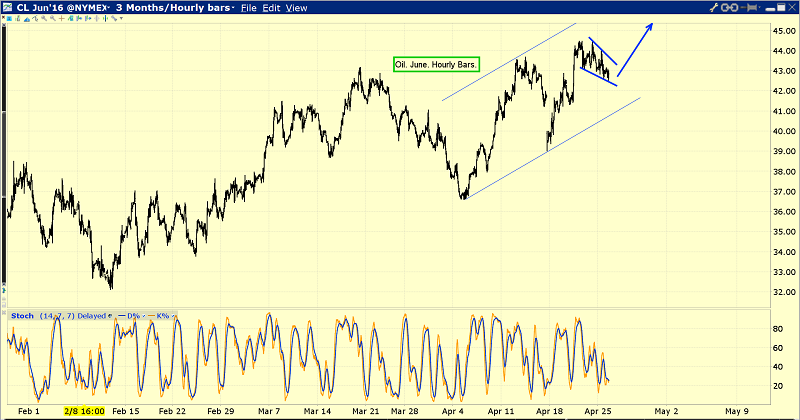
This is the hourly bars oil chart. Oil is the largest component of most commodity indexes, and there’s a nice bull wedge pattern in play.
Chinese demand for commodities is rising again, and many large US money managers believe an up-cycle for inflation lies just ahead. I don’t think they will stop allocating money to the sector because of any short term concerns, and most gold stock charts look somewhat like the “oil chart on steroids”.
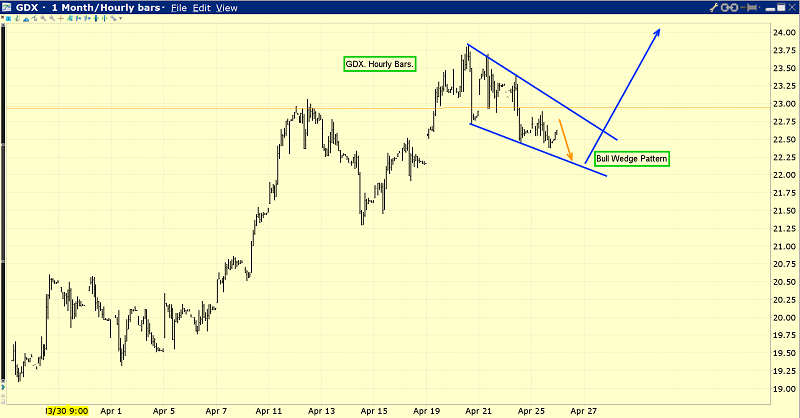
This is the Market Vectors Gold Miners (NYSE:GDX) hourly bars chart. The bull wedge pattern is almost identical to the oil chart wedge. All ten percent price corrections in gold stocks should be bought aggressively. Stock market investors can’t avoid India just because they lost money in US markets after Y2K. Likewise, Western gold stock investors can’t focus on past gold stocks losses. It’s a new era. It’s a gold bull era, and it’s time for the Western gold community to embrace it with open arms.
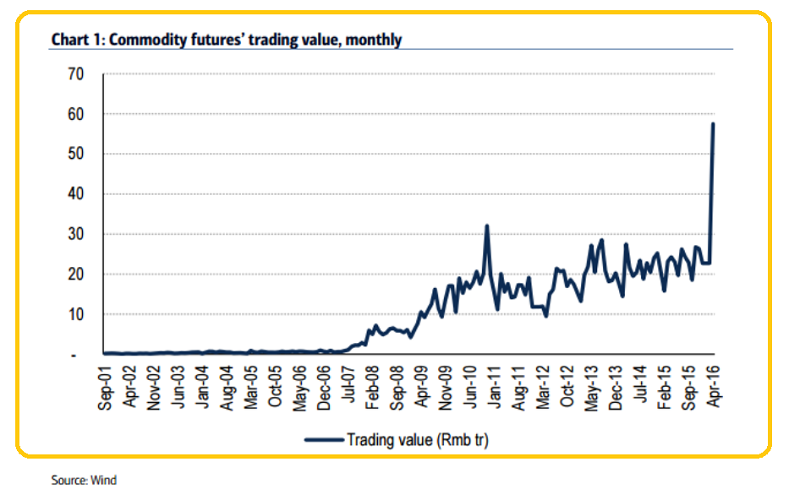
This is a nice Chinese commodity exchanges volume chart. I predicted a soft landing for the transition of the Chinese economy from an exports-orientation to domestic consumption, followed by a surge in gold buying. That’s exactly what has happened, and I’ll dare to suggest the upside fun has only just started!
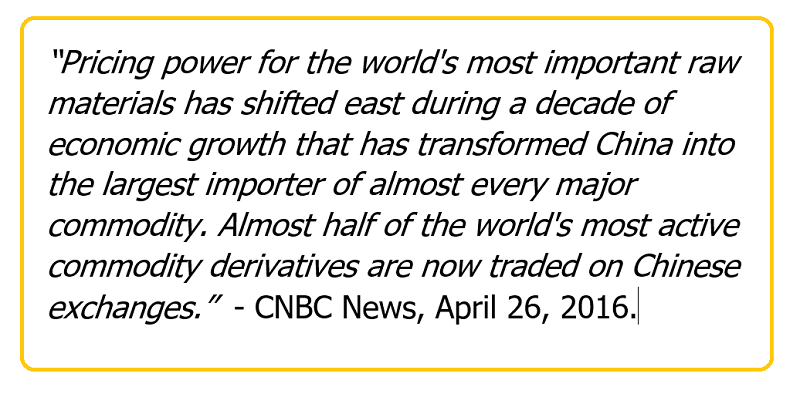
Western mainstream media is beginning to note the growing power of Chinese exchanges in major commodity price discovery.
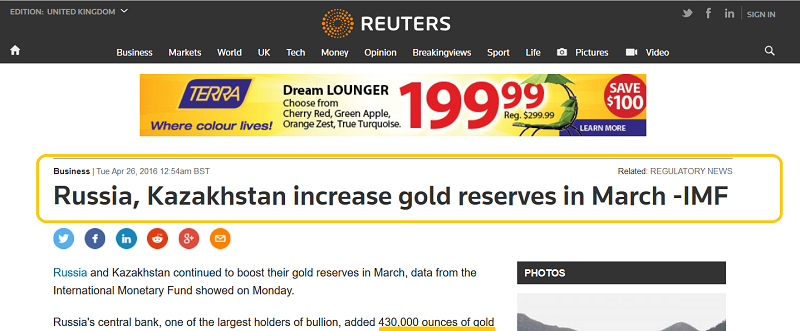
Russia’s central bank continues its relentless monthly gold buy program, as does the PBOC, the central bank of China. Western gold and silver community investors should be modest buyers of all small pullbacks, and bigger buyers of any “price correction” that ultimately appears. It’s time to say good-bye to tears and fears, and say hello to about one hundred years of bull era fun!
Risks, Disclaimers, Legal: Stewart Thomson is no longer an investment advisor. The information provided by Stewart and Graceland Updates is for general information purposes only. Before taking any action on any investment, it is imperative that you consult with multiple properly licensed, experienced and qualified investment advisors and get numerous opinions before taking any action. Your minimum risk on any investment in the world is: 100% loss of all your money. You may be taking or preparing to take leveraged positions in investments and not know it, exposing yourself to unlimited risks. This is highly concerning if you are an investor in any derivatives products. There is an approx $700 trillion OTC Derivatives Iceberg with a tiny portion written off officially. The bottom line: Are You Prepared?
