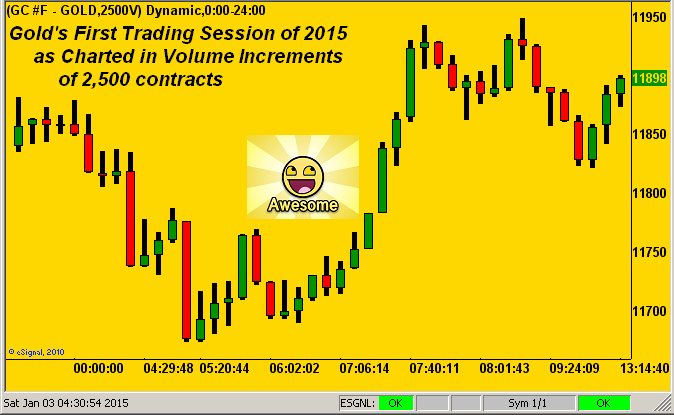
One day up, 251 days to go. And Gold's first trading day of the year yesterday (Friday) was exemplary of Long positions being initiated even in the face of a surging Dollar Index, which of its own accord leapt out of the 2015 chute to close at a level (91.383) not seen since 2005. Gold did not open the year with a huge up day, closing just seven points higher from 2014's final 1183 settle, at 1190. But it was the conviction on Gold's BuySide to which we took heart, especially as the S&P 500's fireworks opening comprehensively fizzled out. A telling theme perhaps for the year ahead: out of worthless paper and into substantive wealth? Wouldn't that be lovely. Although one trading day does not a year make, so as to share with you the buying conviction in the Gold trade, the following chart is the full first session of 2015 as charted by volume, each "candle" in the series representing 2,500 Gold contracts traded. Red candles represent net selling and green candles net buying. And look at the buying power across the center of the chart during the 07:00 hour (Pacific Time), price pounding higher with one green candle after another. That's what we call "Big Boy Buyin'" right there:
So: 'tis a welcome start to 2015 for Gold, which was also a podium "top three" finisher as we turn to the final standings of the BEGOS Markets for 2014:
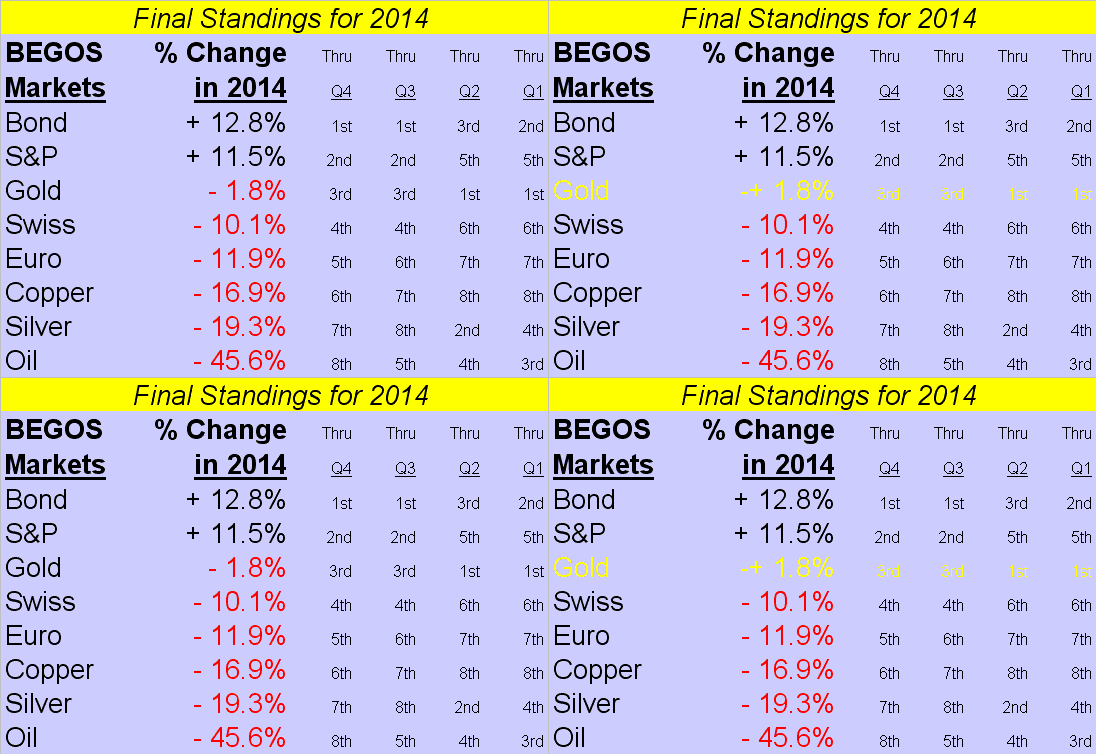
Observe the market at the top of the standings: the 1st place Bond. Its portended ruination has been anything but. And yet, one might pity the poor Bond, for 'tis the stock market that gets all the headlines, the S&P finishing a close 2nd place. But the Bond was the better buy, +12.8% (year-end yield-to-maturity 2.749%) vs. the S&P's +11.5% gain (year-end dividend yield 1.957% and "live" p/e 29.1x ... scary). Finally, contrary to popular opinion (aka: "those who mimic others without actually doing the work"), to round out our podium finishers in 3rd place was Gold , -1.8%, which also garnered the vaunted "Who Knew?" award for surprisingly not going to zero ("0") as would the nattering nabobs of Gold negativism have us believe. That said, I suppose one ought give some deserved due to the Gold Shorts, for had you shorted a Gold contract at the 2014 open of 1204.5 and bought it back at the 2014 close of 1183.2, you'd have made $2,130 (a 48% gain on $4,400 requisite margin) ... congratulations: have a banana. If instead you'd gone Long one Bond contract, you'd have made $15,626 (a far more impressive 676% gain on $2,310 requisite margin). To wit, a well-known investment bank is currently pushing its Bond products under the slogan: "Boring is the new Exciting". Still, all that said, we'll stick with Gold, thank you very much.
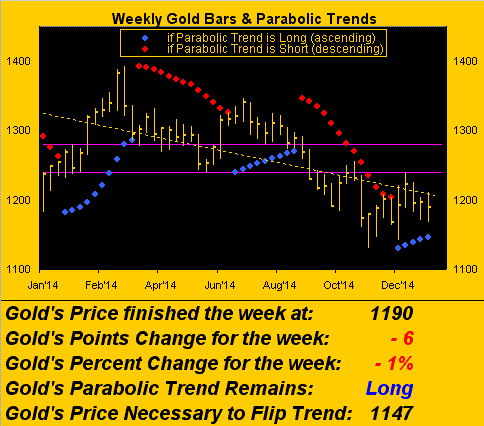
And as we next turn to Gold's weekly bars, their track is essentially that for the entirety of 2014, plus yesterday. Per the rightmost blue dots, the Long parabolic trend now has five weeks under its belt and 43 points of wiggle room with which to play. But as mentioned a week ago, (as well as in the website's Prescient Commentary), Gold's negatively-positioned daily Price Oscillator has a Market Rhythm Target of 1164, such that we're prepared to tolerate some near-term retrenchment, ideally to again be met with further buying conviction similar to that which we saw yesterday, and thus keep the Long trend alive:
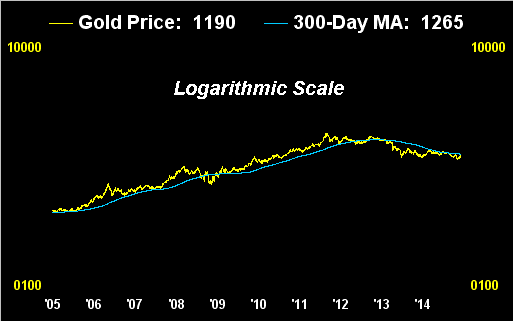
Again in lending support to the notion that Gold has become thoroughly "sold-out", as most recently described a week ago via the dominate up-thrust of price's "mega-days", and as shown above with this year's opening BuySide conviction, let's revisit our broadest measure: price vis-à-vis its 300-day moving average. Here we've the daily tracks of the two for the last 10 years-to-date; and in viewing them on a logarithmic scale, the downside bent of the average appears to be flattening out:
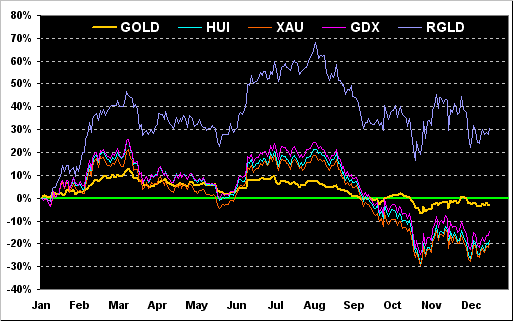
Returning to the one-year time frame, with the passing of another month, 'tis time to bring up Gold's year-over-year percentage track and compare it to those of the Gold Bugs Index ("HUI"), the Philly Exchange Precious Metals Index ("XAU"), the exchange-traded fund for miners ("GDX") and the ever-rollickin' royalty company Royal Gold ("RGLD"). One might say the underlying equities entities are gathering strength toward surpassing Gold itself to the upside, their Golden lava beginning to rumble:
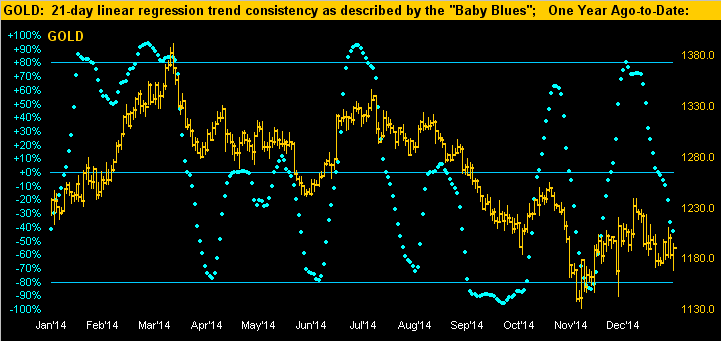
Now: as we move on to Gold's daily bars with their "Baby Blues" indicative of 21-day linear regression trend consistency, we've a special New Year's treat for you. A valued reader recently wrote in expressing a preference for the three-month display of the following graphic over the one-month display. We generally present those displays interchangeably as to whether we're stressing the overall ebb and flow of the blue dots, or zooming in on "the now". But in this case for kicking off the new year, we've blown the doors off the graphic to show the full year-over-year view. Successful trading is 50% borne of getting direction correct and 50% borne of judicious cash management. And as you can see below, trading with the rising or falling direction of the baby blue dots shall generally put one in good stead of trend, prudent account management being in the balance. As many of you know, the three-month views of the Baby Blues for all eight of the BEGOS Markets are updated daily at the website; however in celebrating the arrival of 2015, here for your New Year's viewing pleasure, is Gold's entire year-over-year display:
Next, 'twould not be apropos to commence the New Year without regard to Gold's pricing structure. So here we go with the defined strata, indicative of the terrific amount of upside work facing Gold. And just to get price back up into "The Floor", Gold would have to record an above-average year: the average annual change in price over the last 14 years is +12.293%, which would find Gold settling this year at just 1329. Gold's best year of the past 14 was 2007 in which it finished +31.348%: to repeat that performance in 2015 would put price by year's end at 1554 -- still in "The Floor"! But we'd gladly take it:
for sure
"But mmb, your opening scoreboard says Gold outta be 2460 right now!"
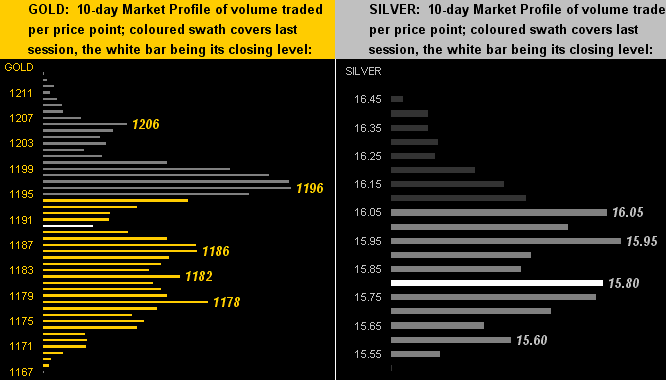
And so 'twill come to pass, Squire: 'tis simply "the when" and conservatively approaching "then" with a reasonable analytical assessment. To round out 2015 somewhere within "The Floor" as shown above would be an admirable achievement. As for price moving up and beyond 2000+ toward becoming commensurate with currency debasement, 2460 is hardly far-fetched: for surely as price has fallen by as many as 793 points from Gold's All-Time High (1923) in just over three years, so can it return back up with like swiftness, even more acceleratively so. 'Tis happened before, (for example the 755% rise in less than four years from 102 in '76 to 873 in '80: to repeat same from here puts price at 8993, just in case you're scoring at home). Nevertheless, in our taking a collective deep breath, let's turn to the present and the 10-day Market Profiles for both Gold on the left and Silver on the right, their respective trading supporters and resistors as therein labeled:
Thus, with the trading battles of 2015 and Gold's long road to recovery underway, we'll wrap it up here with these two notes:
1) EuroCurrencies: Within the context of the Dollar Index's having closed yesterday at a 10-year high, the €uro in turn has lurched down to a 4-1/2 year low, as the FinMedia put it "...on clear indications that the European Central Bank will soon embark on outright money-printing..." Naturally, neither you nor I are surprised by this, for 'tis been inevitable all along, and moreover 'twill in due course recur here StateSide as well. But the real eye-catcher yesterday was the Swiss Franc returning to parity against the Dollar. How cool is that? You can now embark on that ski vacation to glorious Gstaad and not have to do math as CHF1 now = $1. The rub, of course, it that what costs one Dollar here will set you back multiple Francs on your alpine adventure. For example, the tumbling Oil price may have our cost for one gallon of gasoline averaging $2.22, but CHF2.22 will barely buy you a litre's worth en Suisse: the one gallon equivalent there will run you CHF6.81 (which of course at parity= $6.81). Best to take the train.
2) California: Only our silly little State could come up with this. The powers that be are now requiring new chicken cage standards that allow sufficient space for the hens to move about, stretch their wings, and so forth. What's next for our poultry pals? Driver's licenses? Don't laugh: beginning yesterday, illegals (I'm sorry: "undocumented immigrants") can officially apply for them, the Department of Motor Vehicles bringing on more than 1,000 additional workers to handle the demand. I tell ya folks, in a State, indeed a world, that has gone certifiably stoopid, I hope you're stackin' plenty of Gold: 'tis the smart thing to do!