With two weeks to the U.S. presidential election, some traders may have chosen wisely not to bet big— and some, not to bet at all. Both stances are understandable given the uncertainty of the outcome, notwithstanding whatever the polls are saying.
But what if you’re a gold trader who intends to hold the position in hand or even double down on it? What are the likely scenarios that await you?
There are positive and negative conclusions out there, and these are independent of the election result.
But a good part of these logical deductions—comprising both fundamental drivers and technicals—may have to do with one thing: the U.S. coronavirus stimulus and whether an agreement of any sort will be reached later today between Treasury Secretary Steven Mnuchin and House of Representatives Speaker Nancy Pelosi.
Whilst no one expects paycheck protection to reach the American people before the Nov. 3 election, an agreement to put the process in play after the vote could be an instant market booster for gold.
U.S. gold for December delivery settled Monday’s official trading session up $5.30, or 0.3%, at $1,911.70 an ounce, just before news broke that sufficient gap remained between Pelosi and Mnuchin for a deal. The two are to speak again today.
Gold Beholden To Stimulus News; Few Have Faith In A Deal Though
Those in the gold market don’t seem to have too much faith in the talks, with the December contract sliding by $8.55, or 0.5%, to $1,903.15 by 1:37 AM ET Tuesday.
Spot gold, which reflects real-time trades in bullion, was down $3.63, or 0.2%, at $1,900.51.
Jeffrey Halley, Sydney-based analyst at OANDA in New York, wrote:
“Financial markets are very much locked into tail-chasing mode as the noise from the U.S. elections, fiscal stimulus and COVID-19 provide so much noise, they drown out the lyrics.”
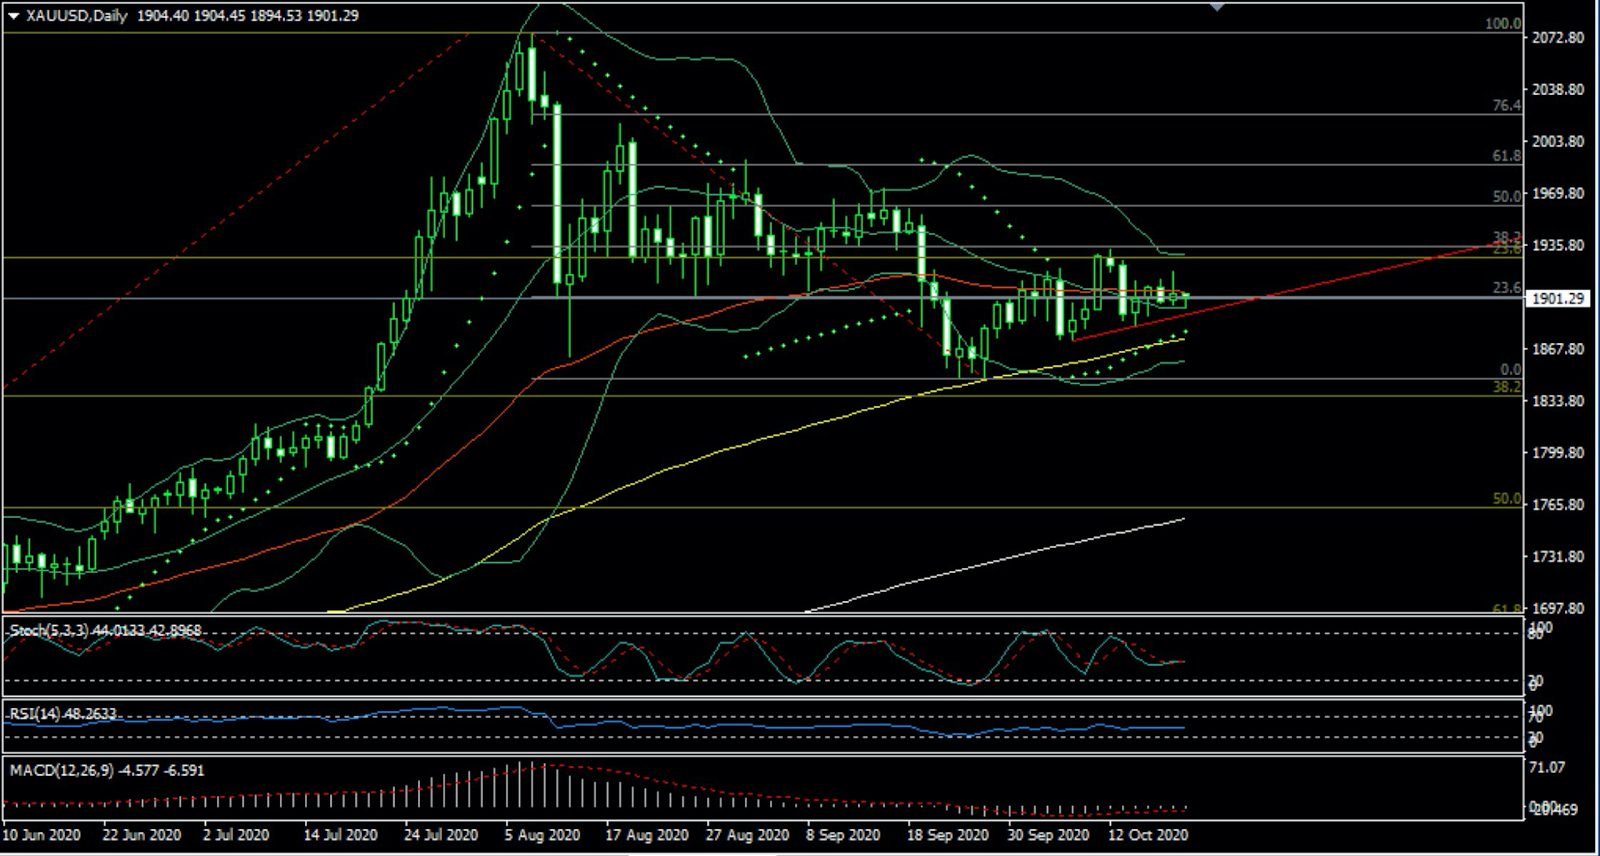
“Gold continues to range-trade each side of $1,900 an ounce in subdued range trading. It is clear that gold is moving to nuances in other markets, and not on gold fundamentals alone. However, the ever-compressing ranges continue to form a triangle formation that suggests a massive breakout is coming, with a potential to move over $100 an ounce.”
Halley said, technically, the top of the triangle for gold lies at $1920, while the base was at $1,890, with the 100-Day Moving Average behind that at $1,875 an ounce.
“A daily close above or below those levels signalling a breakout is finally commencing. In all likelihood though, the driver will come from elsewhere, and hence, waiting to see which way the tree falls is probably the wisest strategy for now.”

Charts courtesy of Sunil Kumar Dixit
Independent gold chartist Sunil Kumar Dixit has significant moves both ways in his view, though he believes the upside will be greater if Pelosi and Mnuchin were to announce an agreement in principle.
In an email to Investing.com, Dixit said of spot gold:
“Technical set up has some contradictions which translates to traders remaining cautious on the fate of stimulus. Daily Stochastics and RSI (Relative Strength Indicator) indicate sideways to up bias as long as $1900 handle holds with rally possible for 1920-1927-1935 for Spot Gold while weakness likely below 1898 for retest of 1873 the 100 Day SMA.”

On a broader perspective, the yellow metal was trapped inside the 23% Fibonacci level of $1,927 and 38% Fibonacci level of 1836, Dixit says, adding:
“Range-break on either side should open a move for some 90 dollars.”
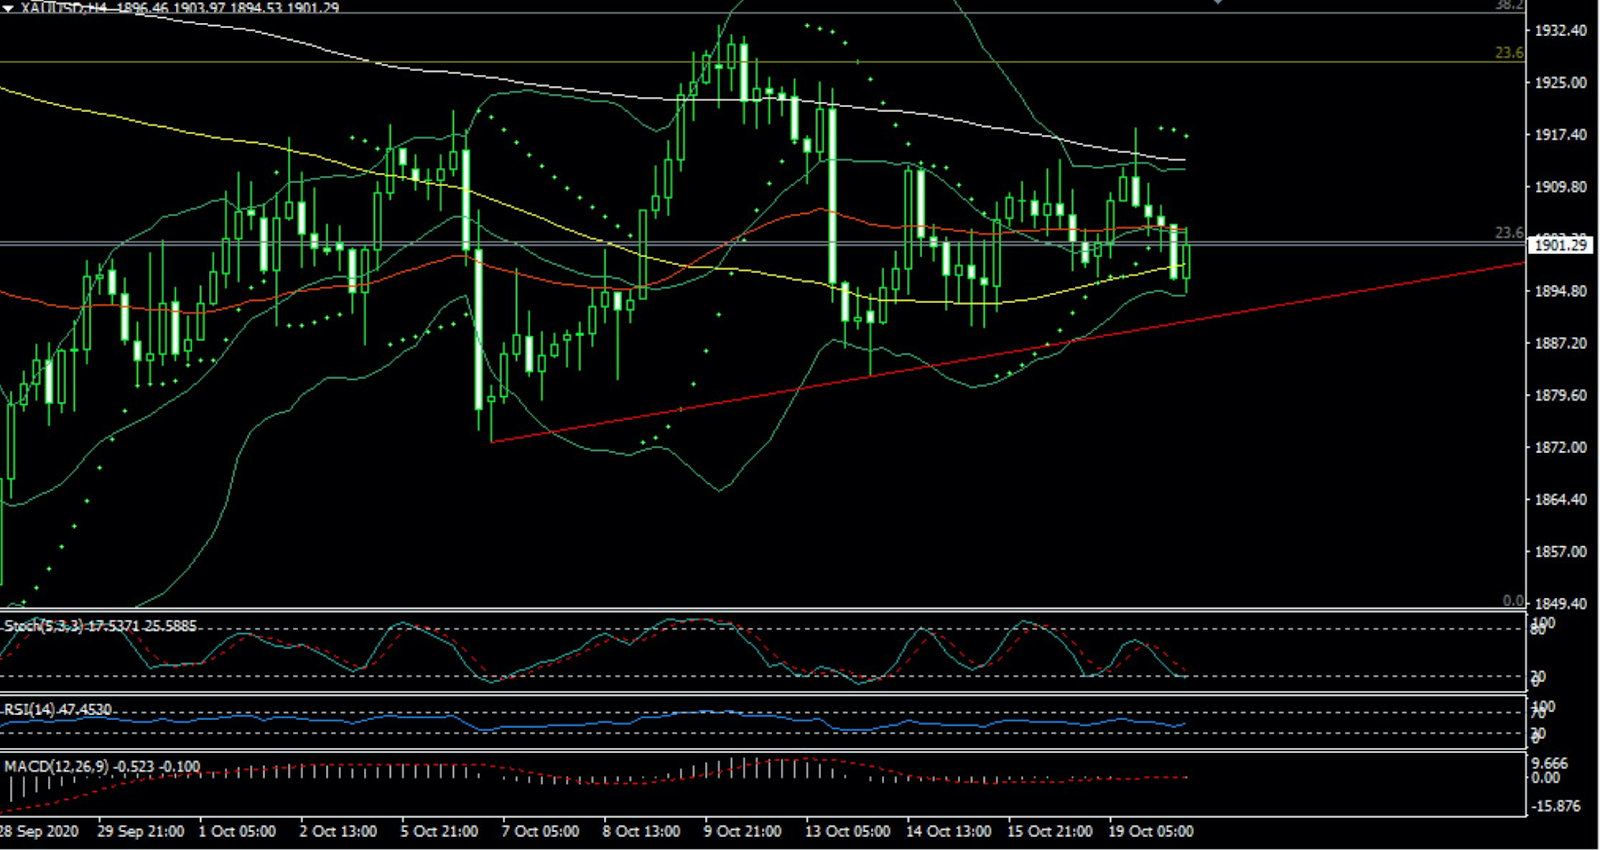
Anil Panchal said he expected gold to stay sluggish around $1,901 while heading into Tuesday’s European session, and, in doing so, the yellow metal would respect the pullback from a short-term support line while staying below short-term resistances—namely the 200-bar Simple Moving Average and a falling trend line from Sept. 16.
In a blog posted on FXStreet, Panchal wrote of spot gold:
“With the MACD (Moving Average Convergence Divergence) suggesting no clear direction, traders will prefer waiting for a clear break of either $1,918, comprising the resistance line, or a downside break of the support line figures near $1,894.”
However, the $1,900 threshold and 200-bar SMA level of $1,913 can work as filters during the quote’s further moves, he argues.
“Additionally, the bullion’s run-up past-$1,918 will challenge the monthly high of $1,933 ahead of probing the mid-September peak surrounding $1,973.”
“On the contrary, gold bears’ dominance below $1,894 will have multiple supports around $1,890 and $1,880/75 before directing the precious metal towards the September 28 low of $1,848.82.”
Investing.com itself has a “Strong Sell” on spot gold’s 5-, 10- and 15-minute, and the one- and 5-hourly charts. The only “Buy” signals are on the weekly and monthly charts.
The deepest downside or support is at $1681.92 while the highest resistance or bullish level is $2,112.45.
However you proceed, use caution and remember: the trend is your friend.
Don’t fight the tape.
Disclaimer: Barani Krishnan does not own or hold a position in the commodities or securities he writes about.
Which stock should you buy in your very next trade?
AI computing powers are changing the stock market. Investing.com's ProPicks AI includes 6 winning stock portfolios chosen by our advanced AI. In 2024 alone, ProPicks AI identified 2 stocks that surged over 150%, 4 additional stocks that leaped over 30%, and 3 more that climbed over 25%. Which stock will be the next to soar?
Unlock ProPicks AI

